fig2

Computer vision for efficient object detection and segmentation in molecular image analysis

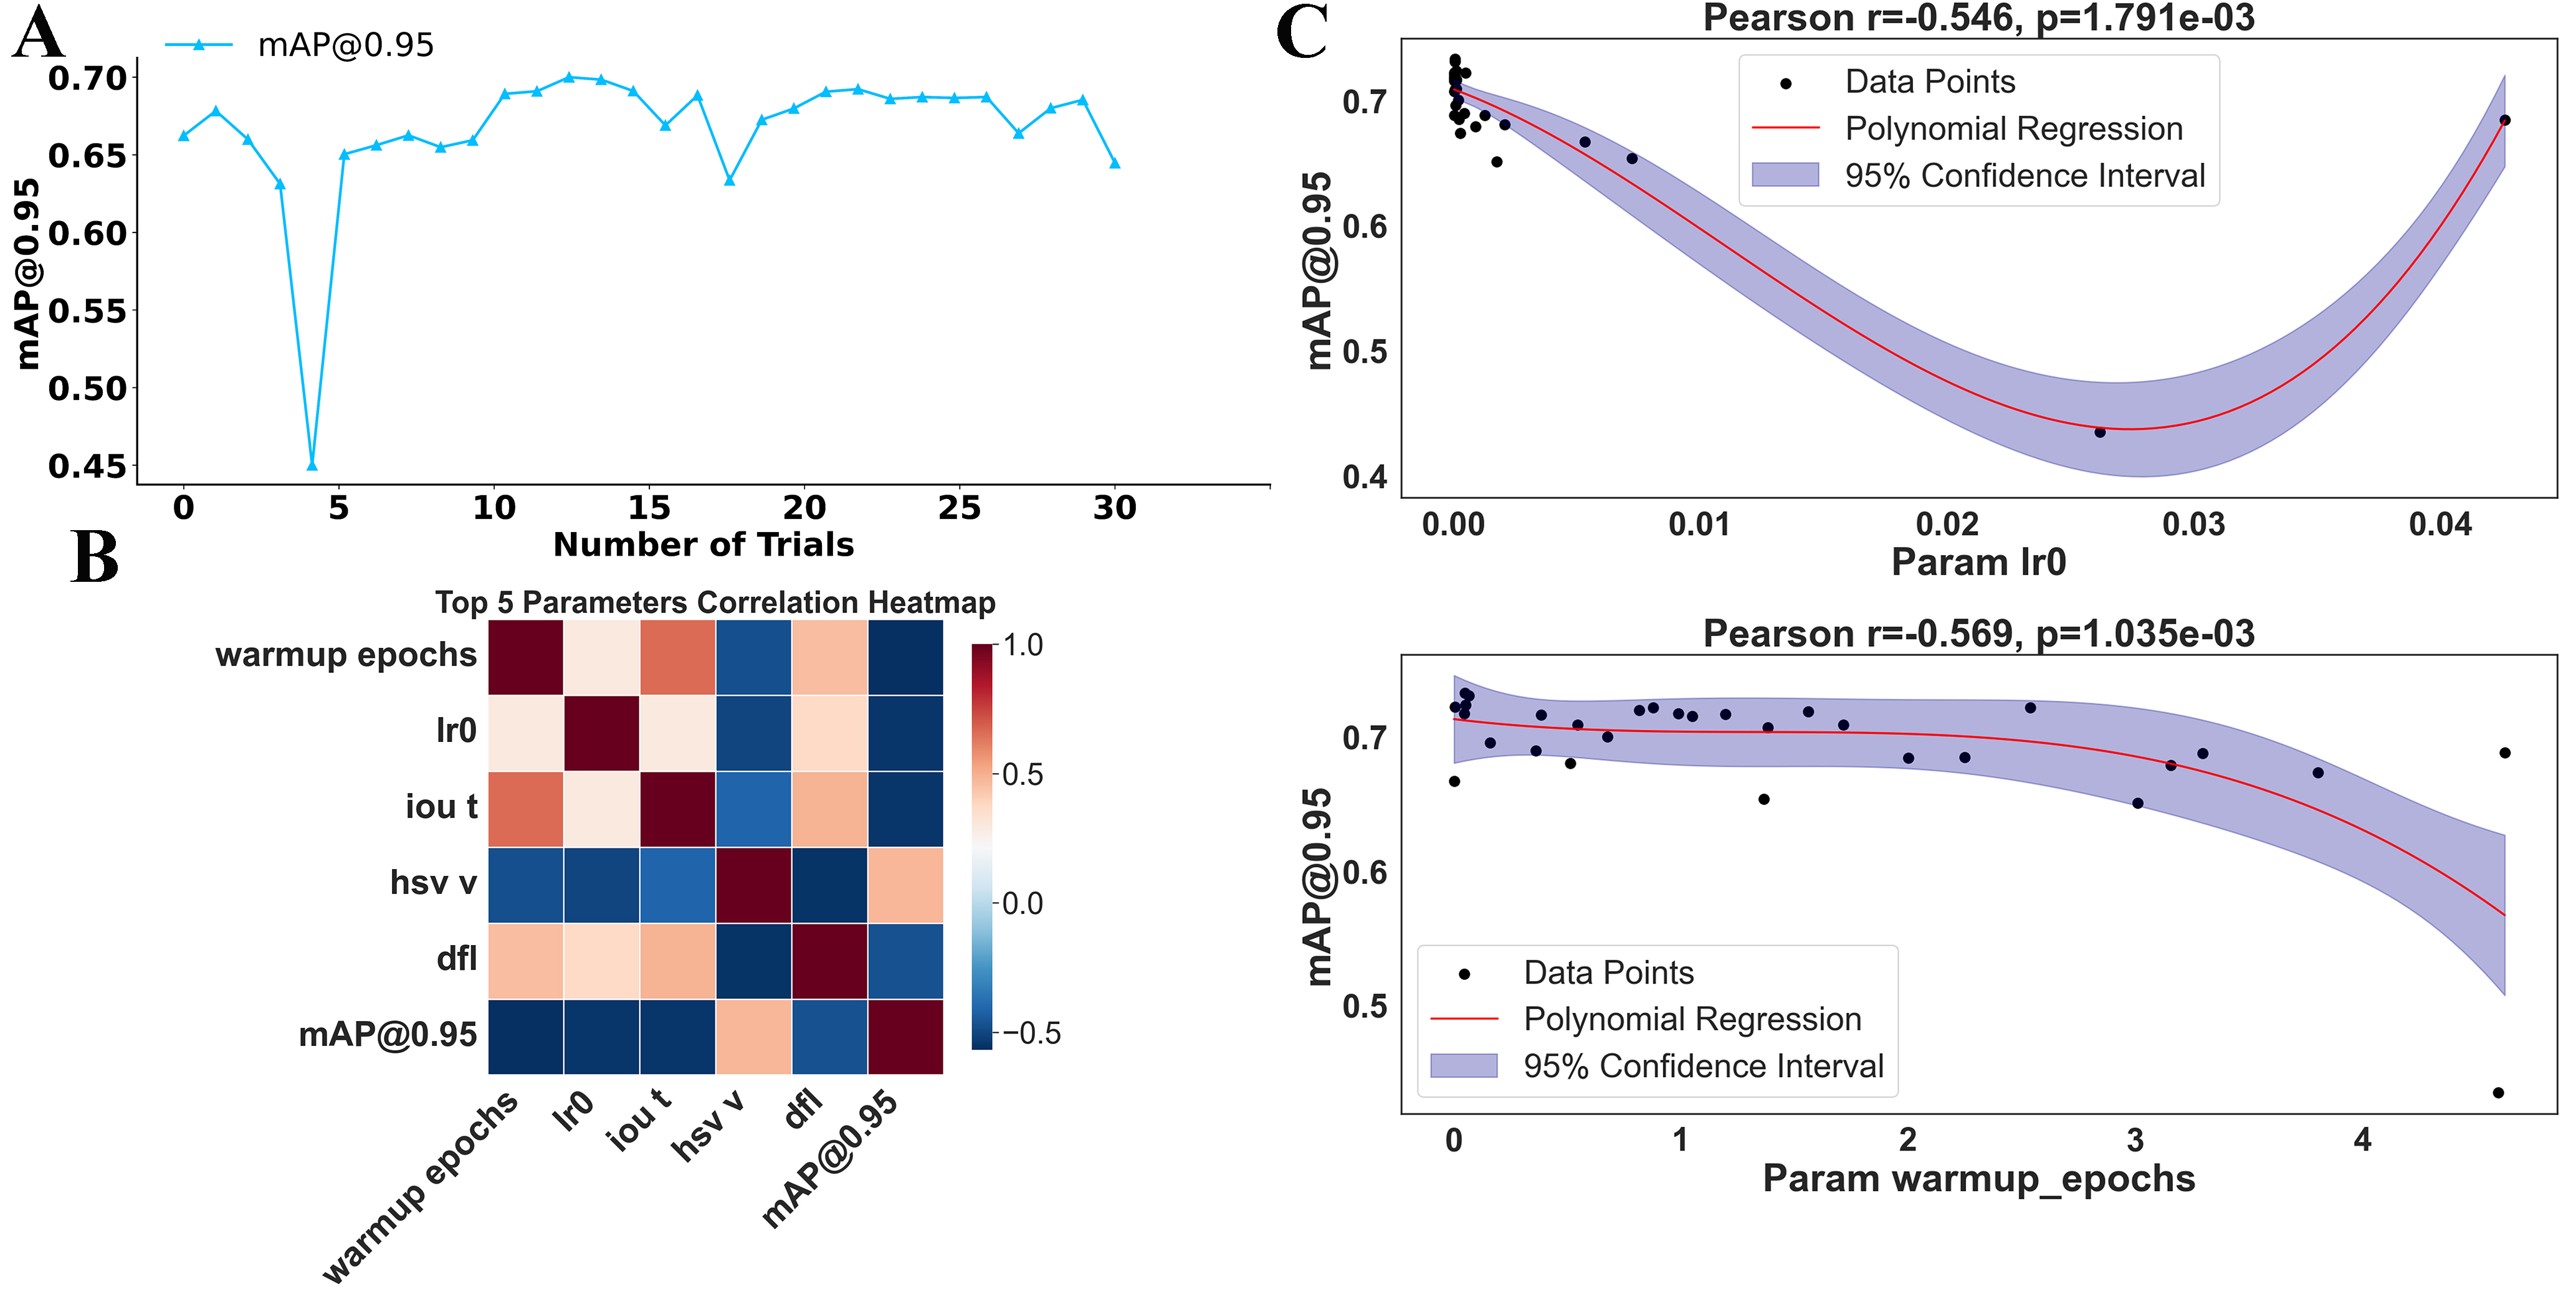
Figure 2. Hyperparameter optimization and its impact on model performance. (A) Model performance ([email protected]) over 30 iterations by Bayesian optimization, where each iteration corresponds to a new hyperparameter configuration; (B) Pearson correlation heatmap showing correlations among the top 5 hyperparameters and [email protected]. Darker colors indicate stronger correlations, providing valuable insights into which hyperparameters should be prioritized for further optimization; (C) Relationships between Ir0 (top panel), warmup epochs (bottom panel), and [email protected], with Pearson correlation coefficients and P-values displayed above the panels. These values indicate which hyperparameters most strongly influence the model performance.

Journal of Materials Informatics
ISSN 2770-372X (Online)
Follow Us

Portico

All published articles are preserved here permanently:

https://www.portico.org/publishers/oae/

Portico

All published articles are preserved here permanently:

https://www.portico.org/publishers/oae/