


fig3
From: Enhanced multi-tuple extraction for materials: integrating pointer networks and augmented attention
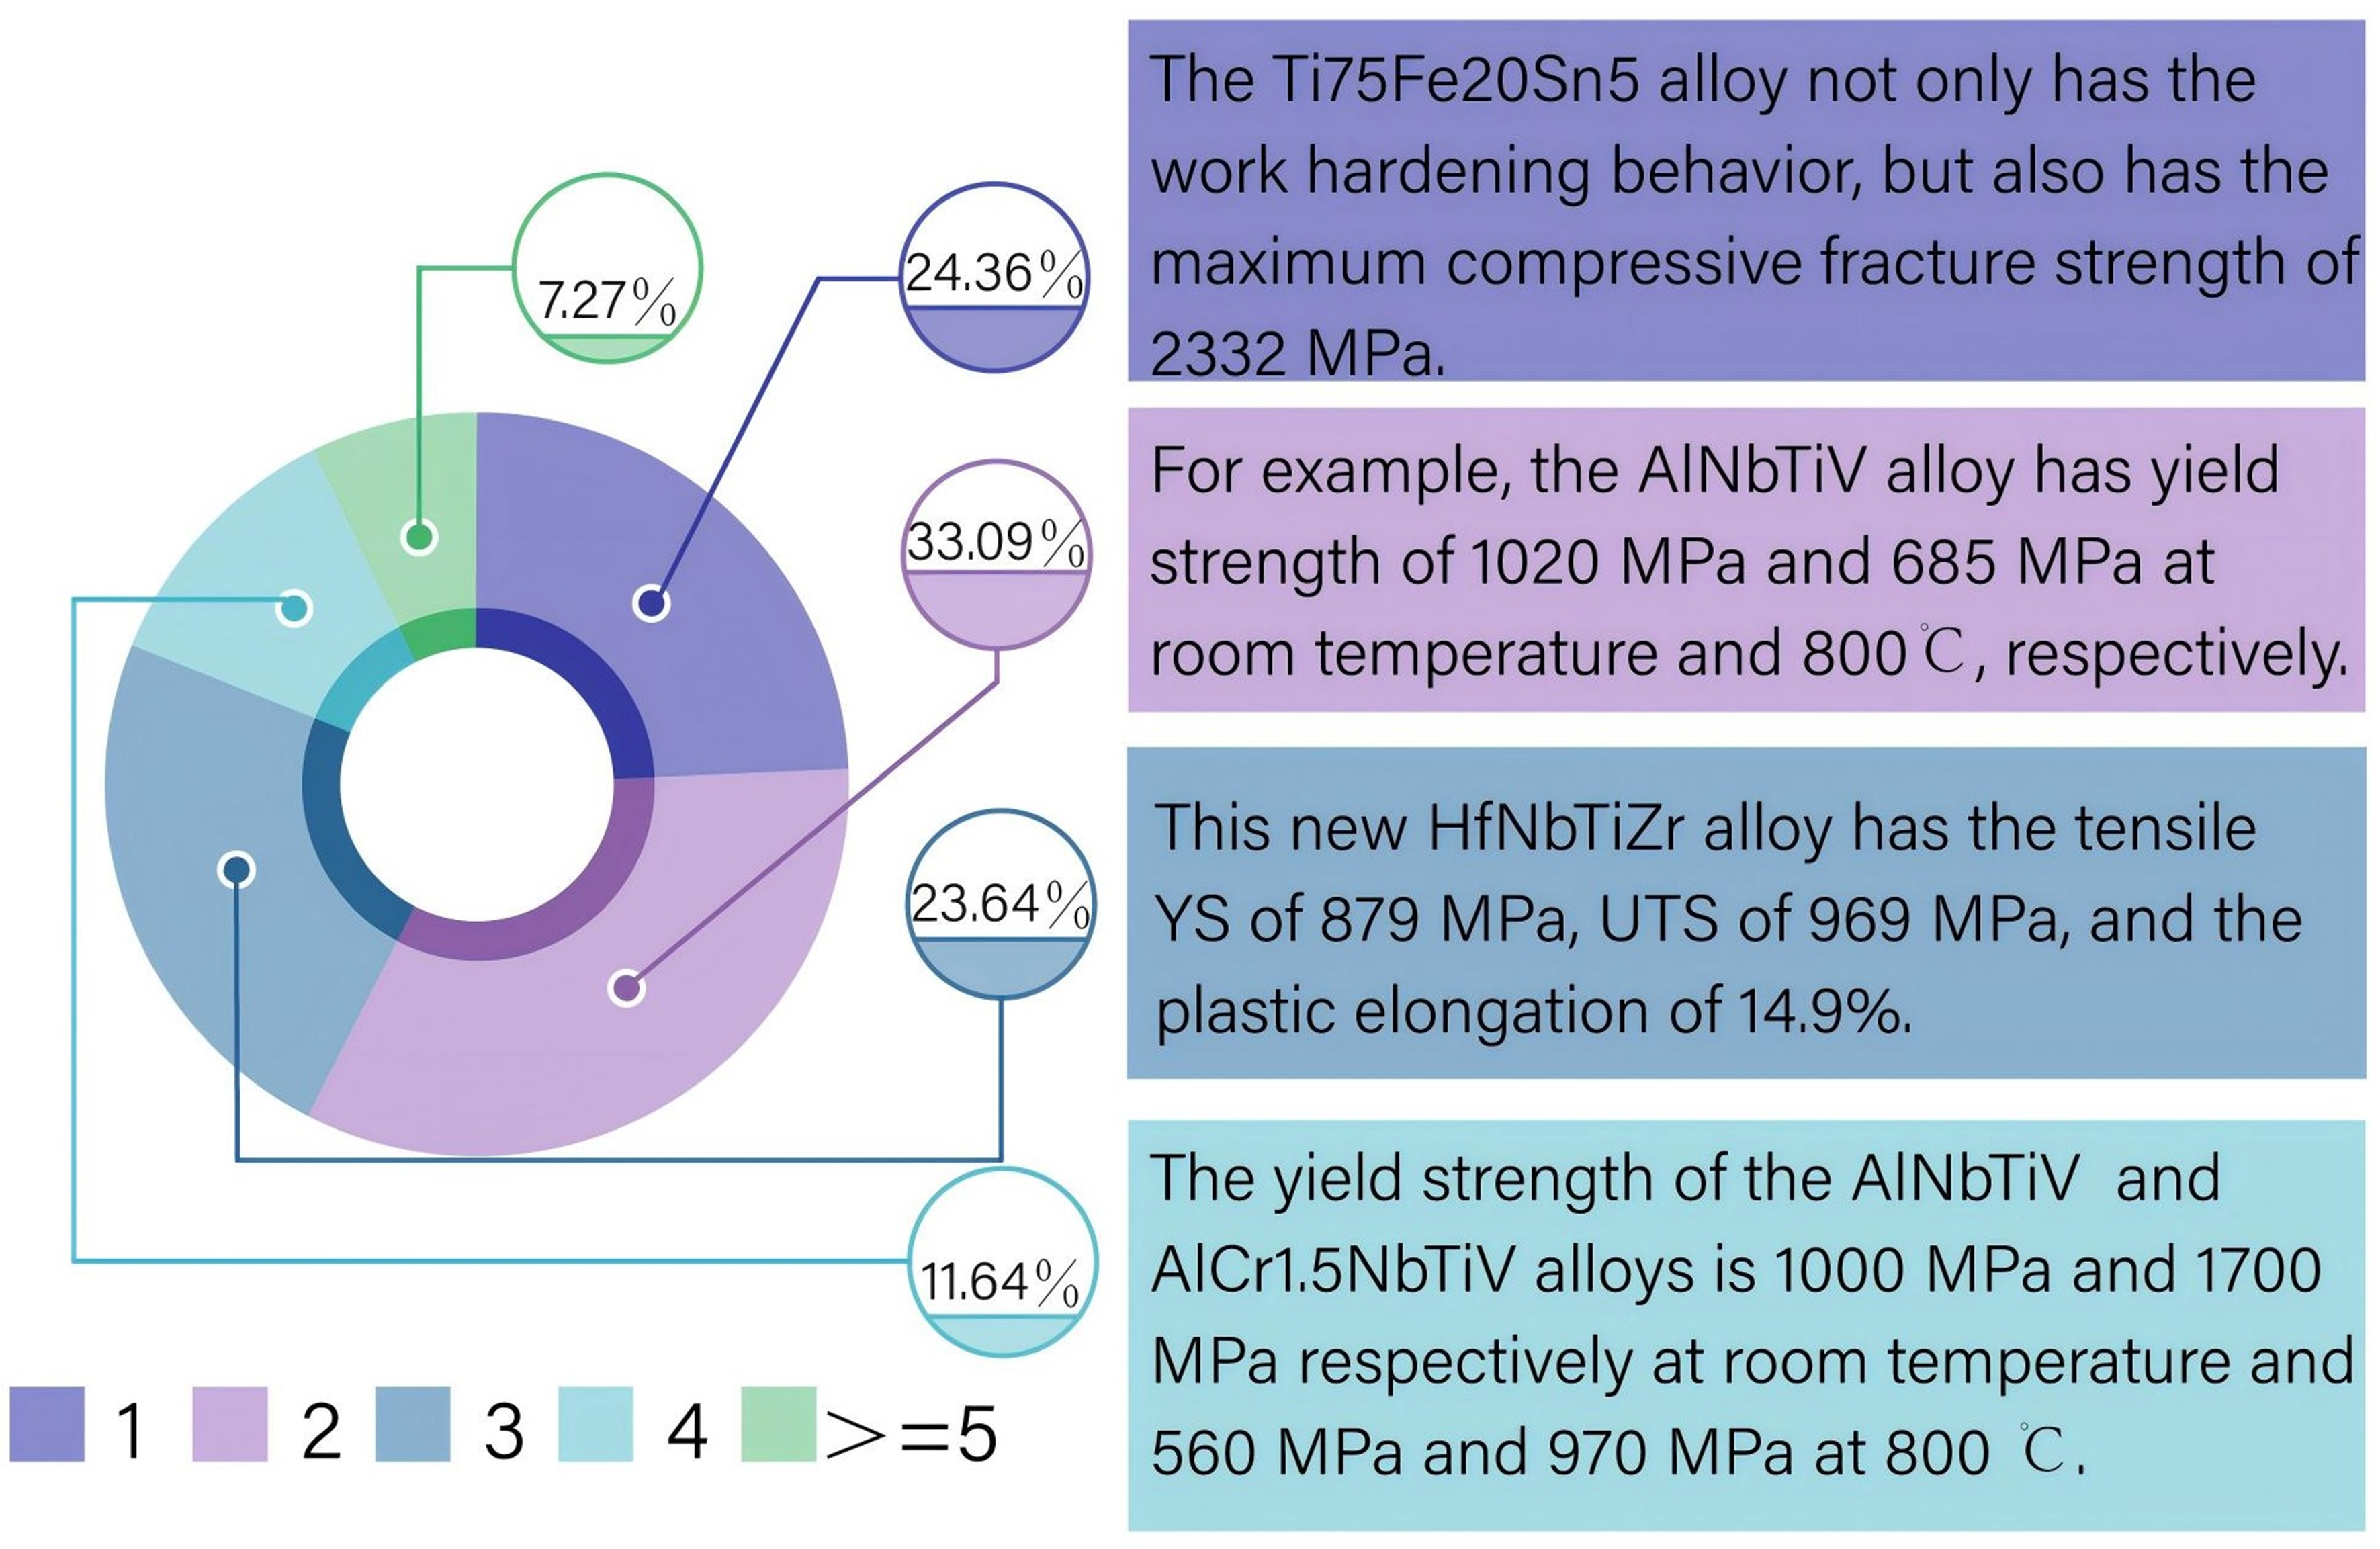
Figure 3. The proportion of sentences containing different numbers of tuples. The numbers below the pie chart indicate the number of tuples represented by each colored segment. On the right side of the pie chart are examples of varying numbers of tuples within one sentence. The proportions, in ascending order, are 24.36%, 33.09%, 23.64%, 11.64%, and 7.27%.


