


fig12
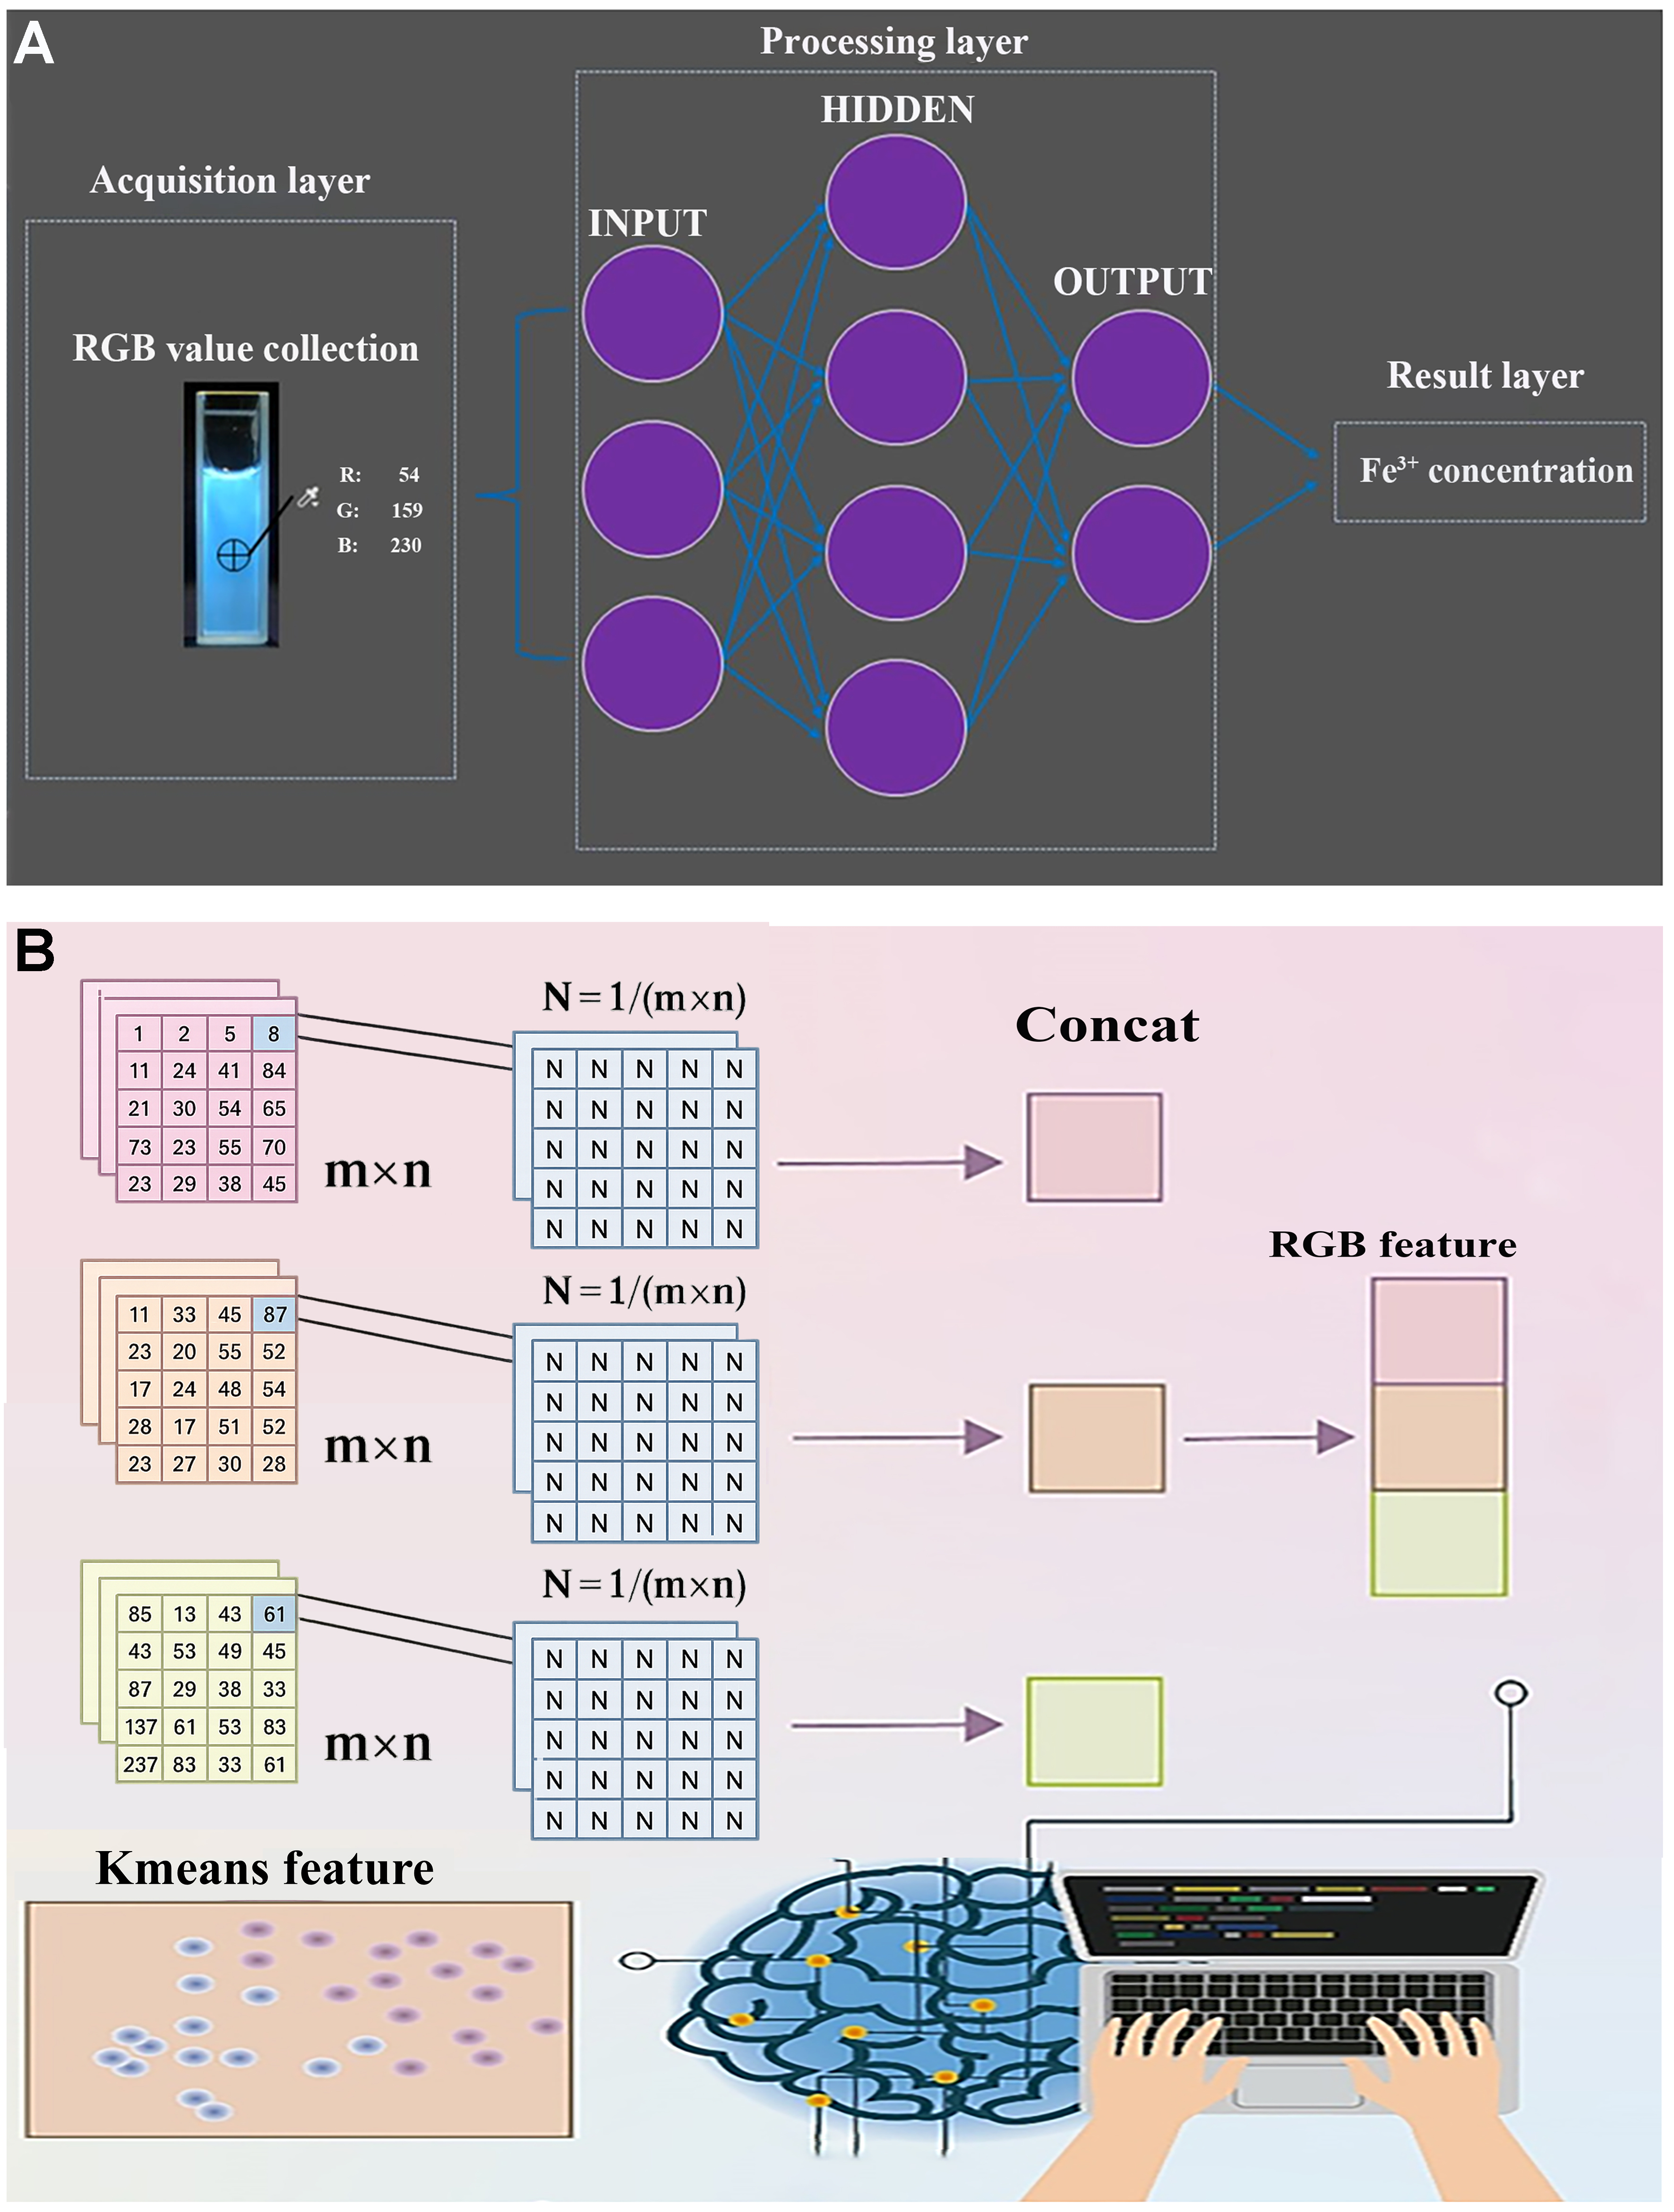
Figure 12. (A) Fe3+ concentration detected through integrated analysis of spectral data and RGB color values using computer vision. This figure is quoted with permission from Zheng et al.[112], Copyright 2021, Springer Nature; (B) Cr (VI) concentration detected via refined processing of RGB features with K-means clustering. This figure is quoted with permission from Zhang et al.[113], Copyright 2024, Elsevier Ltd. RGB: Red, green, blue.


