


fig4
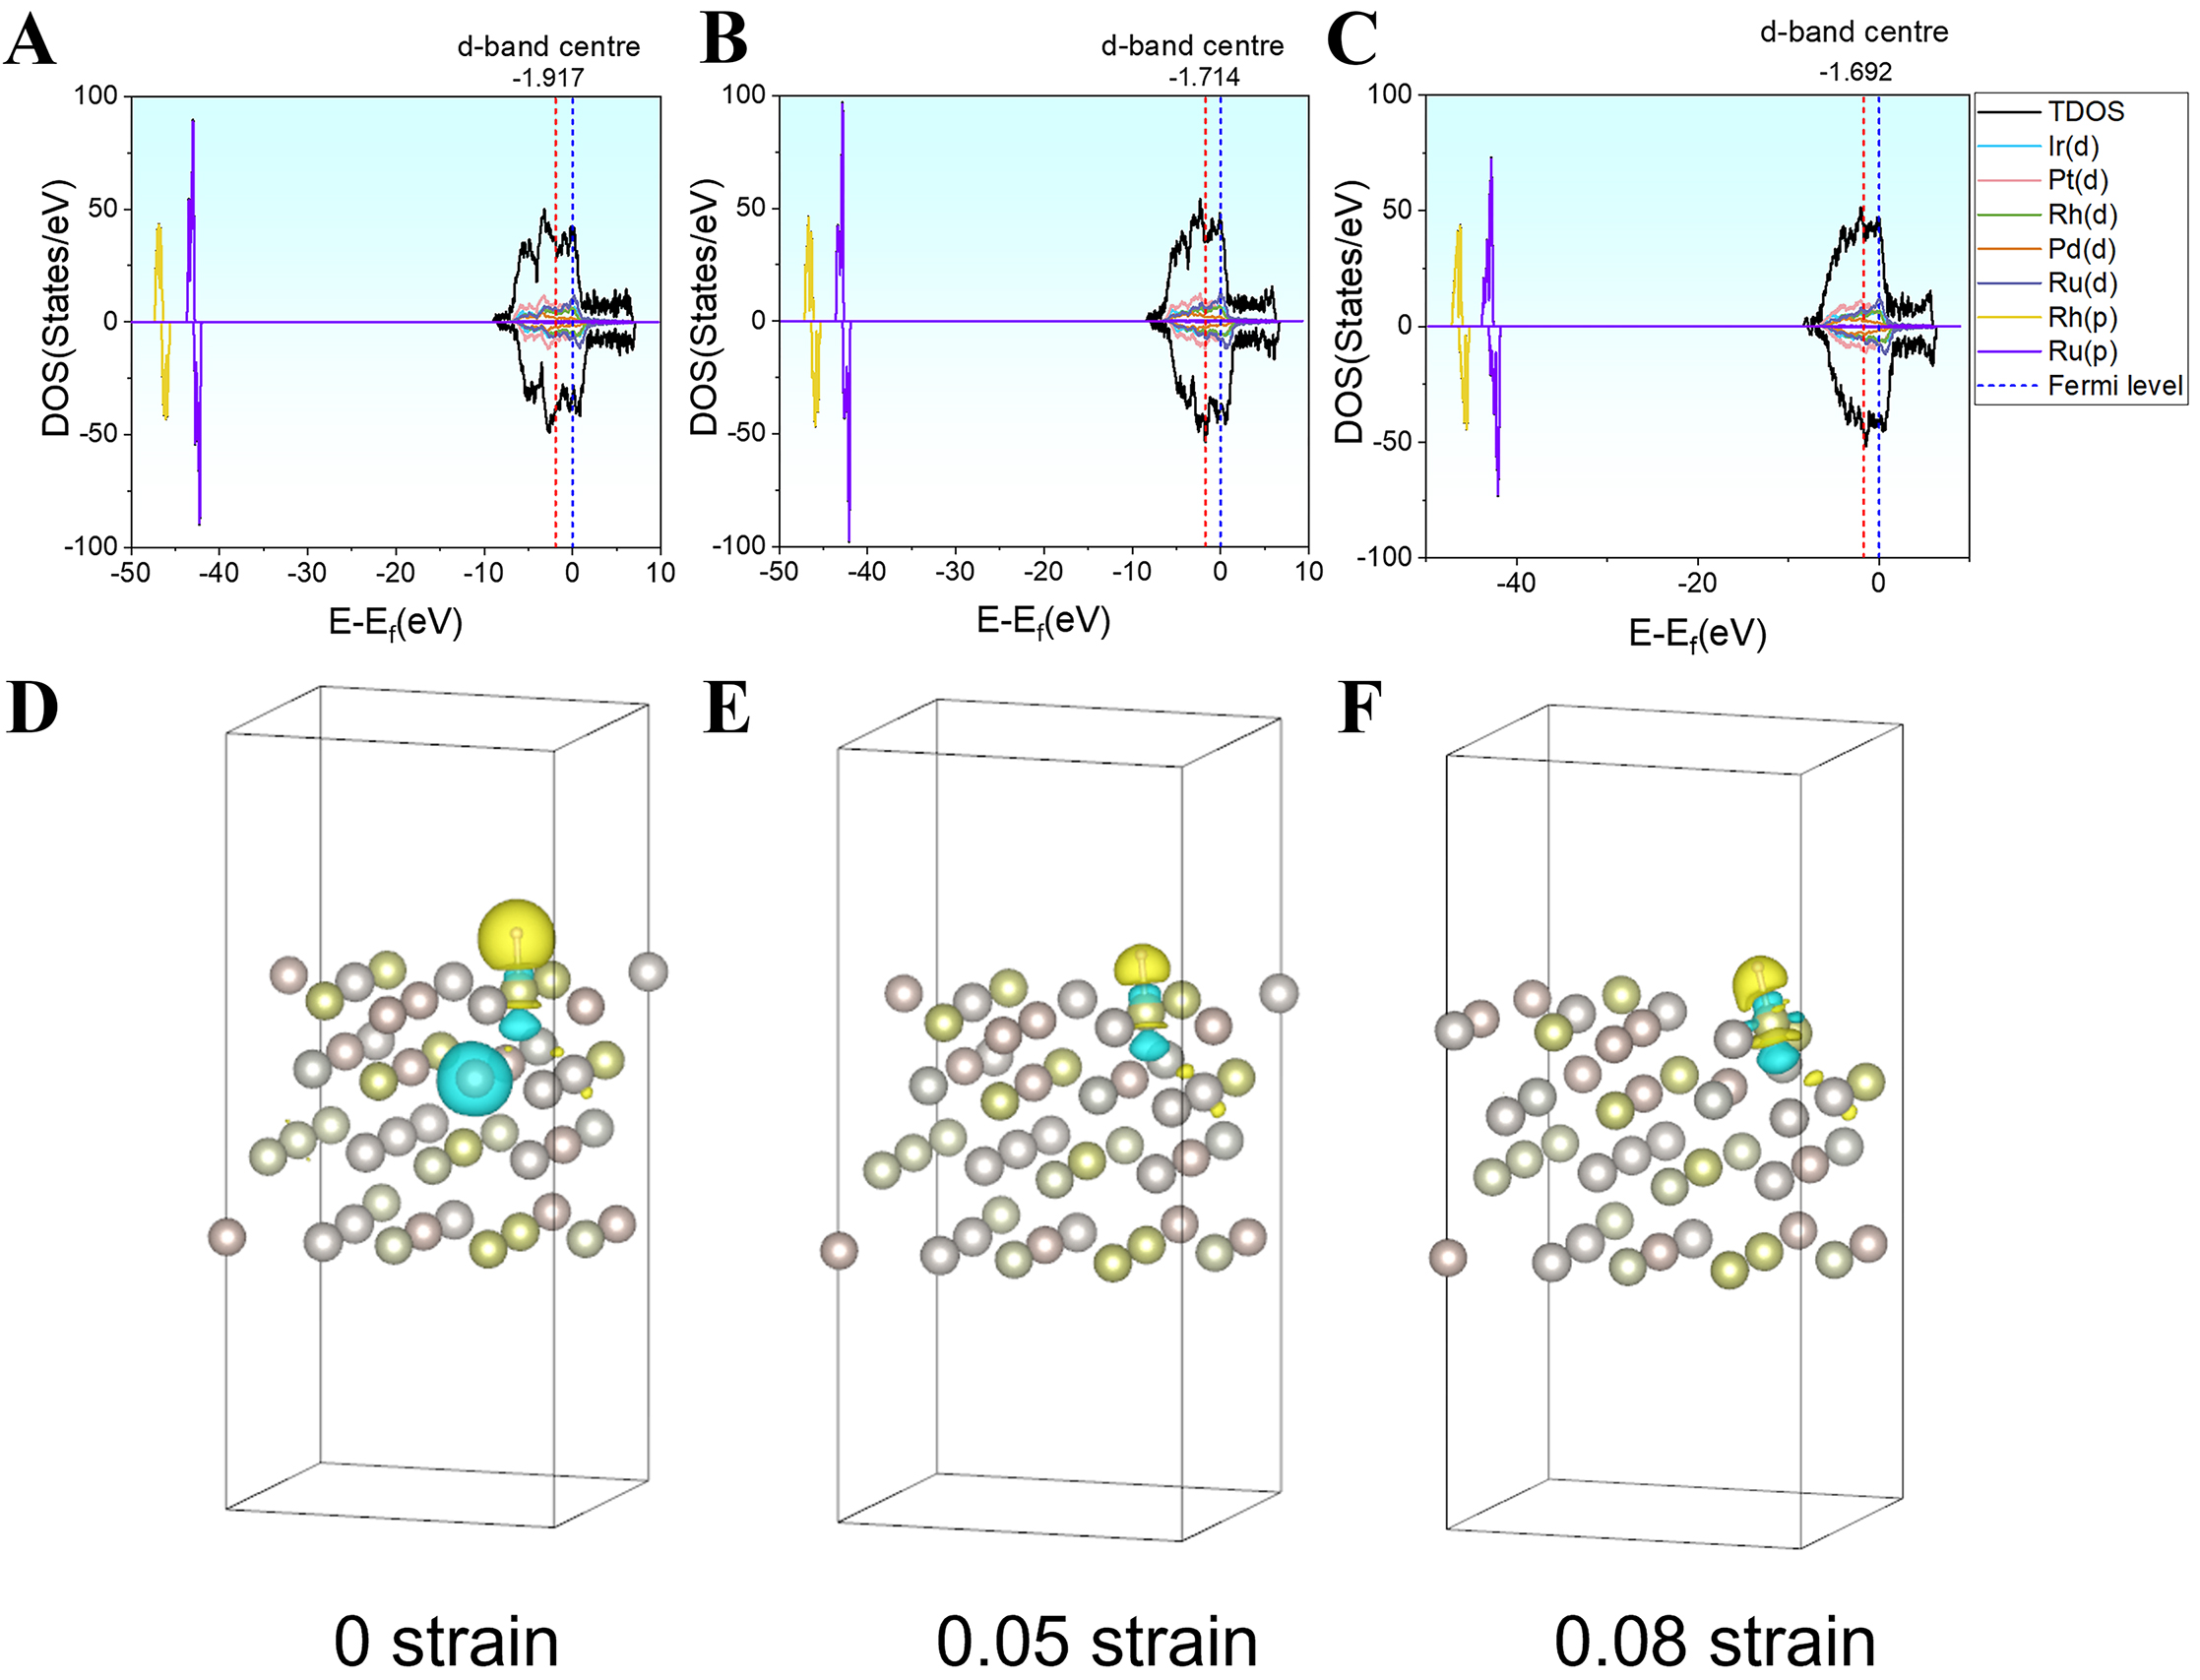
Figure 4. Electronic structure changes under biaxial strain: (A-C) d-band center positions, total density of states (DOS), and projected density of states (PDOS) under biaxial strain; (D-F) charge density difference under biaxial strain (isovalue = 0.006 e Å-3), where yellow regions indicate electron accumulation and green regions indicate electron depletion. TDOS: total density of states.


