


fig4
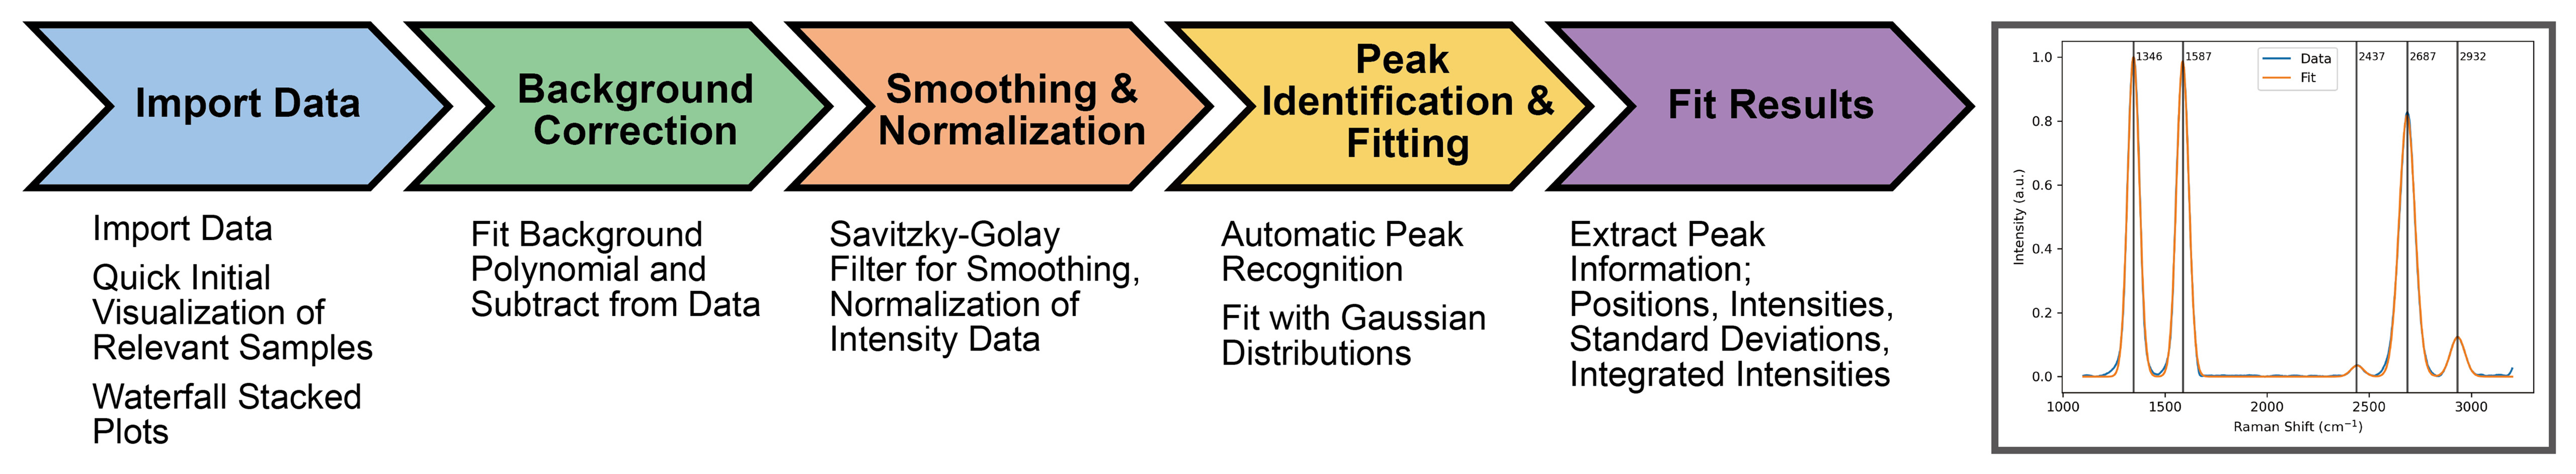
Figure 4. (Project 4) Data visualization and rapid analysis pipeline, and an example visual output of fitted data with peak identification and marked up with Raman shift positions.
Figure 4. (Project 4) Data visualization and rapid analysis pipeline, and an example visual output of fitted data with peak identification and marked up with Raman shift positions.


All published articles are preserved here permanently:
https://www.portico.org/publishers/oae/

