


fig8
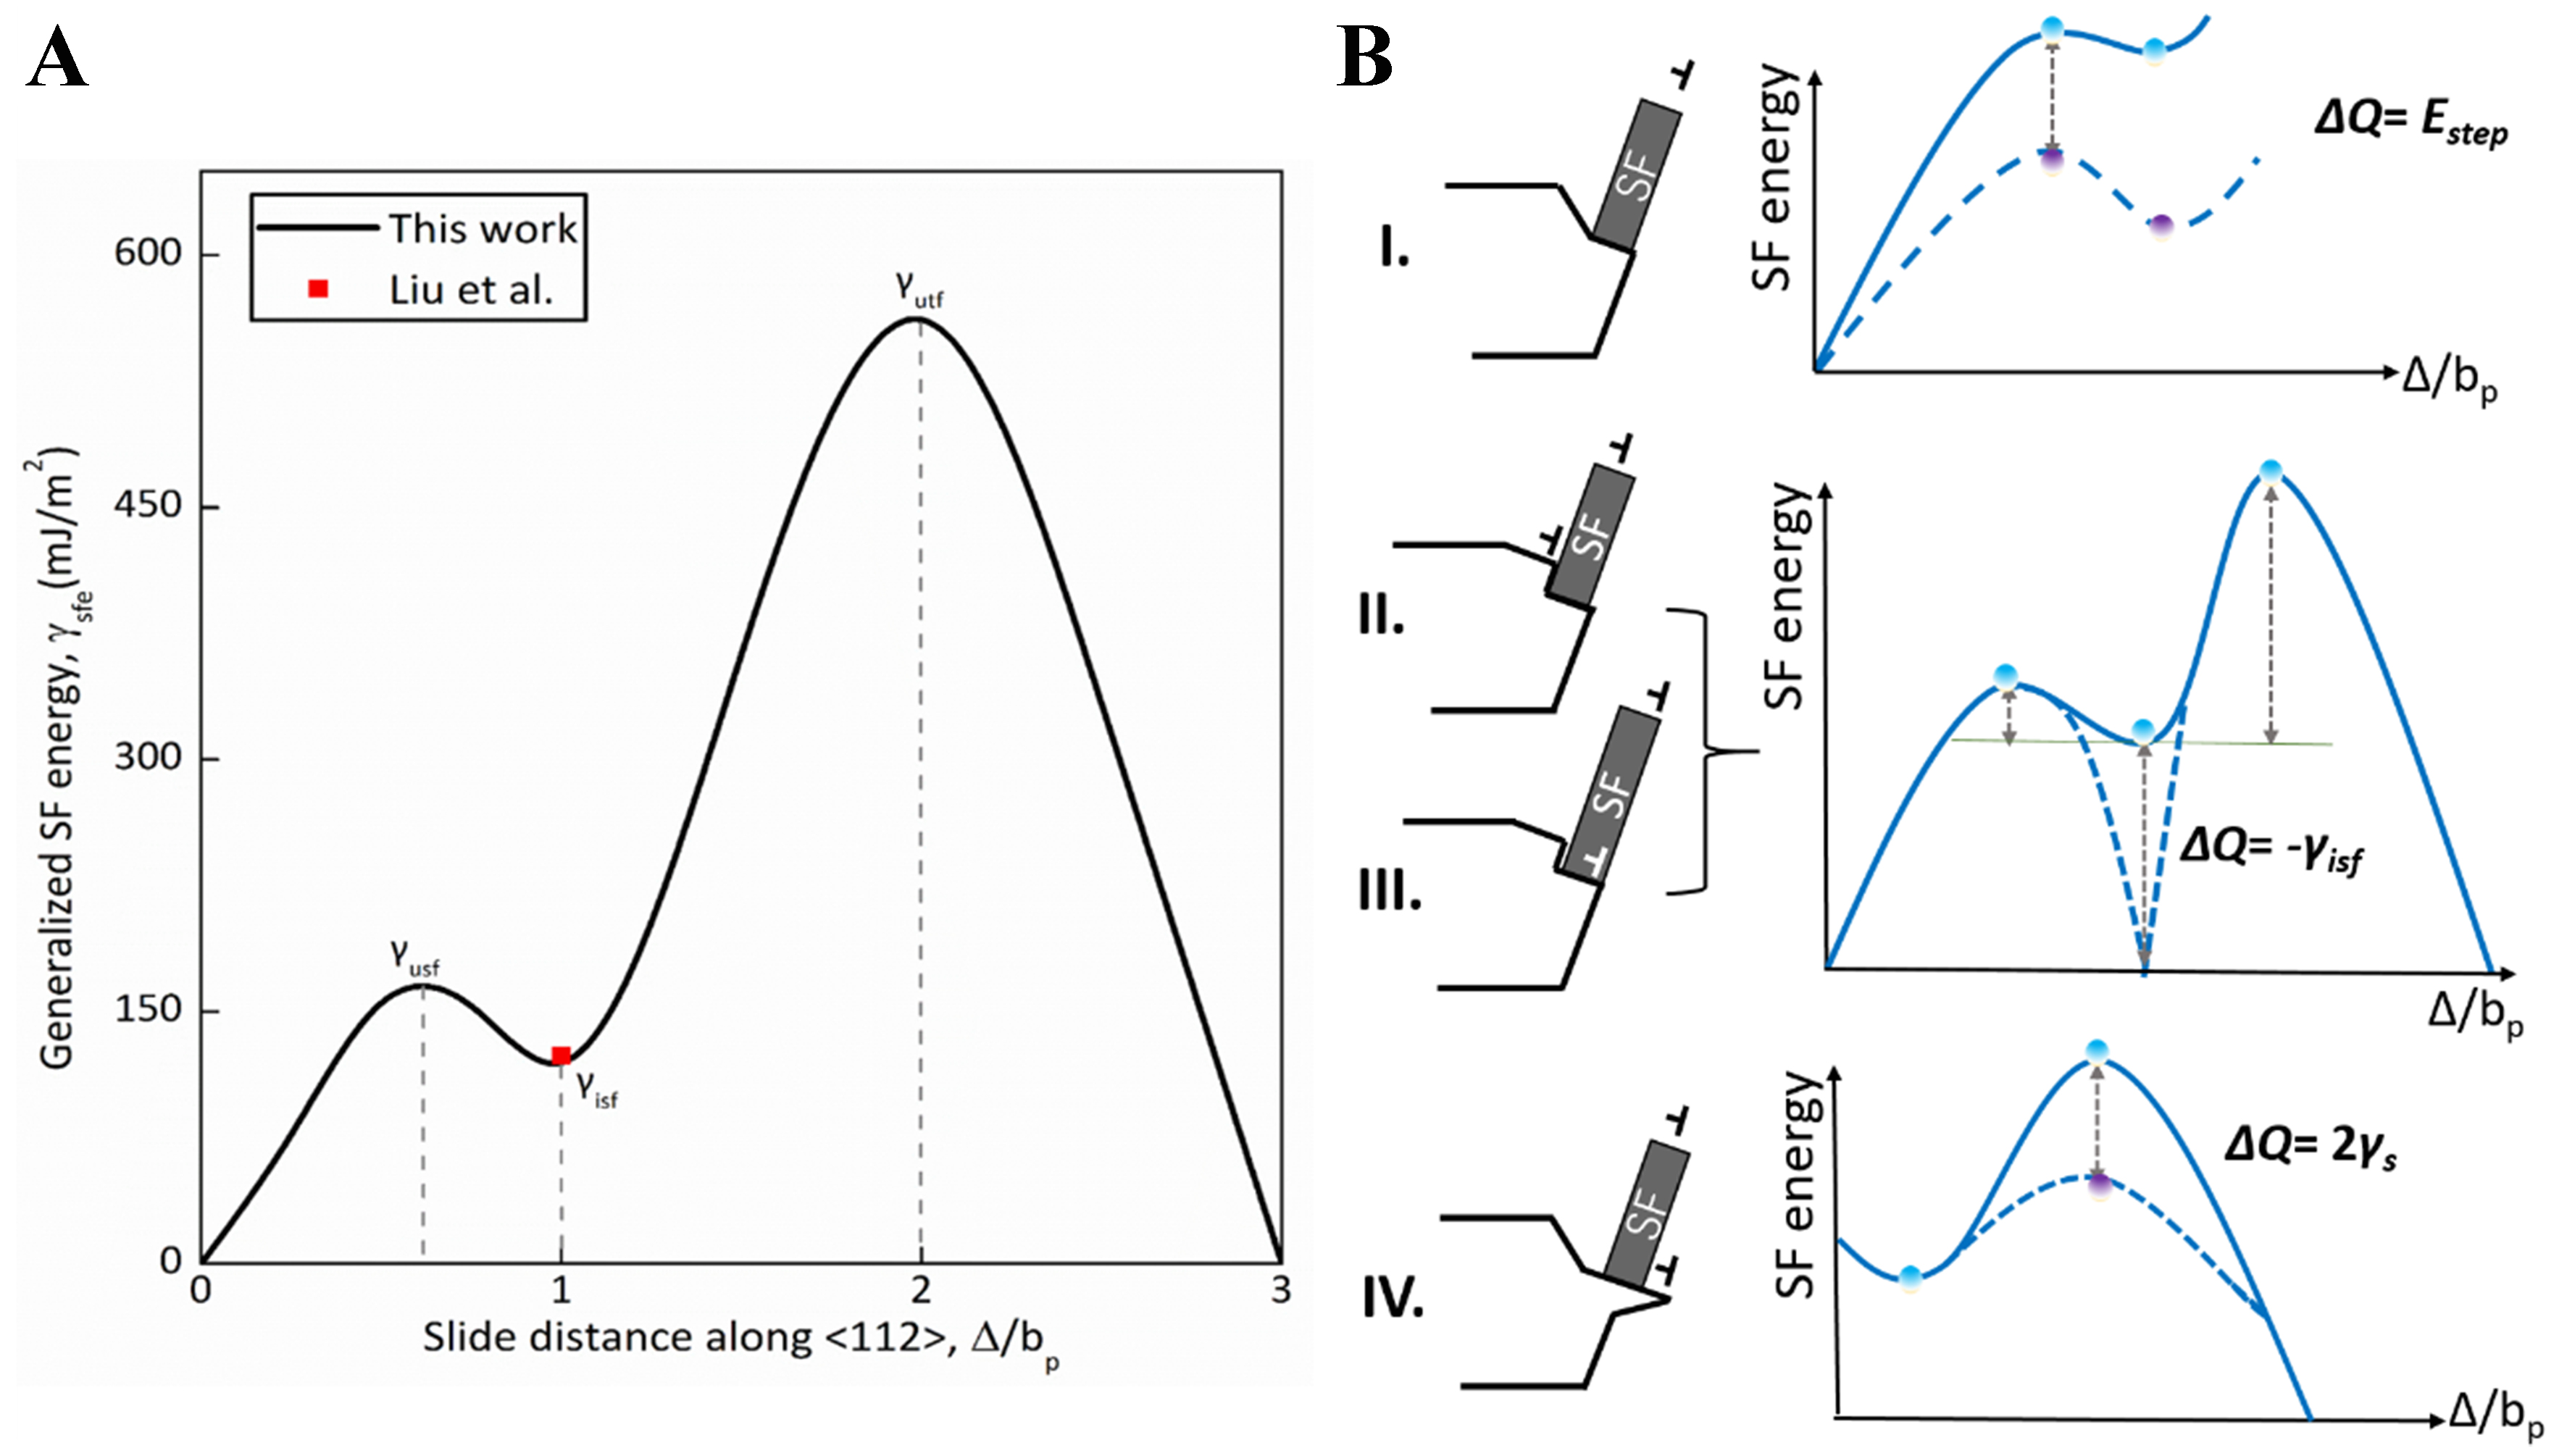
Figure 8. Schematic illustration for correlations between the SF energy γ and the potential barrier GIe of dislocation nucleation at the crack tips in FCC Al. (A) Generalized SF energy curve for FCC Al along the <112> direction on {111} slip plane, where the first peak point, the saddle point, and the second peak point represent the unstable SF energy γusf, intrinsic SF energy γisf, and unstable twinning fault energy γutf, respectively. Note that the values of SF energy calculated in this work are denoted by black solid line, while the red point represents the value reported by Liu et al.[50]; (B) Correlation between dislocation nucleation barrier and position of dislocation nucleation at the crack tips, including (I) dislocation nucleates at the crack tips, where the nucleation barrier GIe increases due to the formation of surface steps, (II and III) dislocation nucleated at the SF region and/or the boundary of the SF region, where the nucleation barrier GIe decreases by γisf, and (IV) dislocation nucleated on a new surface generated after crack instability, where the nucleation barrier GIe increases by 2γs. SF: Stacking fault; FCC: faced-centered cubic.


