fig1

Atomistic underpinnings for dislocation emission behaviors at the crack tips in FCC metals in light of thermo-kinetic synergy

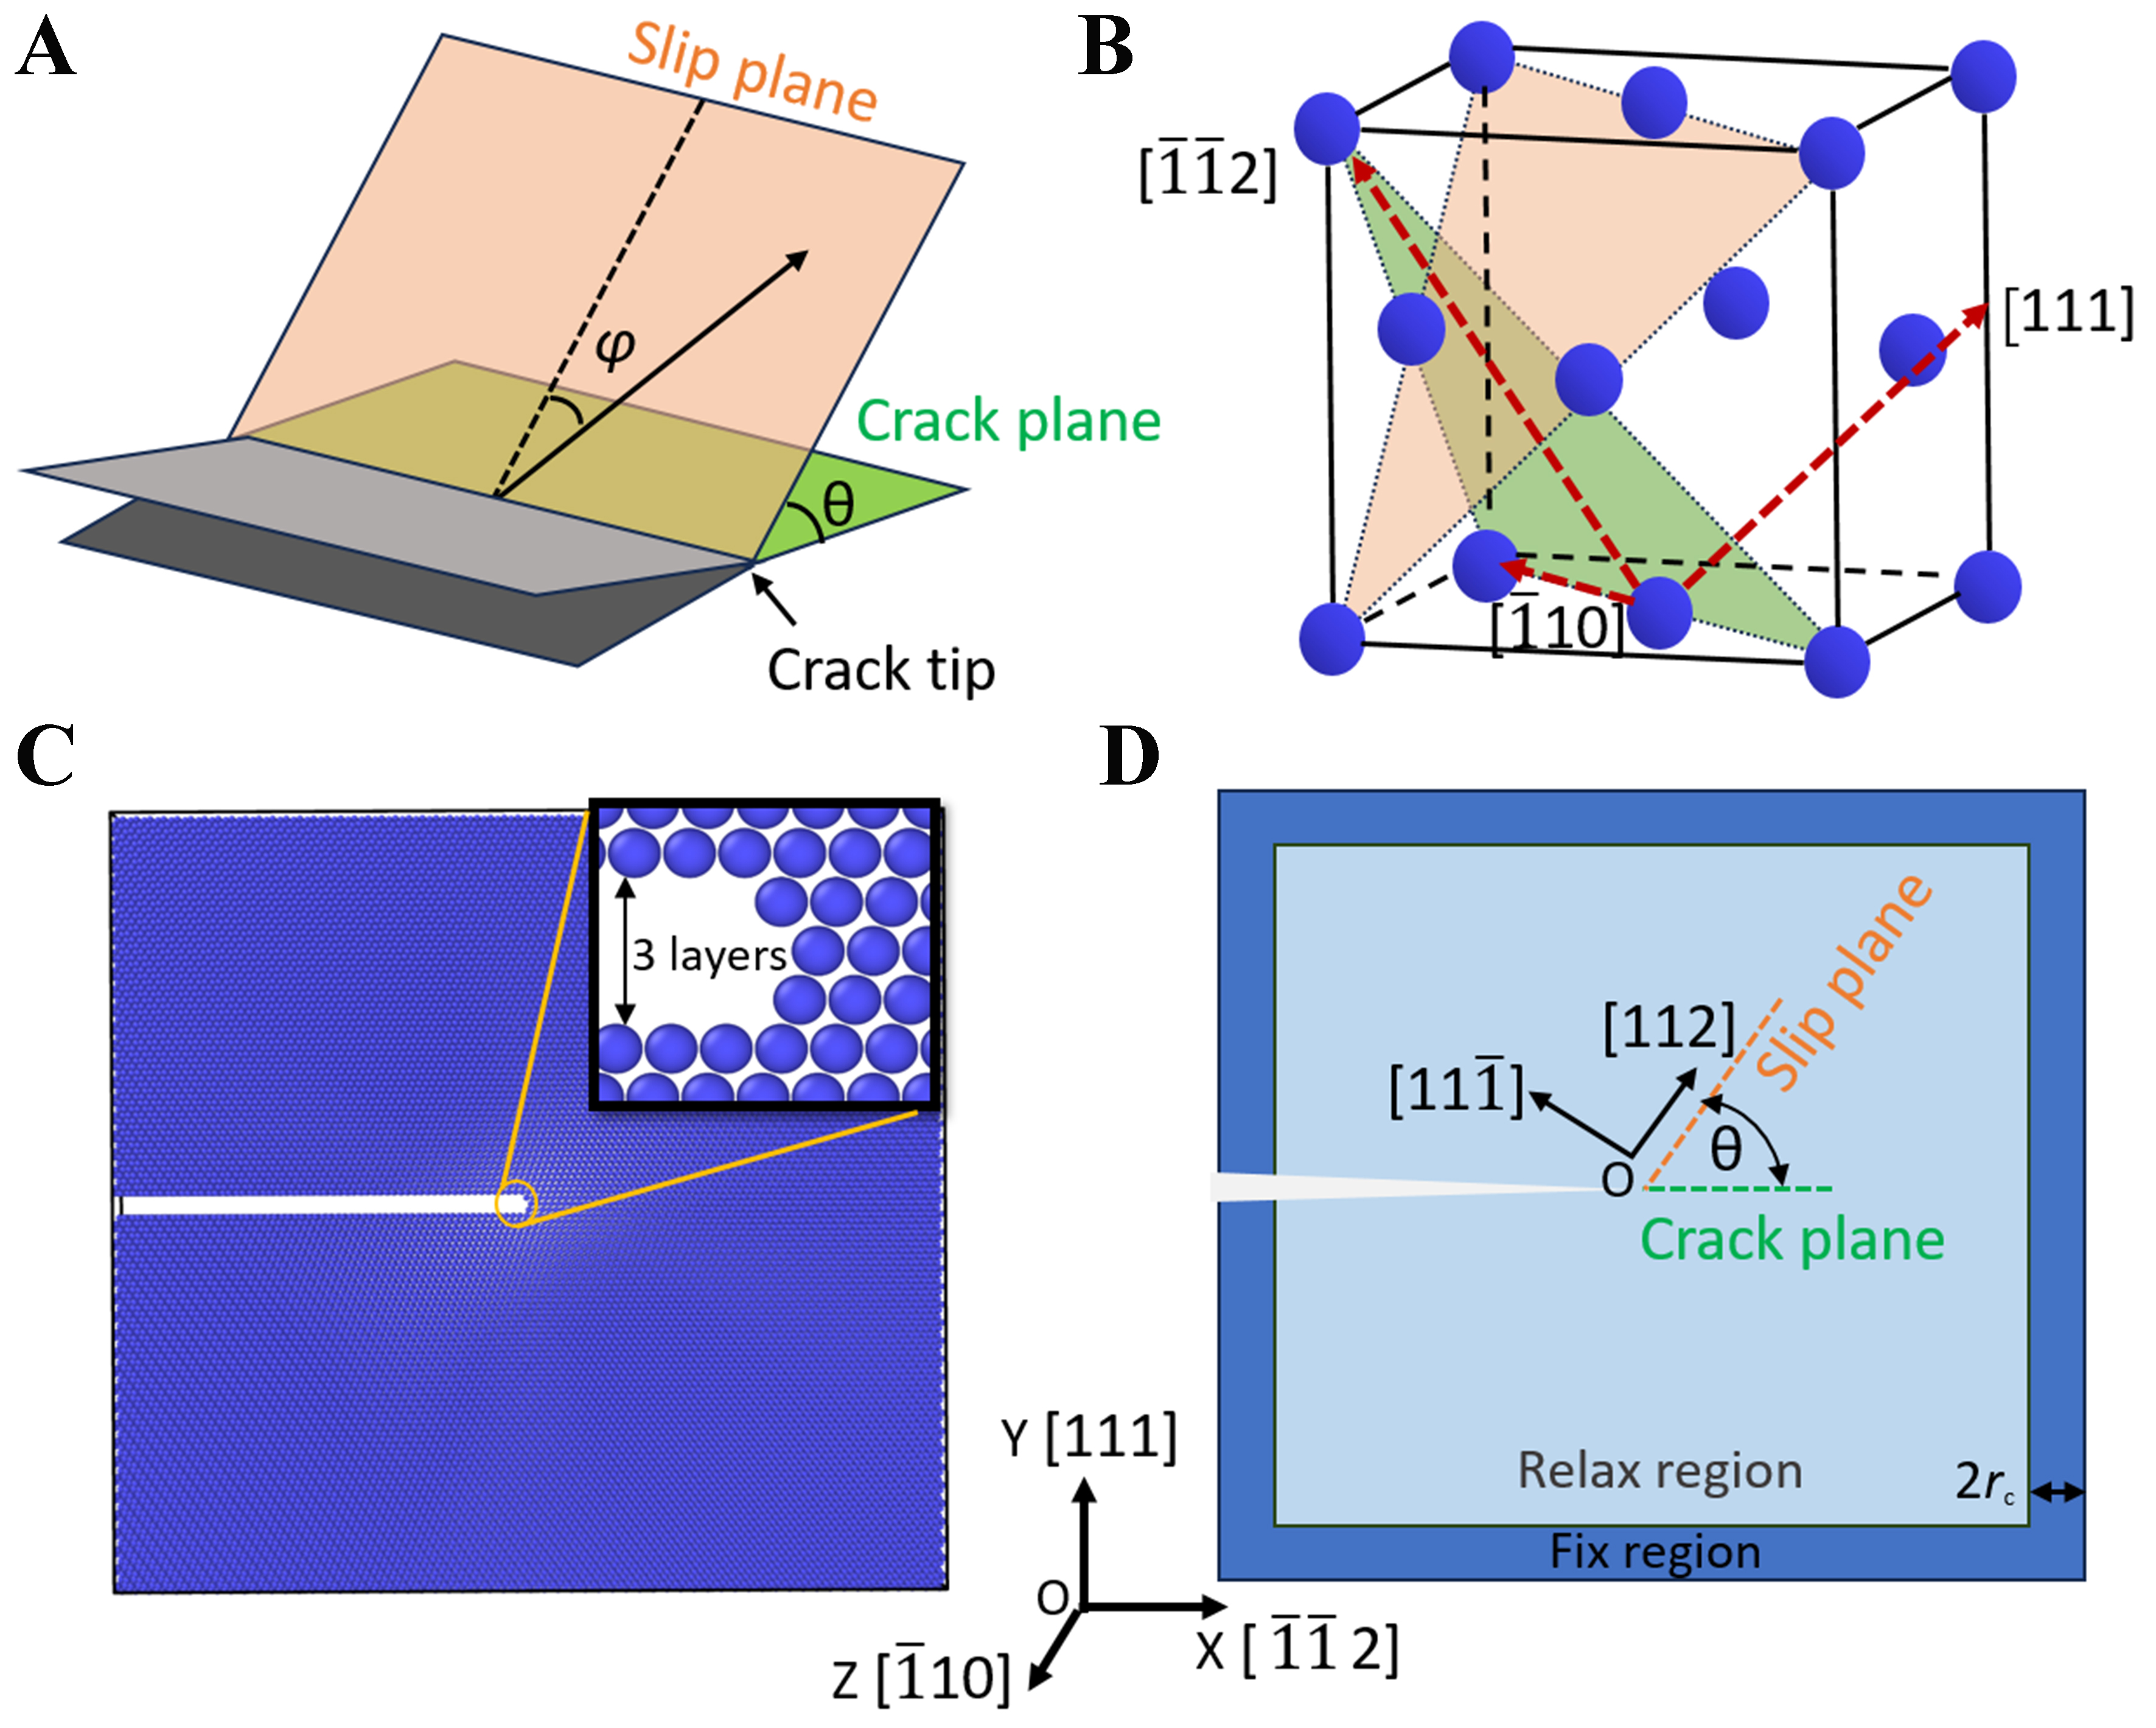
Figure 1. Schematic diagram for the structural model of FCC Al under the K-field loading conditions for atomistic simulations. (A) The direction of dislocation emission at the crack tips, where θ is the angle between the crack plane and slip plane, and φ is the angle between the dislocation emission direction and crack propagation direction; (B) The slip systems involved in dislocation emission at the crack tips, where the triangular region represents the {111} slip plane, and the direction of dislocation emission from the crack tips is along the <112> direction; (C) Atomic configuration of FCC Al with a marginal crack, where the X, Y, and Z axes of the simulation box are along the [$$ \bar{1}\bar{1} $$2], [111], and [$$ \bar{1} $$10] directions of FCC Al, respectively. A preset crack is introduced by removing three atomic layers on the XZ plane; (D) The K-field loading region, where the dark blue region represents the fixed region, while the remaining light blue region is the free zone to be relaxed. Note that the light green and orange planes denote the crack plane and dislocation slip plane, respectively. FCC: Faced-centered cubic.

Journal of Materials Informatics
ISSN 2770-372X (Online)
Follow Us

Portico

All published articles are preserved here permanently:

https://www.portico.org/publishers/oae/

Portico

All published articles are preserved here permanently:

https://www.portico.org/publishers/oae/