


fig12
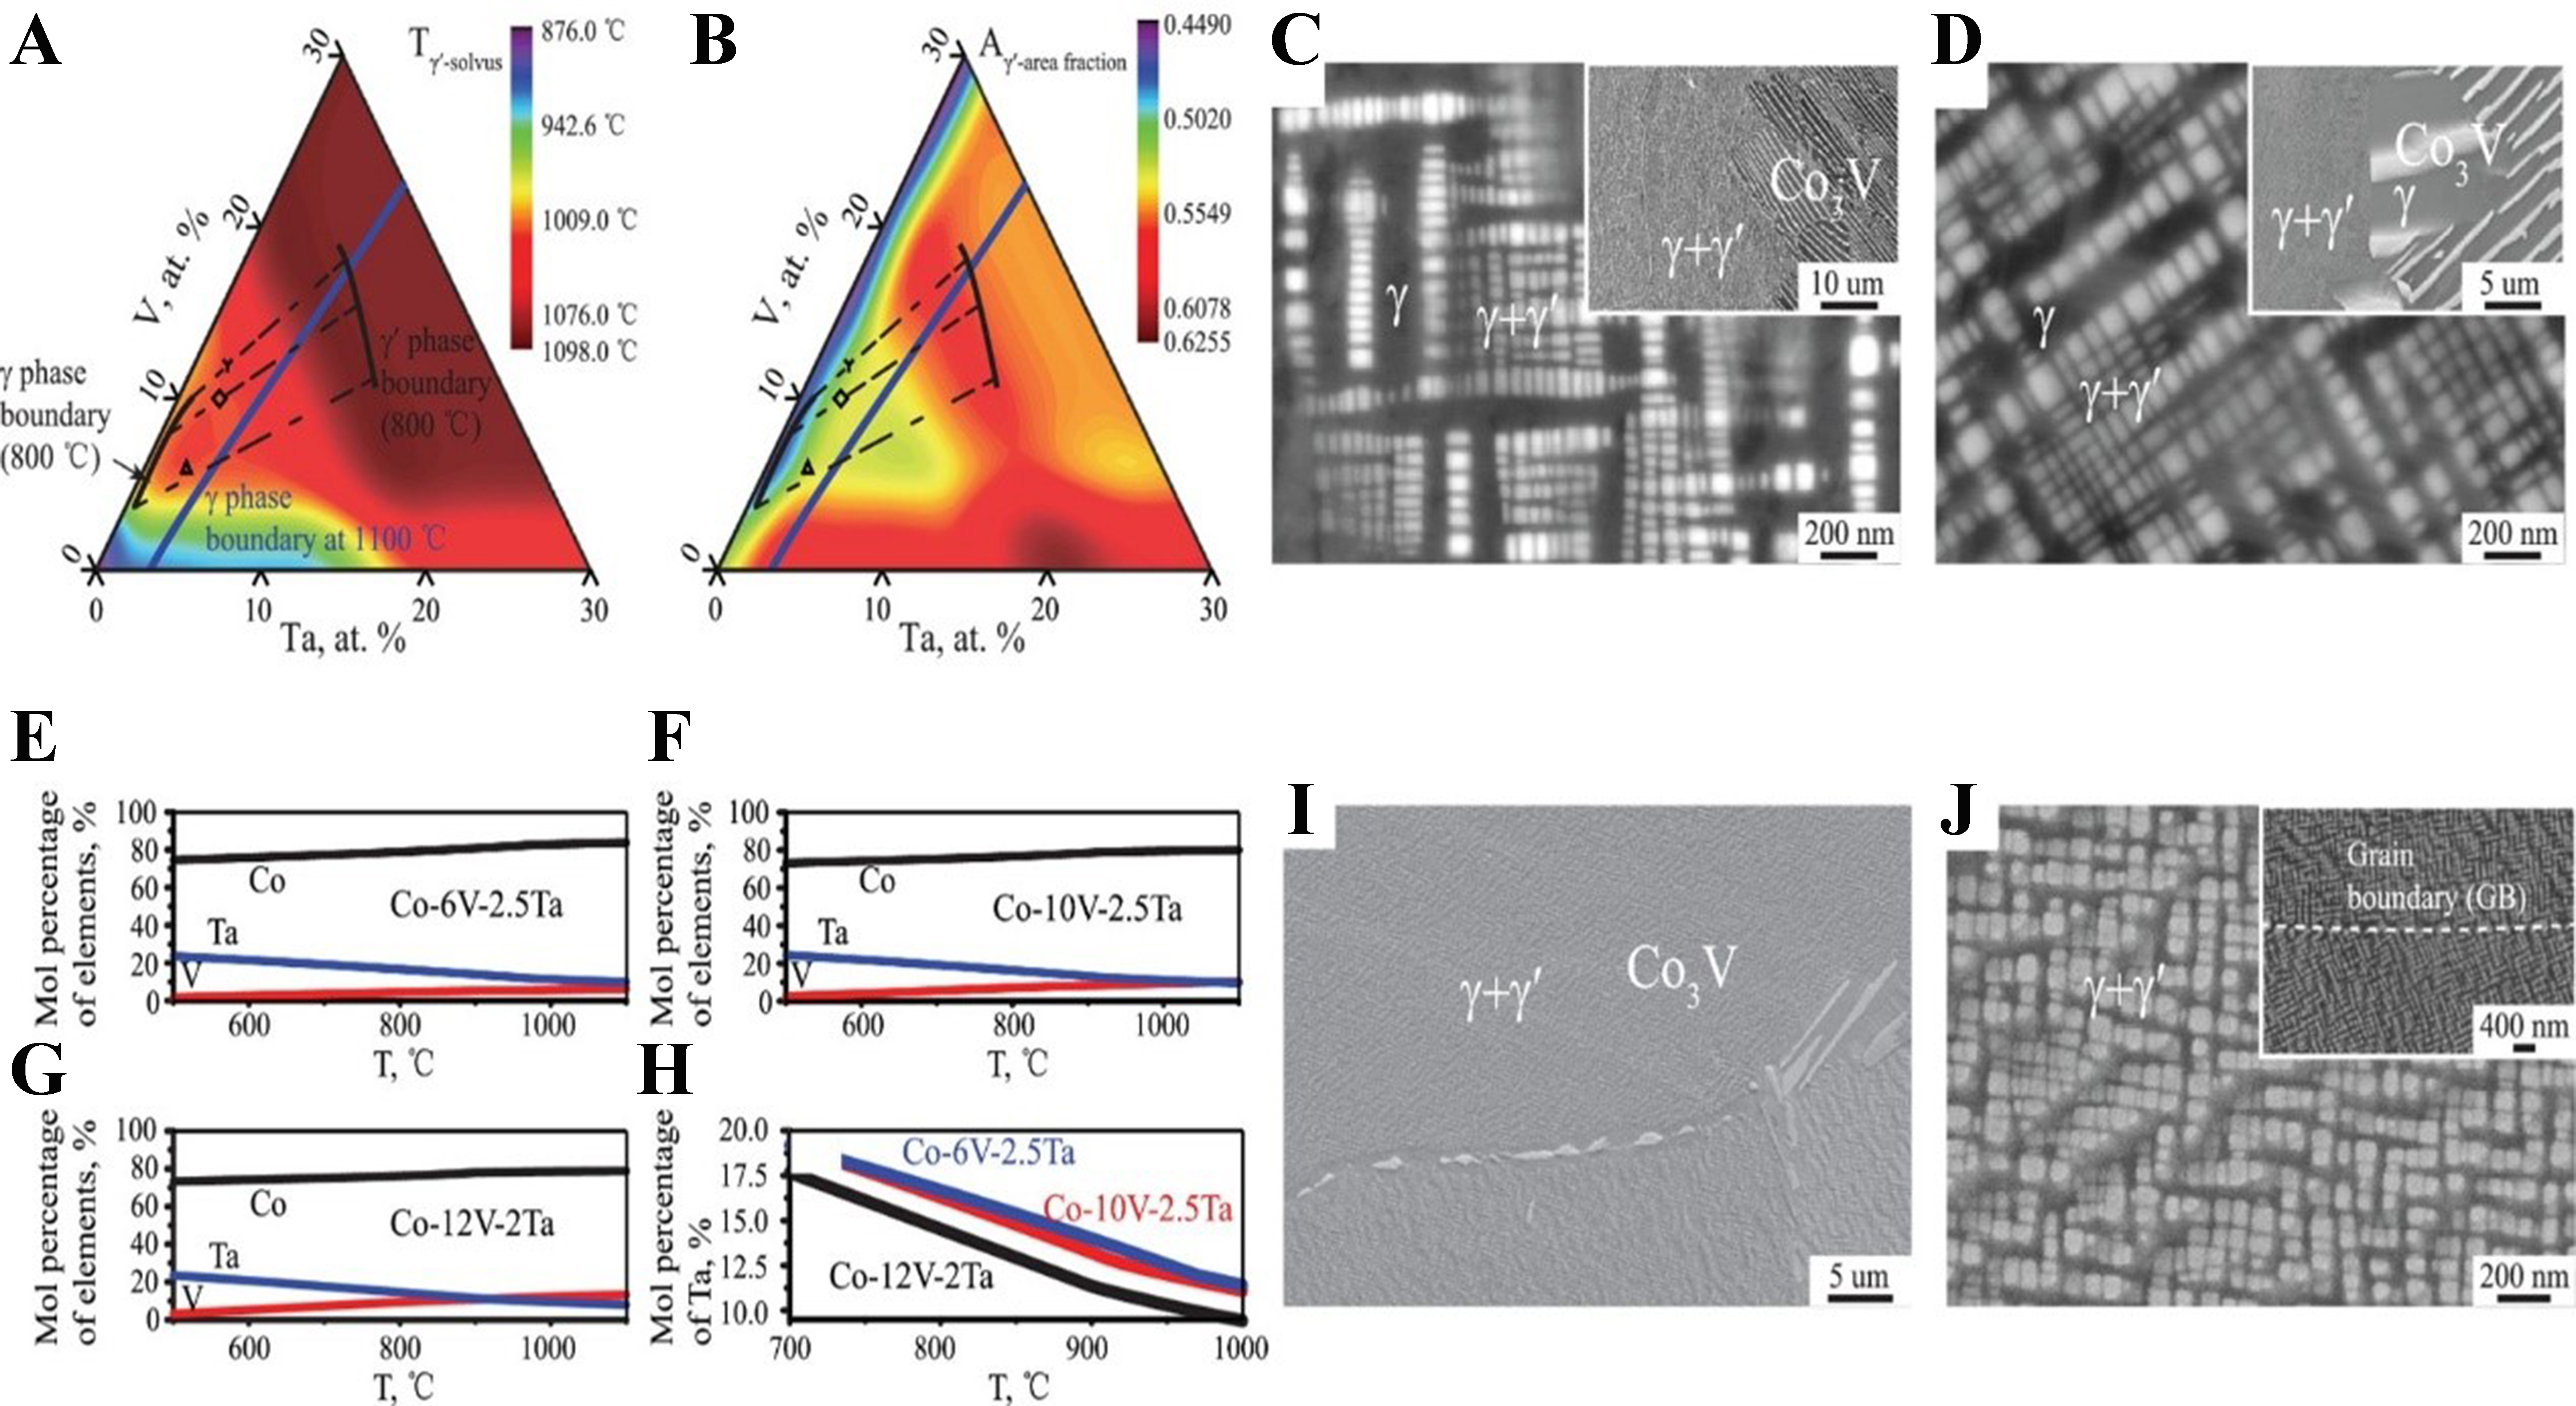
Figure 12. Alloy design workflow. Composition-dependent maps of (A) γ′ solvus temperature and (B) γ′ area fraction for Co-V-Ta ternary alloys after 800 °C/600 h annealing predicted by ML; SEM images of (C) Co-6V-2.5Ta and (D) Co-10V-2.5Ta alloys after


