


fig6
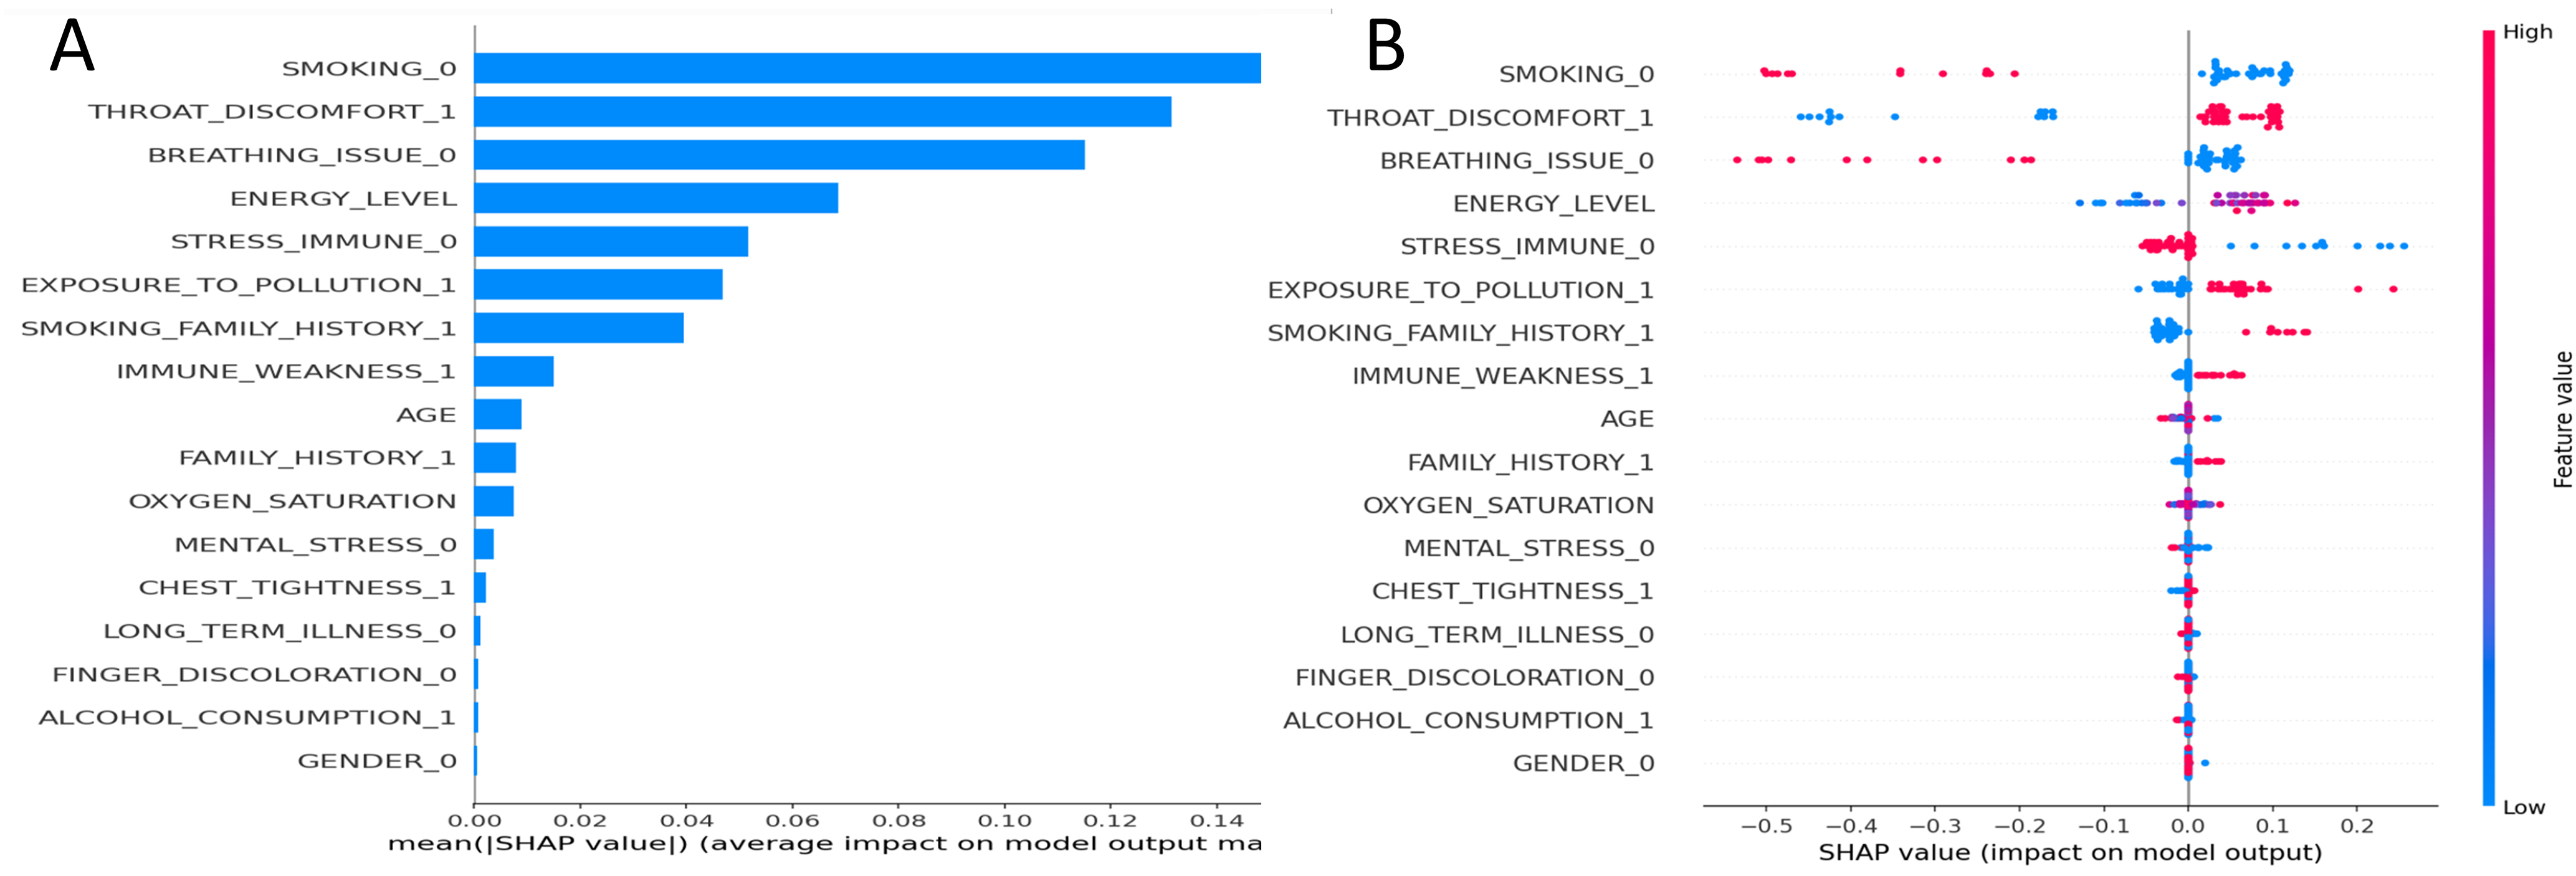
Figure 6. SHAP interpretability analysis for the final classification model. (A) Global feature importance ranked by mean absolute SHAP value (|SHAP value|), indicating the average impact magnitude on the model output; (B) SHAP summary plot (beeswarm) showing the distribution of SHAP values for each feature across individual predictions. Each point represents a single prediction; its position on the x-axis denotes the impact on the model output (positive values push toward class 1, negative toward class 0), and its color represents the original feature value (red = high/present, blue = low/absent). SHAP: SHapley Additive exPlanations.


