


fig3
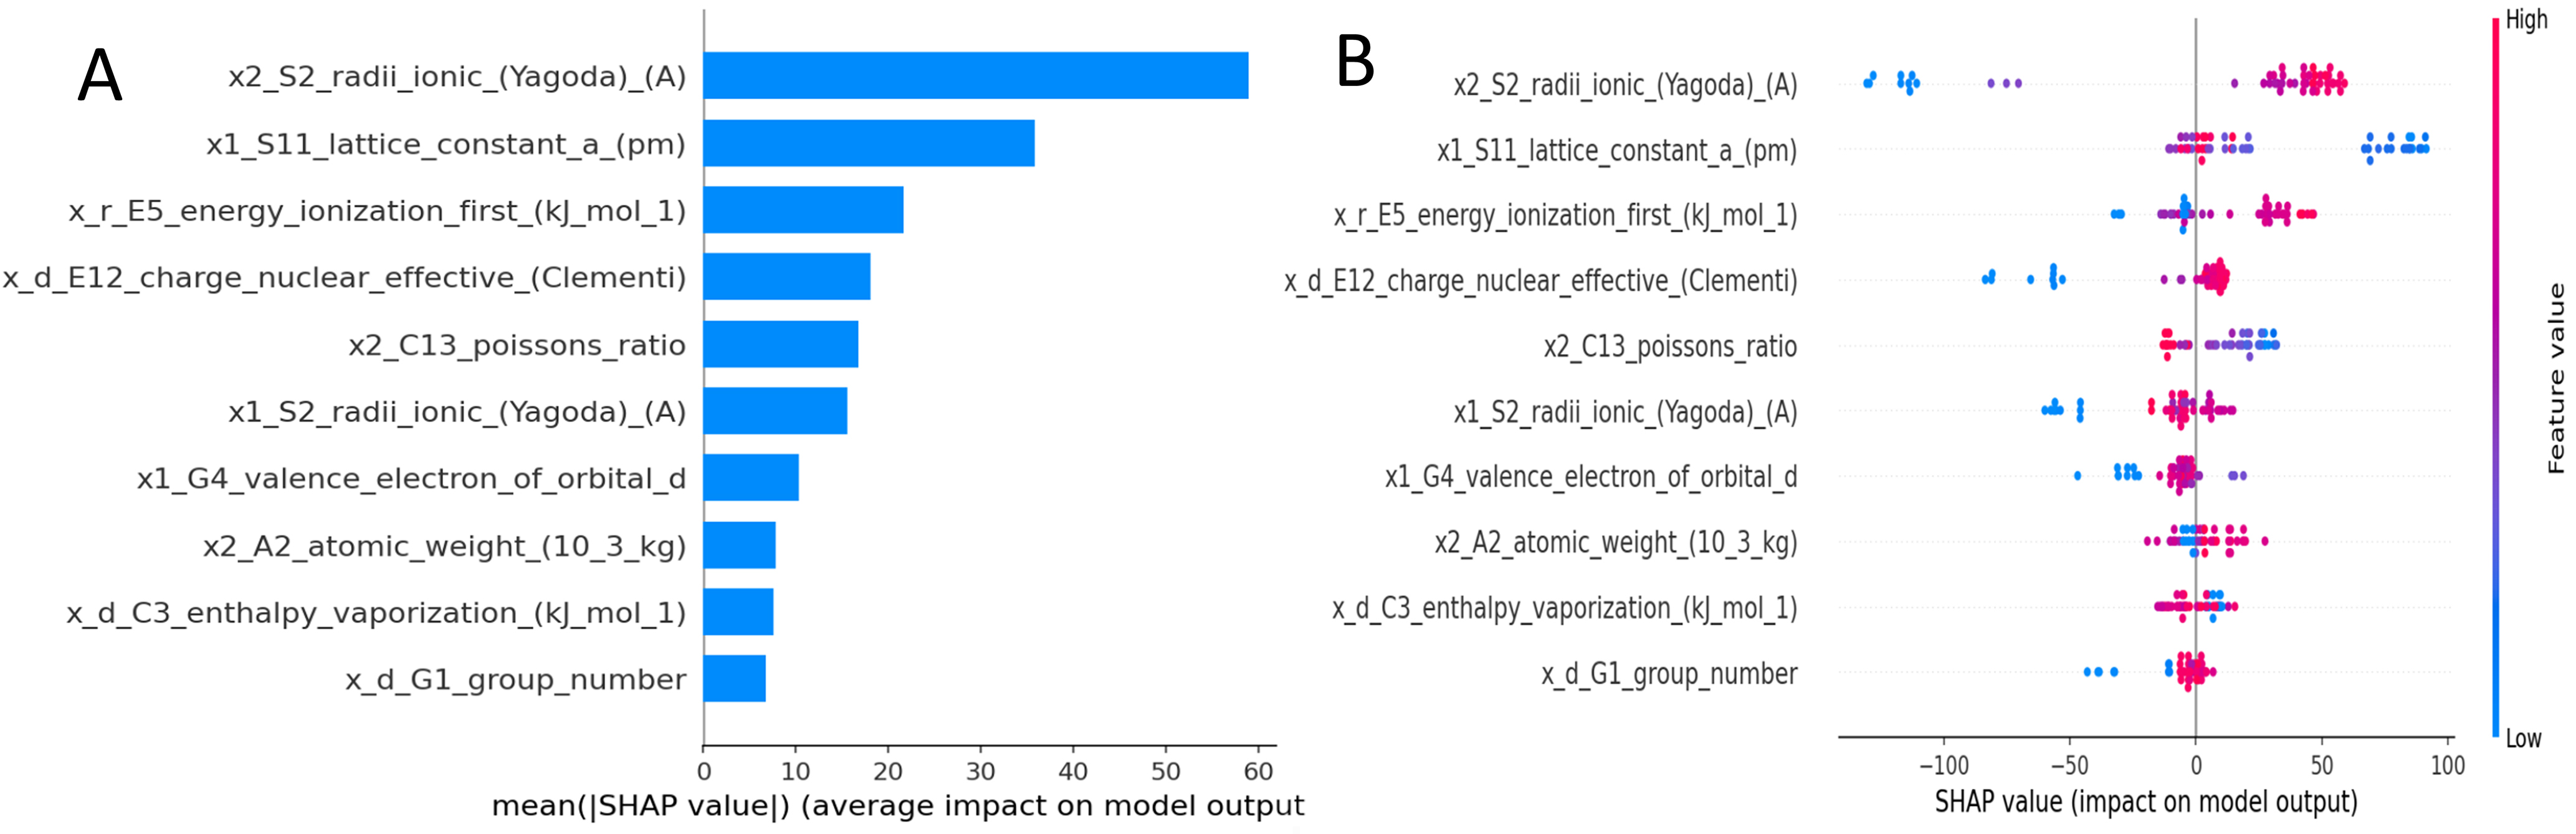
Figure 3. SHAP analysis results for interpreting the final XGBoost model predicting aluminum alloy strength. (A) Global feature importance ranked by mean absolute SHAP value, indicating the average magnitude of impact on model predictions; (B) SHAP summary plot (beeswarm) illustrating the distribution, direction (positive/negative SHAP value), and magnitude of impact for each feature across individual predictions, colored by the feature’s original value (red = high, blue = low). SHAP: SHapley Additive exPlanations; XGBoost: eXtreme Gradient Boosting.


