


fig2
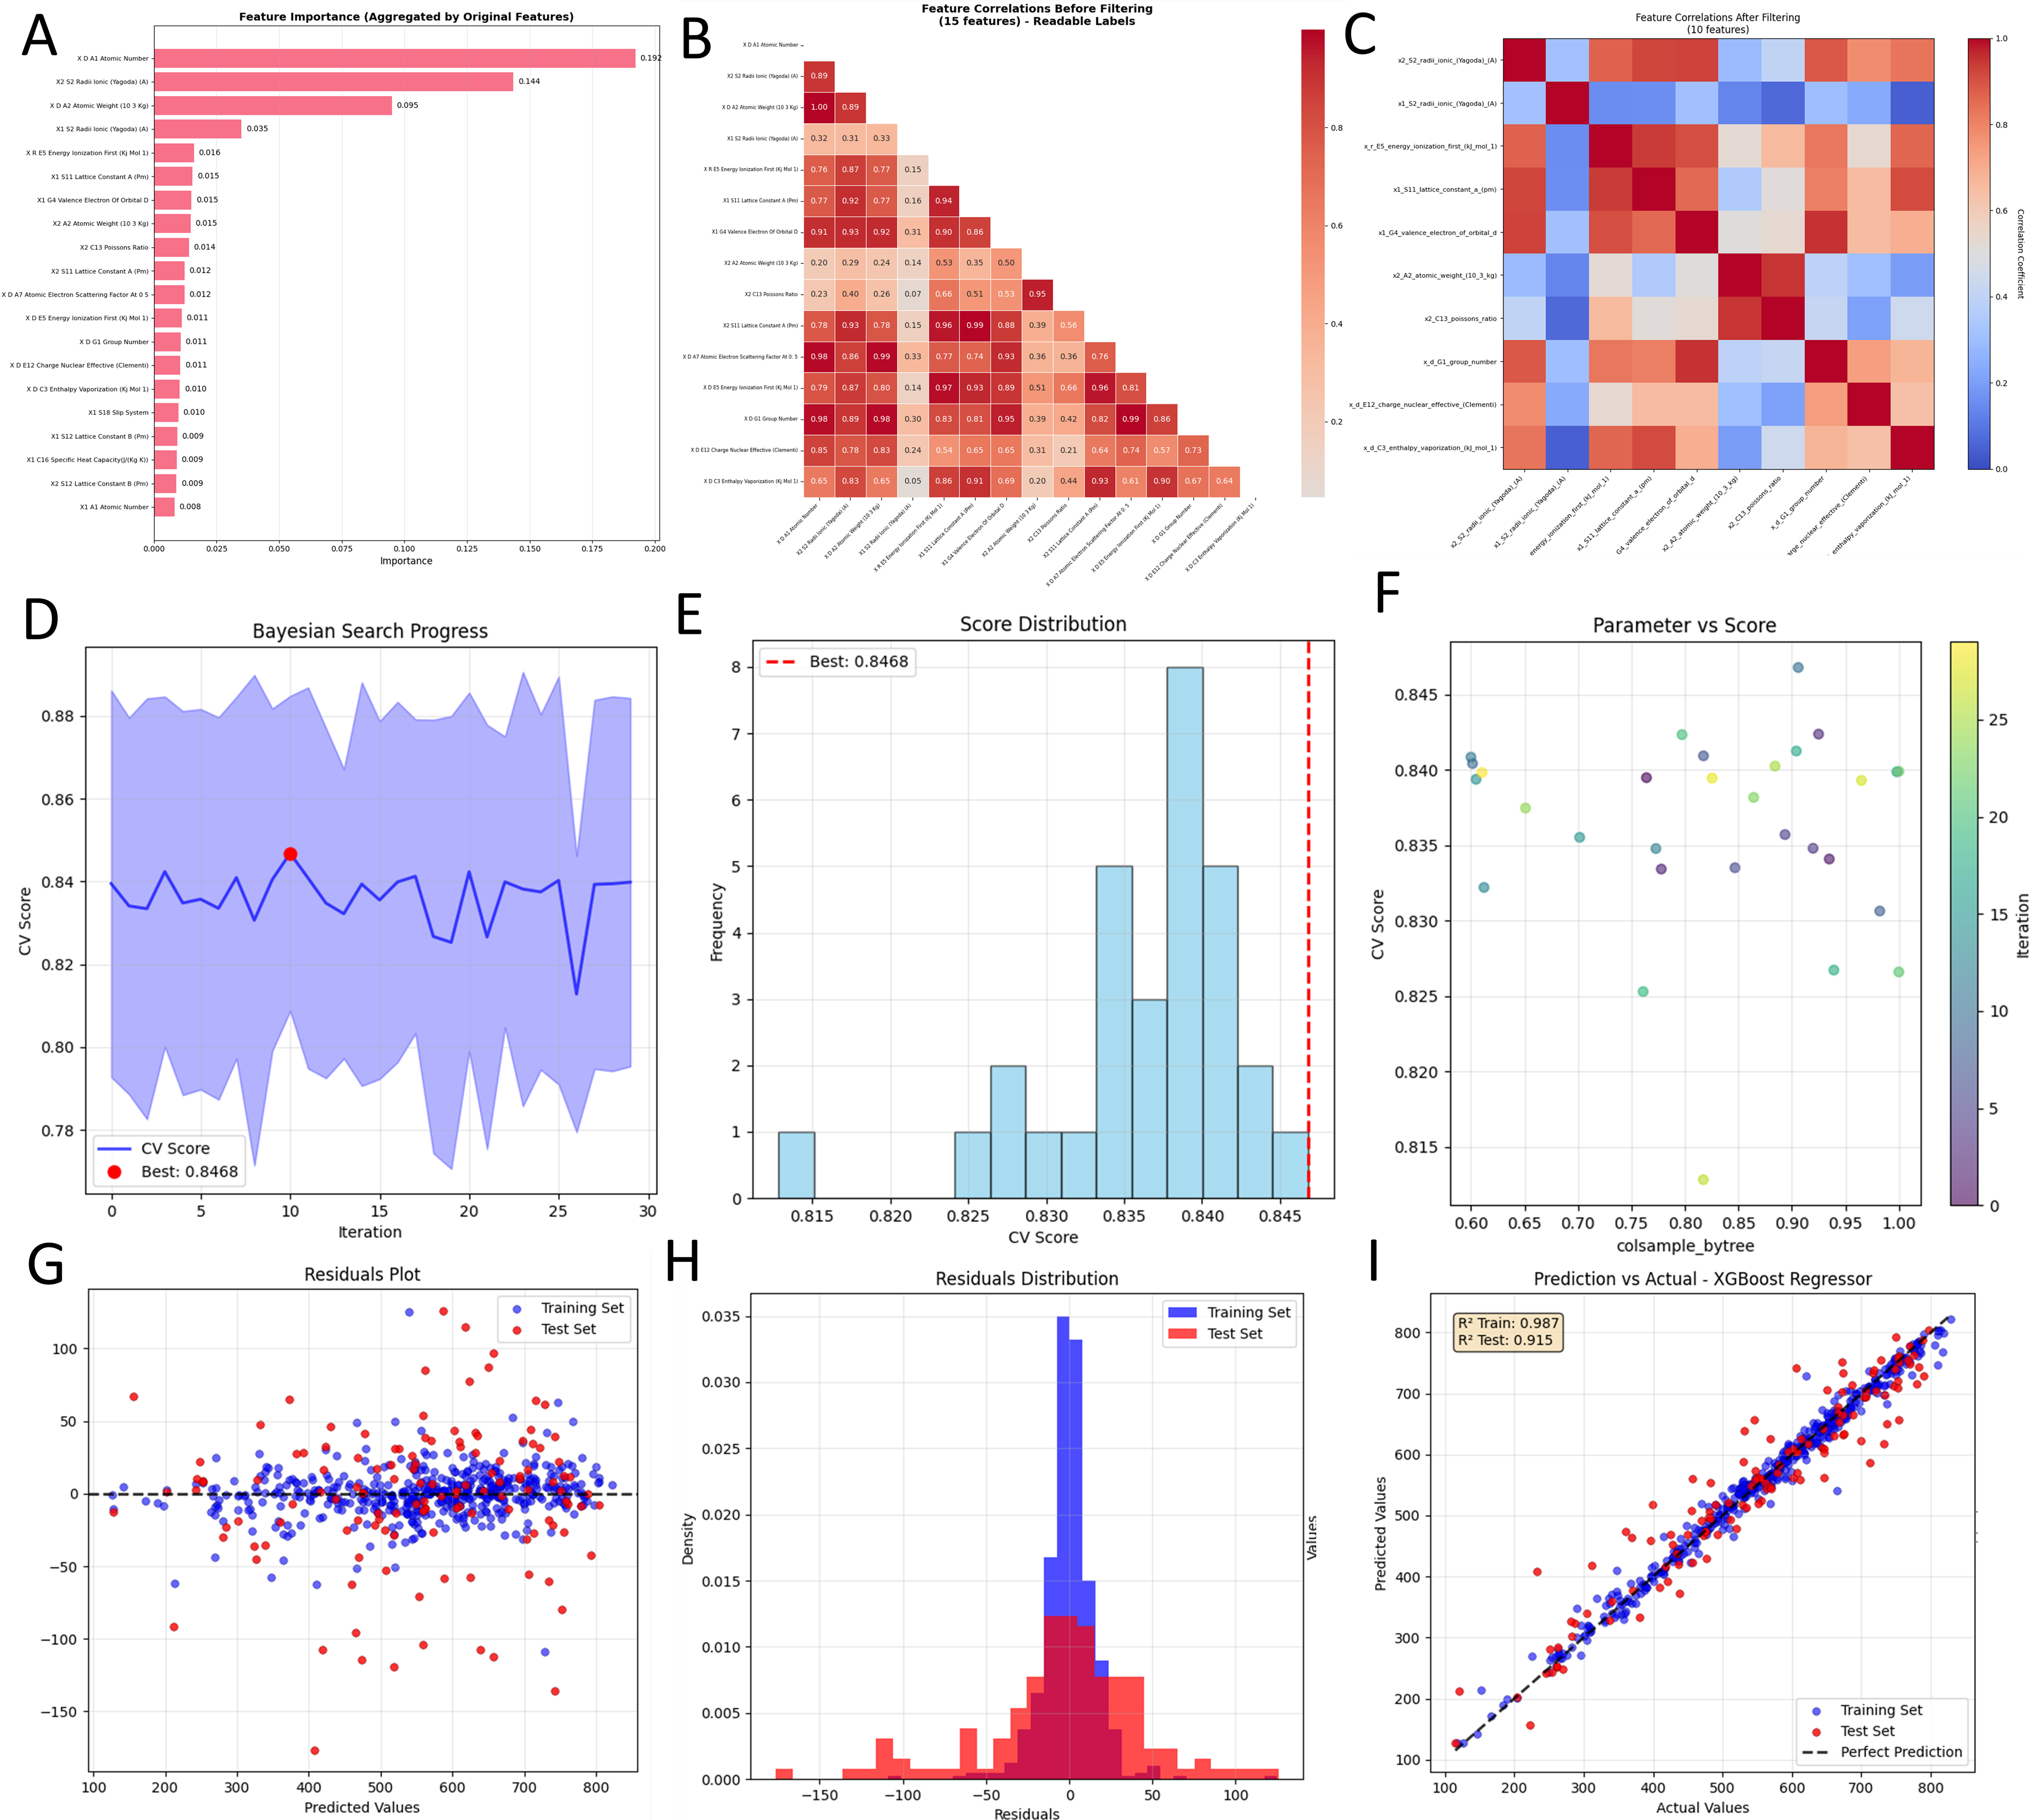
Figure 2. Comprehensive visualization of the automated regression workflow in MatSci-ML Studio for predicting aluminum alloy strength. (A) Feature importance plot ranking the most influential descriptors based on their predictive power. Error bars indicate the standard deviation of importance scores across CV folds; (B) Initial correlation matrix revealing multicollinearity among the 264 engineered features; (C) Correlation matrix of the refined subset of 13 features after automated filtering, displaying significantly reduced inter-correlation; (D) Progress of Bayesian hyperparameter optimization over 30 iterations, plotting the CV R2 score and indicating the best score achieved (red dashed line); (E) Distribution of CV scores from the optimization search, confirming the stability of the optimal parameter set; (F) Parameter vs. score plot for the colsample_bytree hyperparameter, illustrating the optimization search path; (G) Residuals plot for the final model, showing the difference between predicted and actual values for both training (blue) and test (red) sets; (H) Distribution of residuals, centered around zero, indicating an unbiased model; (I) Predicted vs. actual UTS values for the training (R2 = 0.987) and test (R2 = 0.915) sets. The dashed black line represents perfect prediction (y = x). ML: Machine learning; CV: cross-validation.


