


fig12
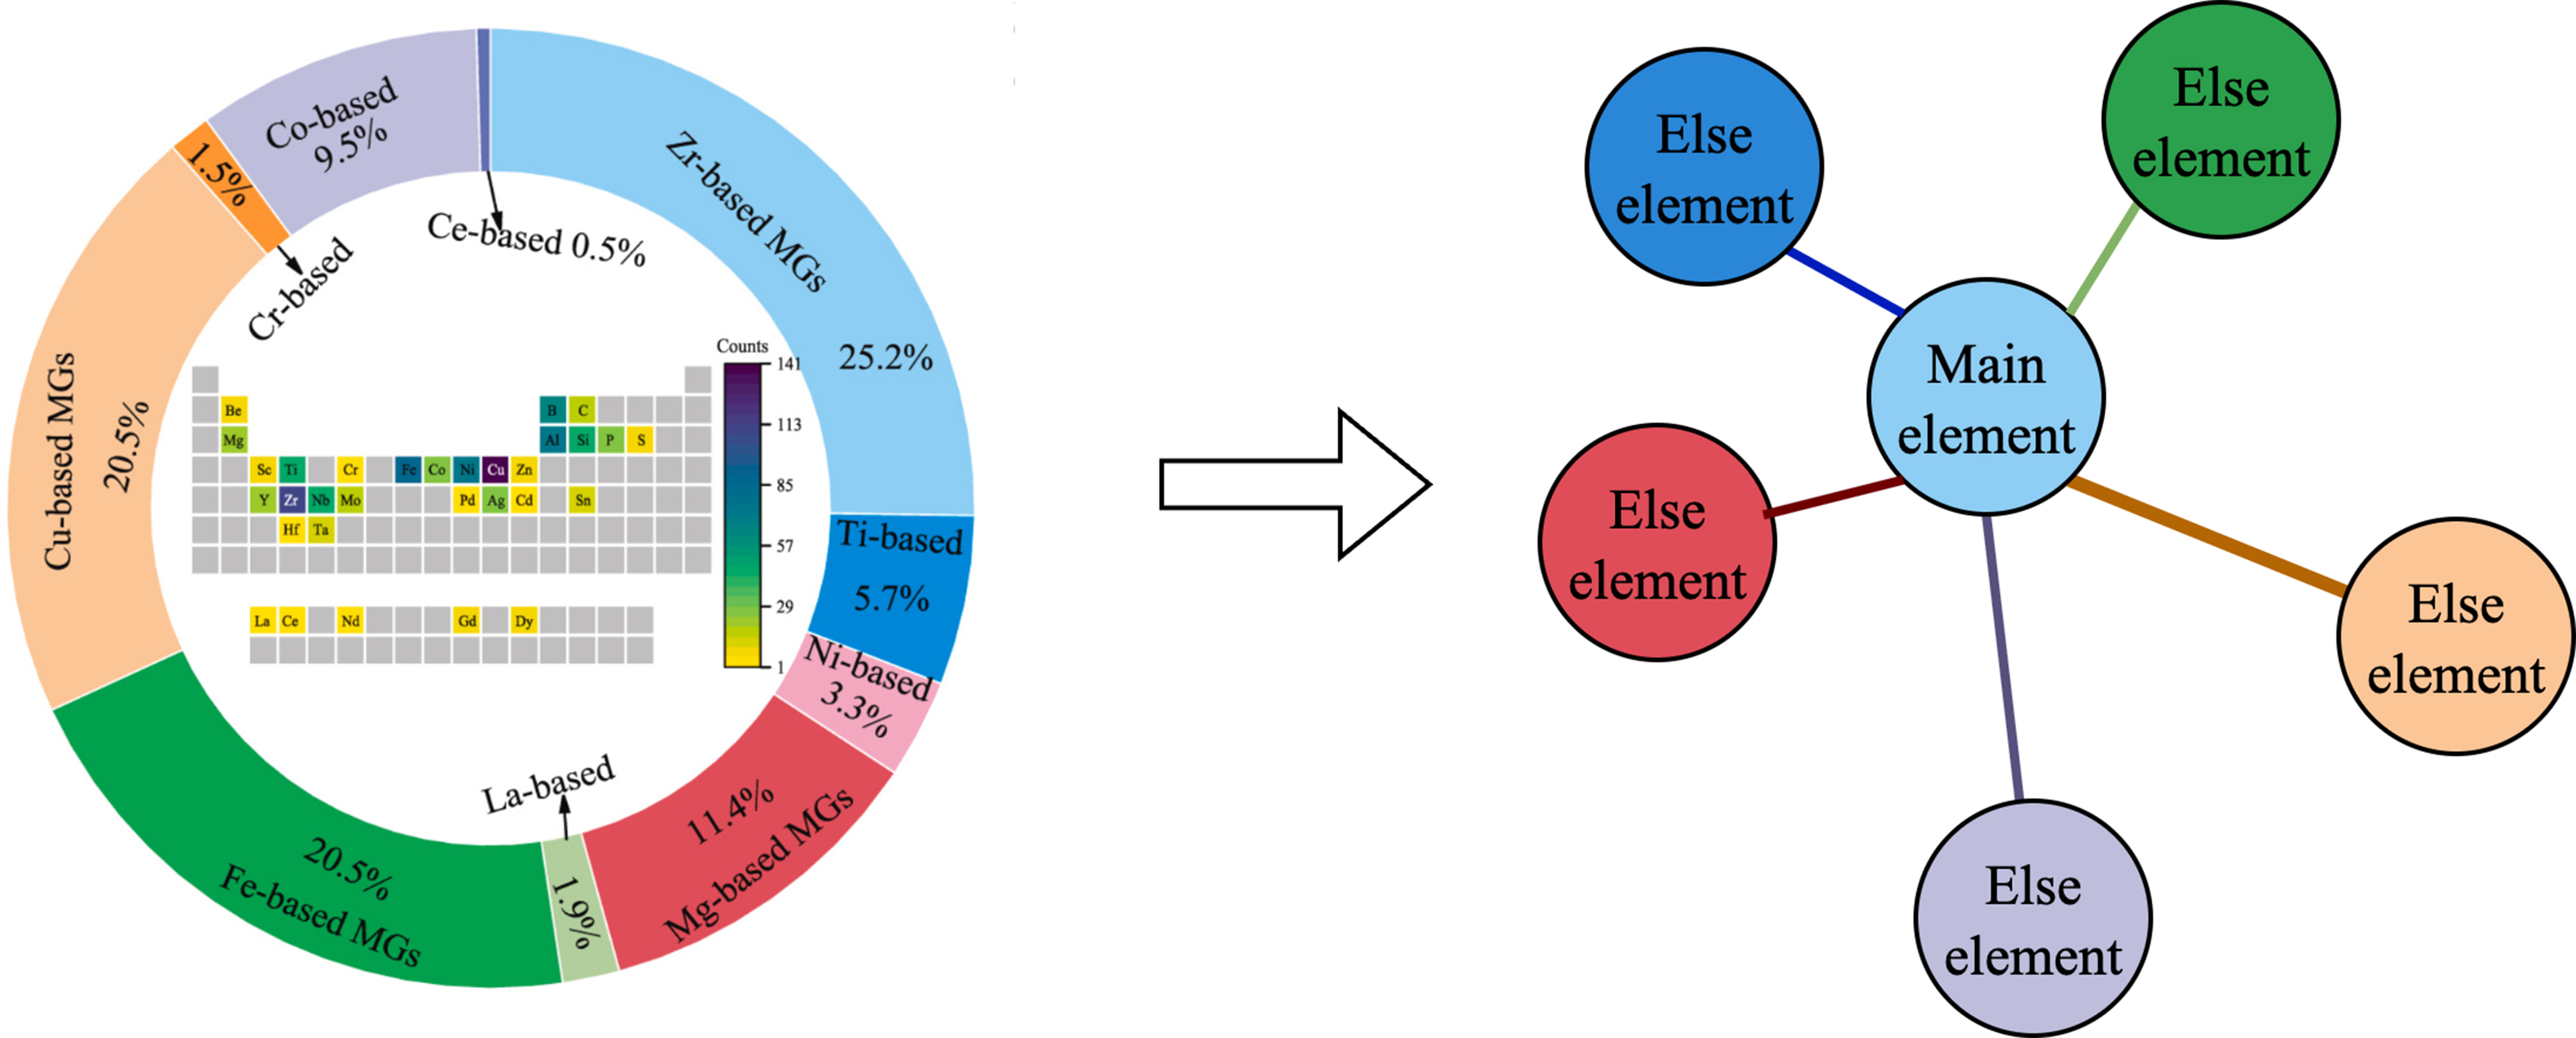
Figure 12. Graph representation of alloy composition for mechanical-property prediction. Each node denotes an alloying element, and each edge represents the correlation between a pair of elements and the target property. Edge color encodes correlation strength - lighter tones indicate weaker relationships, while darker tones mark stronger ones - and edge width scales with the same metric to aid visual comparison. Adapted from Ref.[76], copyright © 2024 Elsevier Ltd.


