


fig4
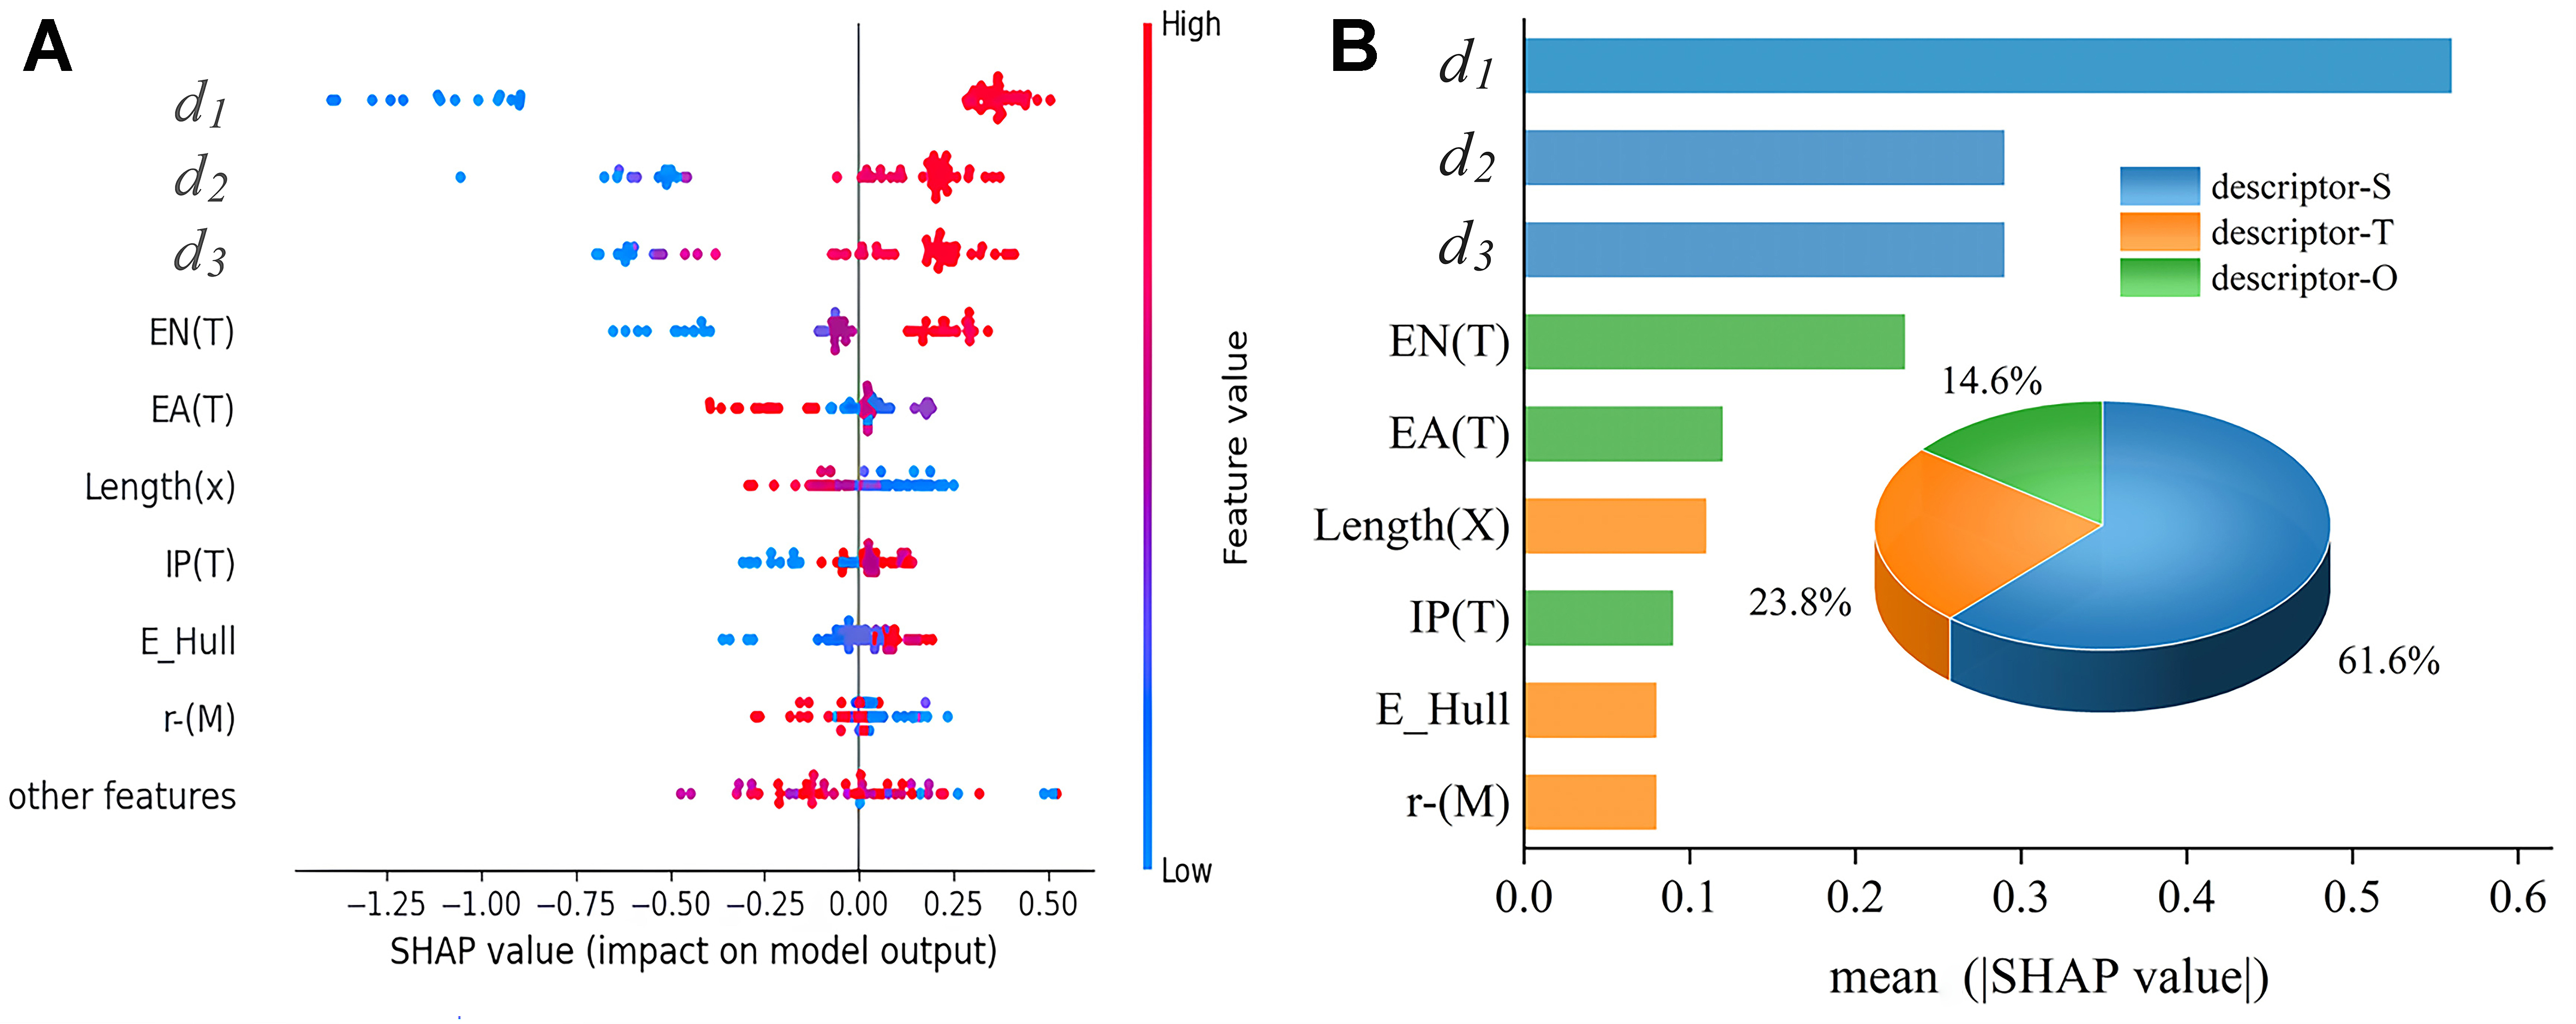
Figure 4. Feature importance analysis using SHAP values. (A) SHAP value plot showing the impact of various features on the model output; (B) Bar chart of mean SHAP values for different features, with a pie chart illustrating the proportion of descriptor categories: SISSO descriptors (S), functional group descriptors (T), and other descriptors (O). SHAP: SHapley Additive exPlanations; SISSO: Sure Independence Screening and Sparsifying Operator.


