


Estimating drinking water PFAS exposures associated with serum clinical action levels using a probabilistic toxicokinetic model
 0
0 Abstract
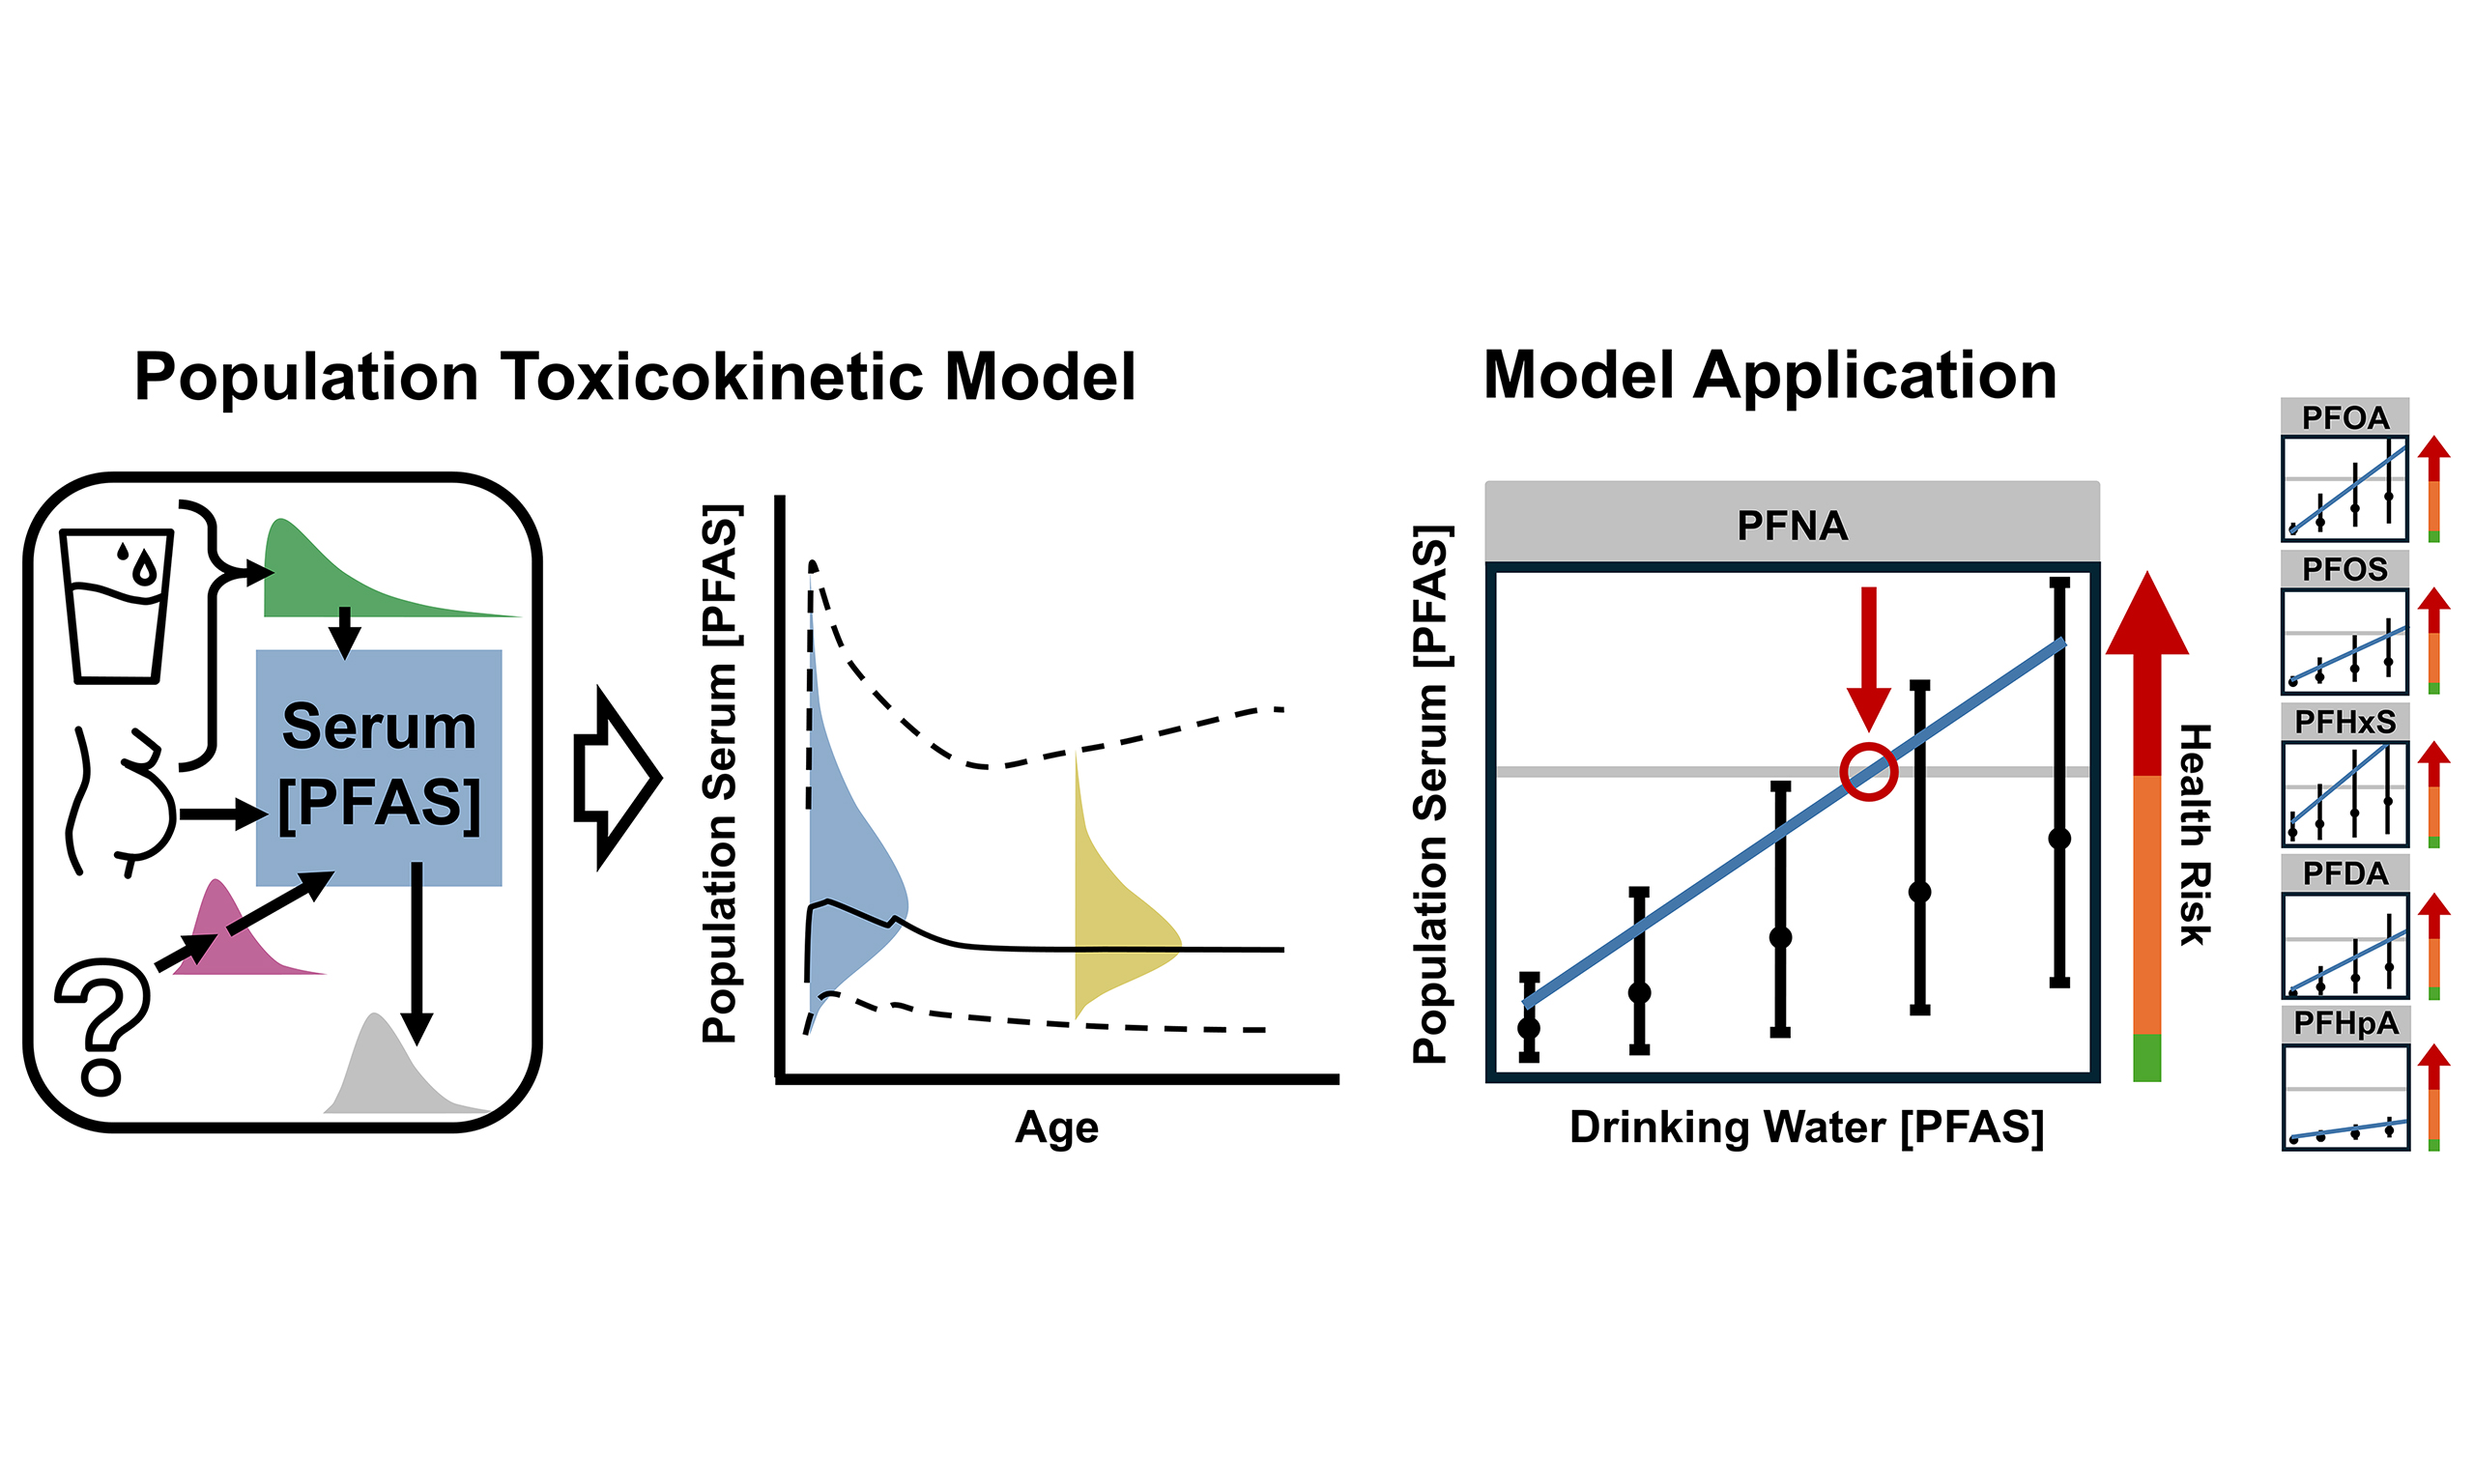
Consumption of drinking water is a major and actionable human exposure pathway for per- and polyfluoroalkyl substances (PFAS), making it a focus of regulatory efforts. Population-based clinical guidelines recently established serum PFAS levels associated with health risk, but translating these into corresponding external drinking water exposure concentrations remains a data gap. Toxicokinetic (TK) models that relate drinking water PFAS concentrations to population serum levels provide a framework to link clinical guidelines with environmental exposure. In this study, we expand and evaluate a probabilistic, one-compartment TK model to estimate population serum PFAS concentrations for six regulated PFAS. We implement the model to estimate drinking water PFAS concentrations that maintain serum concentrations in sensitive populations below a clinical action level recommended by the National Academies of Sciences, Engineering and Medicine. Model revisions include incorporating population variability distributions for exposure factors, implementing continuous modeling from birth to account for transgenerational transfer, improving computational efficiency, and adding two additional PFAS. Distributions of modifiable parameters are combined using Monte Carlo simulations to predict the distribution of serum PFAS concentrations across defined populations. Model predictions reproduced empirical serum concentrations for populations of infants, children, and adults within two-fold error of observed central tendencies and upper percentiles for six PFAS. Drinking water concentrations that maintain serum concentrations below the National Academies of Sciences, Engineering, and Medicine clinical action level for breastfed infants range from 19 to 162 ng/L for the six PFAS, individually. These drinking water concentrations can inform regulatory, policy, and clinical decision-making, although they are not appropriate as health-protective drinking water standards.
Keywords
INTRODUCTION
Per- and polyfluoroalkyl substances (PFAS) are a large class of fluorinated organic compounds that have been widely used in commercial and industrial products for decades. PFAS comprise a class of more than 10,000 compounds characterized by carbon-fluorine bonds that impart exceptional chemical stability and environmental persistence[1]. Only a subset of PFAS used in commercial applications have been routinely measured in the environment and in human populations. However, human epidemiological studies and large-scale population biomonitoring efforts indicate near universal exposure to some PFAS[2].
Ongoing human exposure remains a public health concern due to well-documented associations between PFAS exposure and high cholesterol[3,4], dyslipidemias[5,6], liver effects[7,8], low birth weight[9,10], immunosuppression and decreased response to vaccination in children[11], and certain types of cancers[12]. Animal toxicological studies provide supporting evidence for many of the outcomes observed in epidemiological studies[5,13-15]. Adverse developmental health effects, combined with early life exposure pathways such as placental[16,17] and lactational[18-21] transfer, make infants and young children particularly sensitive populations for PFAS exposure.
While PFAS exposure occurs through multiple pathways[22,23] including diet[24-26], household dust[27], and consumer products[28], the consumption of drinking water remains an important exposure source[29] and one that is uniquely actionable from a regulatory perspective. In the general population, drinking water is estimated to account for approximately 2%-34% of total PFAS exposure, depending on the specific compound[30]. Studies have shown that populations exposed to elevated PFAS concentrations in drinking water exhibit significantly higher PFAS blood levels than populations with lower drinking water exposure[31-38].
Drinking water regulations are one tool to reduce population PFAS exposure and communicate whether concentrations in drinking water present a health risk. Since 2016, multiple federal and state authorities have developed and promulgated drinking water guidelines and standards for PFAS[39]. These standards and guidelines, with few exceptions, have decreased over time, reflecting a better understanding of the behavior of PFAS in the environment, human exposure, and associated negative health impacts[39]. In 2020, Massachusetts (MA) promulgated drinking water standards based on protection of susceptible populations for perfluorooctanoic acid (PFOA), perfluorooctanesulfonic acid (PFOS), perfluorononanoic acid (PFNA), perfluorohexanesulfonic acid (PFHxS), perfluoroheptanoic acid (PFHpA), and perfluorodecanoic acid (PFDA)[13]. The U.S. Environmental Protection Agency (USEPA) finalized standards for six PFAS in 2024[40], then proposed rules to narrow the regulatory scope to only PFOA and PFOS in 2026[41], leaving a range of regulatory decisions to protect sensitive populations to state authorities. The evolving federal and state regulatory landscape reflects both increasing scientific clarity around PFAS health risks and continuing uncertainty about the appropriate scope of national standards.
While drinking water standards aim to reduce population health risk from this external exposure source, the National Academies of Sciences, Engineering, and Medicine (NASEM) developed complementary clinical guidelines to interpret health risks associated with measured PFAS concentrations in serum (or plasma)[42]. The NASEM clinical guidelines address an important need for communities affected by PFAS contamination by providing the only available quantitative guidelines for clinicians on interpreting individual serum PFAS testing results[42]. Following a review of available approaches that identify human serum PFAS concentrations associated with a spectrum of health risk levels, the NASEM Committee concluded that health risk increases with serum PFAS Concentrations above 20 ng/mL to a level that warrants additional clinical actions beyond the usual standard of care[42]. The NASEM clinical guidelines apply to the sum of seven PFAS routinely measured in the National Health and Nutrition Examination Survey (NHANES): PFOA, PFOS, PFHxS, PFNA, PFDA, perfluoroundecanoic acid, and methylperfluorooctane sulfonamidoacetic acid, with a note that this additive approach could be expanded to apply to additional PFAS[42].
Quantitative tools that relate drinking water concentrations to serum PFAS levels of clinical concern are helpful for integrating PFAS exposure, regulatory limits, and clinical guidance. To this end, we revised and expanded an existing probabilistic toxicokinetic (TK) model to predict population-level serum PFAS concentrations attributable to drinking water exposure. Although several TK models estimate individual serum PFAS levels, the revised model we developed generates population-level serum predictions across the life course under varying drinking water exposure scenarios and is easily modified to address a range of clinical, risk communication, and policy questions. We demonstrate a novel application to derive PFAS concentrations in drinking water that are associated with levels of clinical concern for the six PFAS that currently have promulgated MA drinking water standards.
EXPERIMENTAL
TK model overview
We revised a previously published probabilistic one-compartment TK model by Lynch et al. (2023)[43]. Model revisions predict the distribution of population serum PFAS concentrations attributable to drinking water exposure over the life course for six PFAS. The population PFAS TK model is designed as a tool to support clinical, policy, and other decision-making by providing a quantitative linkage between exposure to PFAS in drinking water and the distribution of resultant internal serum PFAS concentrations for populations, with explicit consideration of sensitive subgroups, including infants. Exposure pathways include ingestion of contaminated drinking water, PFAS transfer from maternal serum at birth and to breast milk, and non-drinking-water sources [Figure 1]. Chemical-specific TK parameters and age-specific exposure factors are represented with probabilistic parameter distributions, which are combined using Monte Carlo simulation to generate population serum PFAS distributions over time. All model parameters and inputs are listed in Supplementary Table 1 and described in the methods below.
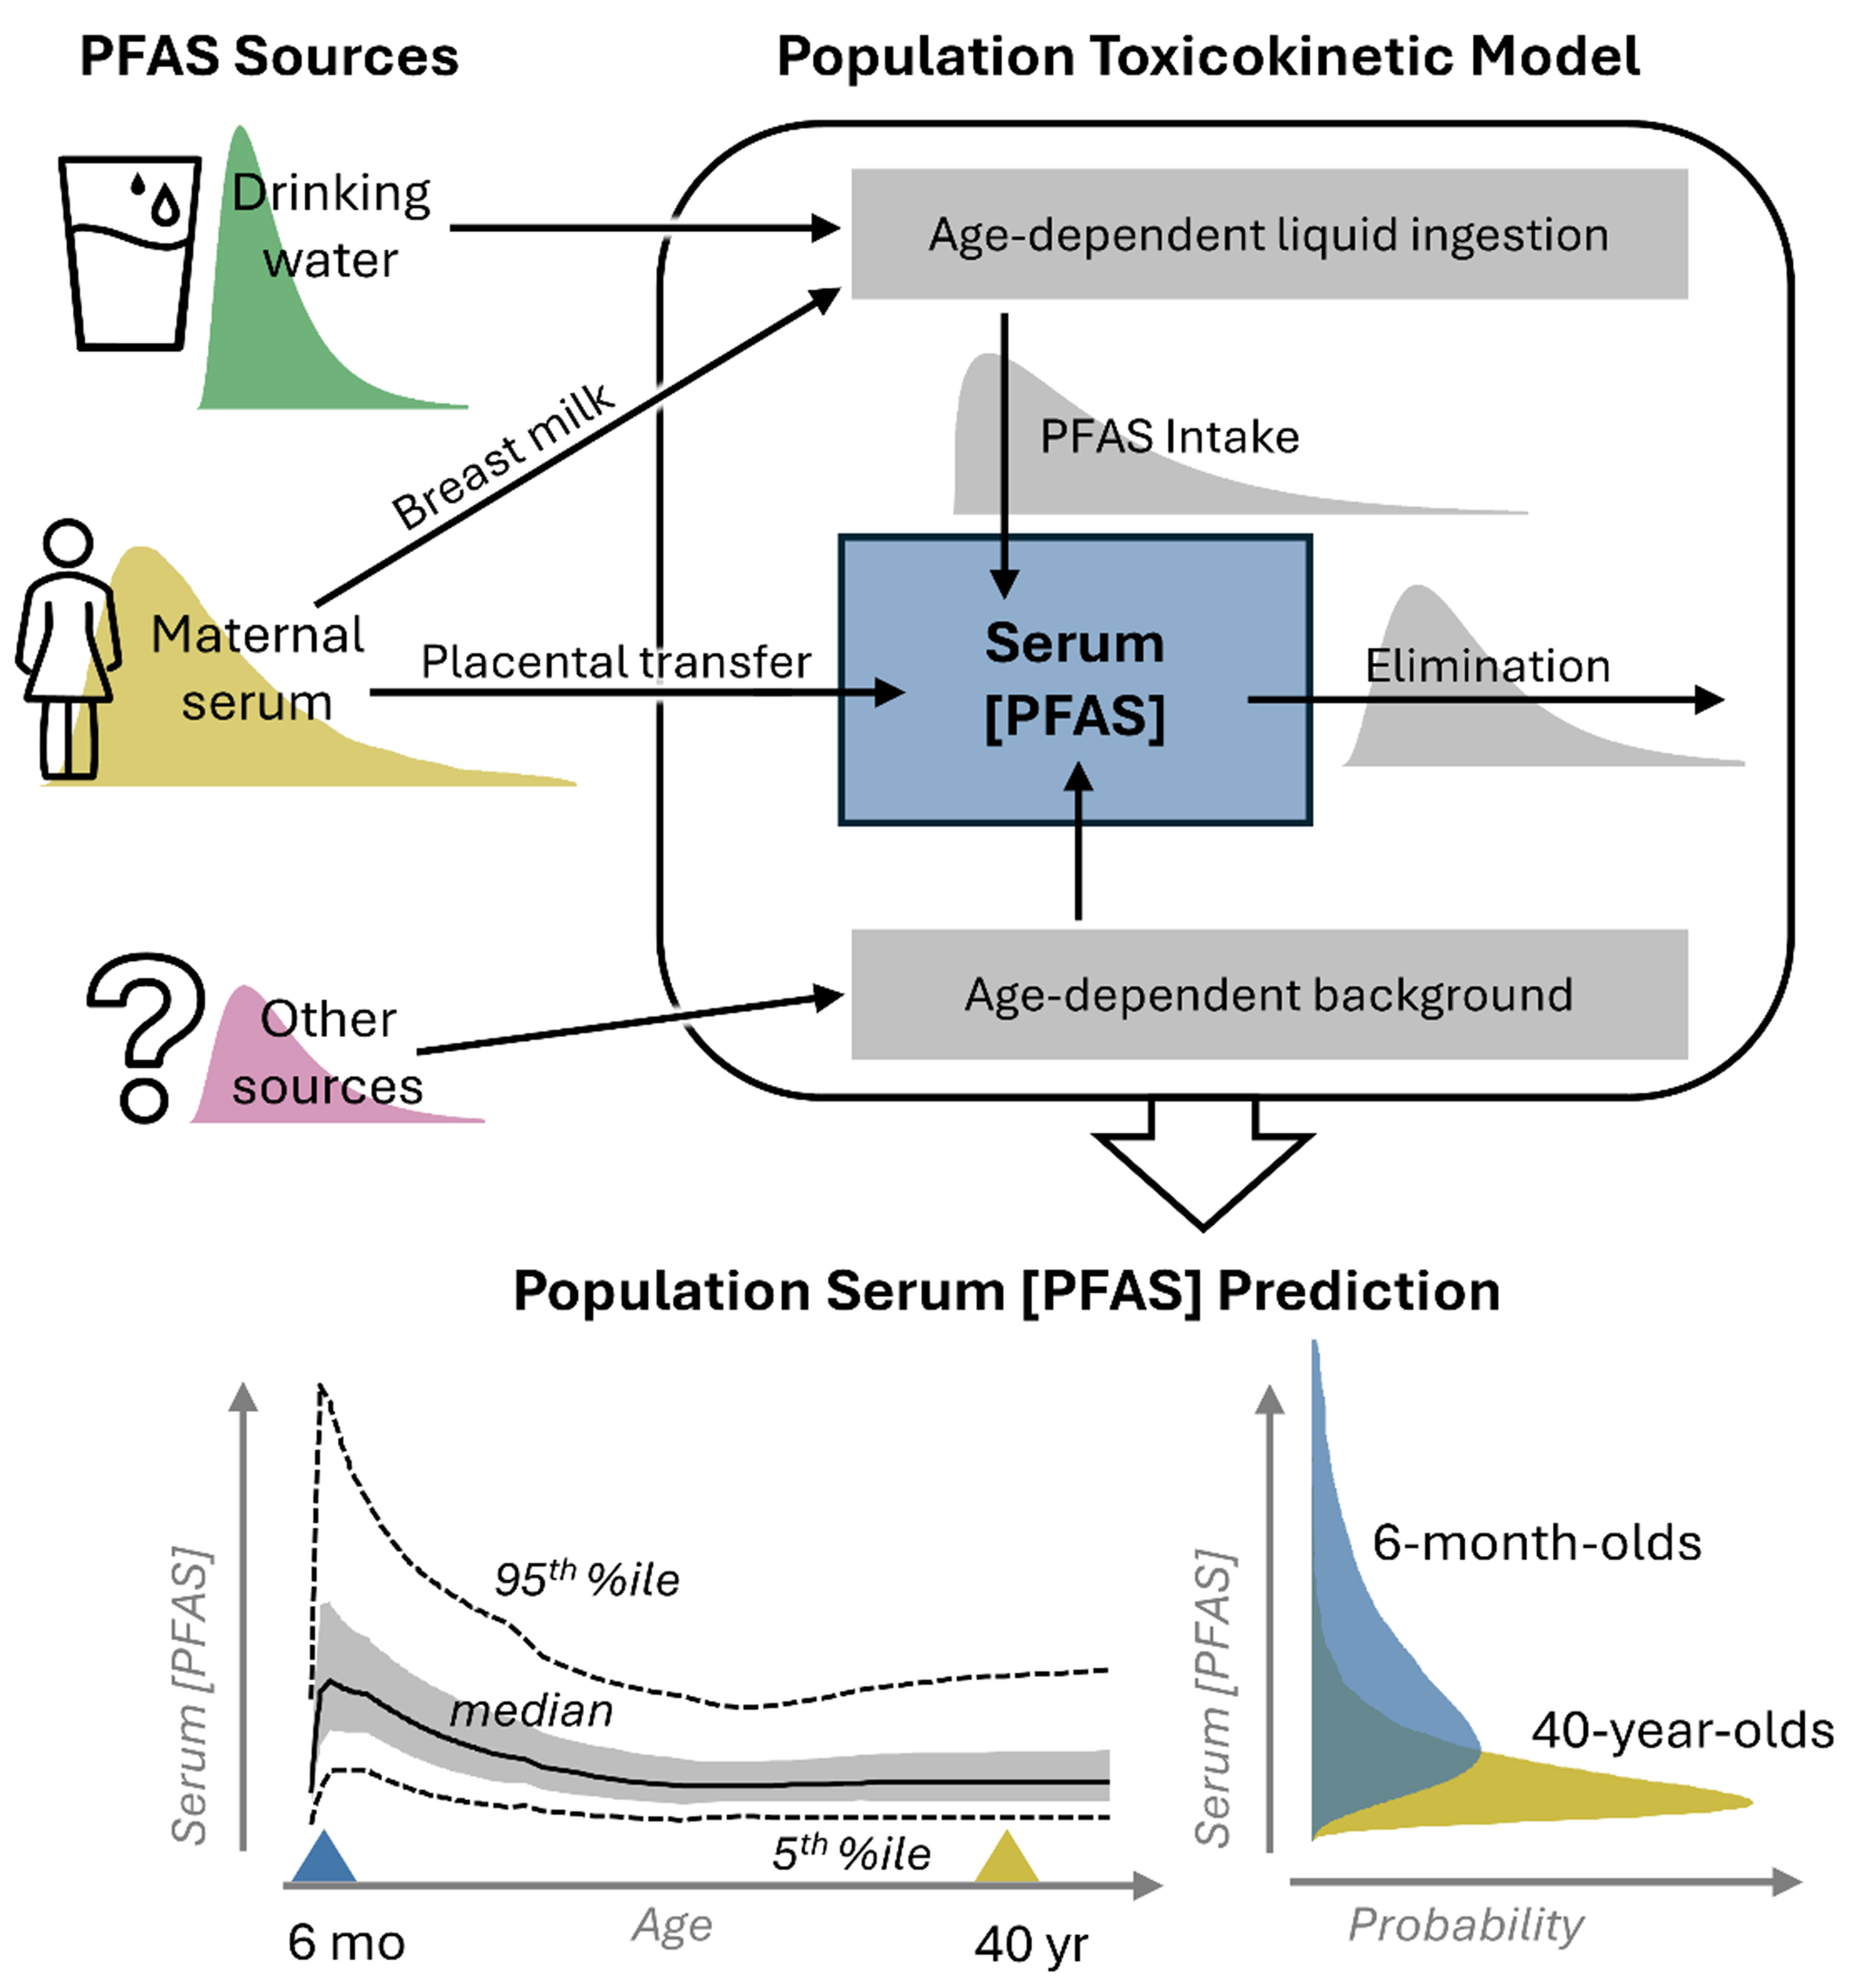
Figure 1. Overview of the PFAS TK model processes for predicting population serum PFAS concentrations ([PFAS]) from drinking water PFAS. Population distributions of chemical-specific parameters and exposure factors, some of which change with age, are combined using Monte Carlo simulation to predict the distribution of serum [PFAS] in a specified population. PFAS: Per- and polyfluoroalkyl substances; TK: toxicokinetic.
We demonstrate the model capabilities by applying reverse dosimetry to estimate drinking water concentrations predicted to elevate serum PFAS concentrations in infants to the NASEM clinical action level. This approach provides a quantitative framework to evaluate the relationship between internal and external PFAS exposure and inform public health decision-making.
Model updates vs. ATSDR model
The model by Lynch et al. (2023) is intended for use by individuals and predicts age groups separately, with one model for infants/children less than 6 years old and one for children older than 6 and adults[43]. Model revisions predicting the distribution of population serum PFAS concentrations, fall into four main categories including: (1) modifications to exposure factor distributions and exposure scenario flexibility to allow population-level predictions; (2) changes to the modeling framework for infants and young children and to enable continuous prediction from birth; (3) model processing changes to increase computational efficiency, and (4) the addition of parameters and modeling capability for PFDA and PFHpA. Model revisions are listed and compared with the Lynch et al. (2023) model in Supplementary Table 2, and parameters for PFDA and PFHpA are described in Table 1[43].
Chemical-specific TK parameter distributions including shape, means and standard deviations, and sources of values
| PFAS | Half-life (years) | Volume of distribution, weight-adjusted (L/kg) | Placental transfer factor (unitless) | Lactational transfer factor (unitless) | Breast milk elimination rate constant (1/day)a | |||||
| GM (GSD) | Source | GM (GSD) | Source | Mean (2% SD) | Source | Mean (2% SD) | Source | Meanb | Source | |
| PFOA | 3.14 (1.57) | Chiu et al. (2022) [44] | 0.434 (1.12) | Chiu et al. (2022)[44] | 0.87 | Lynch et al. (2023)[43] | 0.052 | Lynch et al. (2023)[43] | 4.26 × 10⁻³ | Supplementary Table 3 |
| PFOS | 3.36 (1.57) | 0.32 (1.10) | 0.42 | 0.013 | 1.99 × 10⁻³ | |||||
| PFHxS | 8.30 (1.57) | 0.29 (1.11) | 0.7 | 0.014 | 8.44 × 10⁻⁴ | |||||
| PFNA | 2.35 (1.53) | 0.19 (1.12) | 0.53 | 0.01 | 9.11 × 10⁻⁴ | Supplementary Equation (3) | ||||
| PFDA | 4.72 (1.57) | USEPA (2024)[45] | 0.365 (1.12) | USEPA (2024)[45] | 0.32 | Appel et al. (2022)[16] | 0.023 | Zheng et al. (2022)[50] | 2.10 × 10⁻³ | |
| PFHpA | 0.384 (1.57) | Dawson et al. (2023)[46] | 0.21 (1.12) | Kabadi et al. (2018)[48], Ohmori et al. (2003)[47] | 1.25 | 0.052 | Set to PFOA | 4.26 × 10⁻³ | Set to PFOA | |
Modeling population serum PFAS concentrations over time
An overview of the exposure sources, TK modeling, and model outputs is shown in Figure 1. Serum PFAS is calculated over time using the integrated rate law for the one-compartment system with zero-order intake and first-order elimination [Supplementary Figure 1][44]. Serum PFAS for a specified population is modeled across the entire life course, beginning with calculation of serum PFAS at birth (C0) [Equation (1)][43]. For each date, the current serum PFAS and associated parameter values are used to calculate serum PFAS for subsequent dates, accounting for exposure from drinking water or breast milk, exposure from non-drinking water or “background” sources, and PFAS elimination [Equation (2)].
Where:
CM is the maternal serum PFAS concentration at birth (µg/L),
and PTF is the placental transfer factor (unitless ratio).
Where:
Bi+1 is the serum PFAS “background” on the subsequent (i+1)th date (µg/L),
Ci is the total serum PFAS on the ith date (µg/L),
Bi is the serum PFAS “background” on the ith date (µg/L),
kel is the elimination rate constant (1/days), calculated from half-life kel = ln(2)/(T1/2*365.25),
ti is the number of days after birth on the ith date,
ti+1 is the number of days after birth on the subsequent (i+1)th date,
LIi is the mean daily body weight-adjusted liquid intake starting on the ith date [mL/(kg-day)],
AFi is the adjustment factor for liquid intake starting on the ith date (unitless ratio),
LCi is the concentration of PFAS in the liquid consumed (ng/L),
Vd is the weight-adjusted volume of distribution (L/kg), and
the factor of 106 converts the third term’s units to µg/L.
Modeled populations consume PFAS in either drinking water (adult) or breast milk (infant). Breast milk PFAS concentrations are determined by maternal serum PFAS concentrations at birth and decrease over time [Equation (3)].
Where:
BMCi is the breast milk PFAS concentration on the ith date (ng/L),
CM is the maternal serum PFAS concentration at birth (µg/L),
LTF is the lactational transfer factor (unitless ratio),
kmilk is the rate constant for breast milk decline over time (1/days),
ti is the number of days after birth on the ith date, and
the factor of 1000 converts units to ng/L.
TK model parameters
Half-life (T1/2) and volume of distribution (Vd)
Parameter distributions for T1/2 and Vd are shown in Table 1. The geometric mean (GM) and geometric standard deviation (GSD) for T1/2 and Vd for PFOA, PFOS, PFHxS, and PFNA were calibrated from a Bayesian analysis of paired drinking water and serum concentrations in communities with PFAS exposure via drinking water[43,44]. The population data used in this analysis included males and females, resulting in distributions that capture sex-based differences in PFAS elimination for the study populations. Therefore, we used the same T1/2 for modeling males and females. The same Vd distribution also applies to males and females. This model adds parameters and prediction capability for PFDA and PFHpA. Human TK parameter data are limited for PFDA and PFHpA. The PFDA T1/2 was calculated using rodent-based Vd estimates and human clearance[45]. The T1/2 value for PFHpA was derived from an analysis that used Monte Carlo simulation to aggregate available human PFHpA T1/2 data separately for males and females[46]. The slightly longer mean female T1/2 value from the resulting distribution is used for modeling[46]. The arithmetic mean of available Vd values from male and female rats is used for both PFDA[45] and PFHpA[47,48]. No distributional analyses for PFDA or PFHpA T1/2 or Vd were found, so we used the PFOA GSD for T1/2 and Vd.
Transgenerational transfer
This model requires a user-defined selection for maternal serum PFAS concentrations at birth (CM) and includes two options: a steady-state distribution calculation from Lynch et al. (2023) and a new model feature to enter a CM distribution either from TK model output or literature/known values[43]. Transgenerational transfer is then characterized by the placental transfer factor (PTF), the lactational transfer factor (LTF), and the elimination rate constant from breast milk (kmilk) [Table 1]. PTF and LTF are normal distributions with a 2% standard deviation[43]. kmilk is adjusted relative to LTF and does not have an independent distribution.
PTFs are calculated from the ratio of cord blood to maternal serum PFAS concentrations. Mean PTFs for PFOA, PFOS, PFHxS, and PFNA are adopted from Lynch et al. (2023)[43]. These are within 20% of the mean PTFs from a quantitative meta-analysis of 20 studies[16] and an updated PFOA PTF[49]. The PFDA and PFHpA PTFs are weighted mean estimates from meta-analyses of nine studies (total N = 1,179) and four studies (total N = 682), respectively[16].
Lactation transfer factors are the ratios of breast milk to maternal serum PFAS concentrations. The LTF determines the starting PFAS concentration in breast milk. Mean LTFs for PFOA, PFOS, PFHxS, and PFNA are adopted from Lynch et al. (2023)[43]. The LTF for PFDA is the mean of 23 paired serum and breast milk samples with PFDA detections[50]. The single study reporting an LTF for PFHpA had high variability, encompassing the LTF of PFOA[51]. Because of the high variability, we chose to use the PFOA LTF for PFHpA.
The breast milk PFAS concentration declines during the course of breastfeeding[52]. A breast milk elimination rate constant (kmilk) was determined for each PFAS. For PFOA, PFOS, and PFHxS, literature values for the monthly observed percent decrease of PFAS in breast milk were used to calculate kmilk [Supplementary Equation (2) and Supplementary Table 3]. For PFNA and PFDA, kmilk was projected from the theoretical proportionality between kmilk and LTF [Supplementary Equation (3)]. Because the PFHpA LTF is approximated using the LTF for PFOA, PFHpA uses the same kmilk as PFOA.
Liquid ingestion rates
Liquid ingestion (LI) rates apply to both drinking water and breast milk. Population variability in LI rates is incorporated in the model by multiplying a mean body weight-adjusted LI rate by an adjustment factor (AF) drawn from the AF distribution.
Age-specific mean LI rates are the combined direct and indirect water ingestion rates from the USEPA Exposure Factors Handbook (EFH) Tables 3-21 and 3-63 for ages > 1[53] or human milk intake rates from Table 15-1 for ages < 1[54] [Supplementary Table 4]. Mean LI changes each year and interpolates linearly between age-group-specific means for ages > 1. For ages < 1, mean LI updates to new mean values on the first day a new age group is achieved, without interpolation.
Population variability in LI rates for ages > 1 year was neither normally nor lognormally distributed. Variability for each age group/life stage was estimated using mean LI and associated percentiles of the population distributions supplied in the EFH. For each age group, LI at each reported percentile was divided by the corresponding mean LI to create an AF ratio. The R package rriskDistributions[55] was used to select and fit distributions to the observed percentiles for mean-adjusted LI, accounting for data with less statistical reliability [Supplementary Section 2]. Visual inspection and absolute error of fitted AF distributions for every age group showed that variability could be captured with three AF distributions: infant (0 - <1 year), child and adult (1 - <16 years and ≥ 21 years), and youth (16 - <21 years) [Supplementary Section 2]. Grouping population variability estimates across ages decreases computational complexity while retaining age group distribution characteristics.
Background serum PFAS
This model uses the same approach to incorporating exposure to non-drinking water “background” sources used by Lynch, et al. (2023)[43]. The general population PFAS exposure level is multiplied by 0.8, which apportions 80% of general population PFAS exposure to non-drinking water sources for incorporation in the model as “background”. The apportionment is based on USEPA’s default 20% relative source contribution from drinking water used when data are too limited to estimate contributions from different exposure sources[56,57]. These non-drinking water “background” sources of PFAS may include diet, dust, air, and consumer products, and these may change over time as PFAS use changes and may differ by location. General population exposure distributions for each PFAS come from from the sex-specific NHANES distribution of serum PFAS concentrations for individuals older than 12 (2017-2018 cycle) and for children ages 3-11 (2013-2014 cycle) [Supplementary Table 5]. Background at birth is set to zero and increases linearly to the child background level at age 3.
Model implementation
User-defined inputs are organized in Microsoft Excel and calculations are performed in R (Version 4.5.1 for this analysis[58]). Monte Carlo simulations combine exposure and TK parameter distributions to generate a population serum PFAS distribution. The user-specified exposure scenario includes selecting the modeling approach for maternal serum (CM), population sex(es), age(s), duration of breastfeeding, exposure period(s) specified as dates, and PFAS drinking water concentration(s) during the exposure period(s). The population serum distribution is calculated monthly before age 1 and annually thereafter, as well as when water exposure changes.
Each iteration of the simulation draws a single value from chemical-specific parameter distributions that are constant across the life course, including T1/2, Vd, PTF, LTF, and kmilk. The age-dependent parameter distributions, AF and B, are drawn independently for each age range [Supplementary Table 1].
We demonstrate the utility of the population PFAS TK model by: (1) showing predicted population serum PFAS concentrations over the life course at a constant drinking water exposure; (2) evaluating model performance using studies that report paired drinking water and serum PFAS concentrations; and (3) deriving drinking water concentrations associated with serum PFAS levels that reach the NASEM clinical action level of 20 ng/mL in sensitive populations. These three model applications are described below. We ran all modeling scenarios with 35,000 Monte Carlo iterations. This number of iterations is higher than the typical 500 to 1,000 iterations in other simulation studies and was selected to increase the reproducibility of model results across the distribution of predicted results[59]. Serum concentrations are presented in ng/mL or μg/L (1 ng/mL = 1 μg/L) and water concentrations are presented as ng/L.
Predicting lifetime population serum PFAS concentrations
To demonstrate the model’s ability to capture population serum trajectories over time, we modeled a male population from birth to age 70 with constant drinking water exposure of 20 ng/L for each PFAS [Supplementary Table 6]. We used the model feature to enter a known maternal serum PFAS distribution. The maternal distribution is the predicted serum PFAS distribution of a modeled female population at age 40 with lifetime exposure to 20 ng/L PFAS in drinking water. Breastfeeding duration was set to 6 months for the male population. The only difference between modeling male and female populations is the contribution from “background”, which is higher for males than females for most PFAS [Supplementary Table 5]; no other model parameters differ by sex.
We performed a local sensitivity analysis to assess how comparable shifts in select input parameters affect predicted 50th and 90th percentile serum concentrations using the output for six-month-old exclusively breast-fed male infants. For the sensitivity analysis, we used the 35,000 values of each parameter drawn for the baseline model run. A comparable shift in the mean for each variable was determined first by expressing all variables on a normal scale with lognormally distributed variables log-transformed to approximate normality; then shifting the mean value up or down by one standard deviation, yielding a new mean for the distribution. Lognormal parameters were back-transformed to their original scale. Identical positions drawn from the original variable distribution were selected from the shifted distribution, and the model was re-run with each parameter shifted up or down by one standard deviation on the normalized scale. The relative change in 50th and 90th percentile values per standard deviation change in the input parameter is compared. This approach allows for consistent comparison of parameter influence across normal and lognormal distributions and avoids Monte Carlo sampling error while maintaining the probabilistic structure of the model.
Model evaluation
To assess performance, the model was used to predict serum PFAS concentrations for published data from studies of paired drinking water and serum PFAS concentrations and studies reporting late pregnancy maternal serum PFAS levels and infant serum PFAS levels. Only studies reporting sufficient information about exposure duration, population demographics, drinking water PFAS concentration(s), and serum PFAS concentrations in the study population could be used to reconstruct a scenario for input into the model. Five suitable studies reporting results from nine populations of adults and older children were used in this evaluation[35,60-63]. The modeling scenarios for each cohort, including drinking water PFAS concentrations and exposure durations, are described in the Supplementary Table 7.
The second type of study used for model evaluation reported late pregnancy maternal serum PFAS levels and infant serum PFAS levels. Two suitable studies were identified[64,65]. The distribution of maternal late pregnancy PFAS levels was directly entered into the model, and measured infant PFAS concentrations at 6 months were compared to model-predicted results. Details on the infant populations along with the modeled scenario for each study are described in the Supplementary Table 8.
All evaluation scenarios were run with 35,000 Monte Carlo iterations to produce the model-predicted population distribution of serum PFAS levels. Summary statistics for serum PFAS levels reported for the study population were compared with the corresponding summary statistic or percentile from the modeled distribution of serum PFAS levels. For studies that reported a minimum or maximum measured concentration, these values were compared to the 5th and 95th percentiles of the modeled distribution, respectively. All studies reported at least one central tendency (median or GM) and upper percentile value (maximum, 90th, or 95th percentile).
Model performance was considered good when predicted serum concentrations fell within 2-fold of the observed values, a criterion that has been used to assess the performance of other PFAS TK models[44,66]. Root mean square error (RMSE) was calculated for the modeled vs. measured summary statistics for each study and was used to evaluate the relative performance of the model for different PFAS and at different percentiles, among other comparisons. A lower RMSE indicates a better fit between predicted and measured serum PFAS concentrations.
Estimation of Clinical Guidance-based Water Concentrations
The population PFAS TK model was implemented to estimate population lifetime drinking water concentrations corresponding to the NASEM clinical action level of 20 ng/mL, where additional health screening is recommended[42] for each of the six PFAS (PFOA, PFOS, PFHxS, PFNA, PFDA, PFHpA) regulated in MA. The drinking water concentration corresponding to the NASEM clinical action level is termed the Clinical Guidance-based Water Concentration (CGWC). The CGWC provides an indication of lifetime drinking water exposure levels where enhanced clinical action could be recommended. Consistent with public health approaches, we made choices in the modeling scenario (described below) to calculate health-protective CGWCs, including for sensitive populations, based on an upper-end estimate of the relationship between drinking water and serum levels; the modeling scenario was not designed to estimate the median CGWC for the US population.
We calculated CGWC for a sensitive population of breastfed infants and also calculated adult values for comparison. Infants are a sensitive population because (1) we expect infants to have higher internal serum concentrations than adults at the same drinking water exposure due to high body weight-adjusted liquid intake relative to adults [Supplementary Table 4]; and (2) infants have increased susceptibility to the adverse effects of PFAS at this life stage[45,67-70]. The higher likelihood of both exposure and adverse health effects makes the CGWC particularly relevant for infants. Calculating CGWC for adult populations as well enables a comparison of differences between general population estimates and estimates for sensitive populations.
The infant population we selected for modeling is breastfed male infants. Due to efficient transfer from breast milk for some PFAS, breastfed infants have higher exposure than formula-fed infants; thus, using modeled breastfed infants is also protective of formula-fed infants. While breastfed infants are predicted to have higher serum PFAS levels than bottle-fed infants, breastfeeding remains important for the development of the child. We modeled male infants because the mean and GSD “background” for male children is higher than corresponding female values for most modeled PFAS [Supplementary Table 5]. As a result, drinking water concentrations corresponding to clinical action levels for breastfed male infants produce an estimate that is protective of female and formula-fed infants.
Using these two defined populations - breastfed male infants and male adults - we determined the relationship between drinking water and serum PFAS levels by modeling the population distribution of serum PFAS levels for each PFAS over a series of constant drinking water concentrations between 4 and
We then fit a linear regression model to the 50th and 90th percentiles of the output population serum PFAS distributions with drinking water as the predictor variable. This produced two linear regression models for each population: one describing the relationship between drinking water and 50th percentile serum PFAS concentrations and the second describing the relationship between drinking water and 90th percentile serum PFAS concentrations. We used these regression models to calculate the drinking water serum concentration predicted to result in a serum level of 20 ng/mL at the 50th percentile of the distribution and at the 90th percentile of the distribution.
We defined CGWCs as the PFAS drinking water concentration predicted to result in the 90th percentile of a modeled population’s serum reaching the NASEM 20 ng/mL clinical action level. We selected the 90th percentile to align with standard USEPA practice for calculating enforceable drinking water standards using 90th percentile drinking water ingestion rates[40,71].
CGWCs were calculated separately for PFOA, PFOS, PFHxS, PFNA, PFDA, and PFHpA. The NASEM clinical guidelines apply to the sum of seven PFAS regularly monitored in NHANES which does not include PFHpA (though PFHpA has been monitored previously in NHANES). We chose to extend the NASEM guidelines to PFHpA because the NASEM report indicates that the additive approach could be expanded to apply to additional PFAS[42] and PFHpA health outcomes overlap with outcomes observed for some of the NASEM PFAS, which is the justification for its inclusion in state-specific drinking water regulations[13].
The NASEM clinical guidelines apply to the sum of seven PFAS measured in serum. Cumulative risk could be evaluated using the chemical-specific CGWC by applying mixture assessment methods based on chemical additivity such as the hazard index (HI) approach[72,73]. A HI can be calculated using Equation (4), by dividing the measured water concentration of each PFAS (DWCPFAS) by the CGWC for each PFAS (CGWCPFAS)[72]. A HI equal to or greater than one (1) indicates that the sum of the predicted serum PFAS concentrations exceeds the NASEM clinical action level of 20 ng/mL.
Where:
HI is the hazard index,
DWCPFAS is the measured concentration for each PFAS, and
CGWCPFAS is the PFAS-specific Clinical Guidance-based Water Concentration.
RESULTS AND DISCUSSION
Predicting key changes in serum PFAS concentrations over time
Model-predicted population serum PFAS concentrations change over time based on chemical-specific parameters and age-specific exposure factors [Figure 2]. For all six PFAS, model predictions show serum concentrations rise sharply by a factor of 2-5 between birth and 6 months due to high PFAS levels in breast milk and high liquid intake relative to body weight [Supplementary Table 9 and Supplementary Figure 2]. With lifetime drinking water exposure at 20 ng/L, breast milk concentrations are 2-6 times higher than the drinking water concentration for PFOA, PFOS, PFHxS and PFDA, and similar to the drinking water concentration for PFNA and PFHpA at the median of the distribution [Supplementary Table 9]. As a result, the median modeled infant serum PFAS concentrations after 6 months of exclusive breastfeeding are 1.2-3 times higher than the median modeled maternal serum PFAS concentrations [Supplementary Table 9]. Sensitivity analysis results indicate that infant serum concentrations are most influenced by maternal serum levels, breast milk intake rate, volume of distribution, and lactational transfer. Similar patterns are observed for all six PFAS at both the median and 90th percentile of the distribution [Supplementary Figure 3].
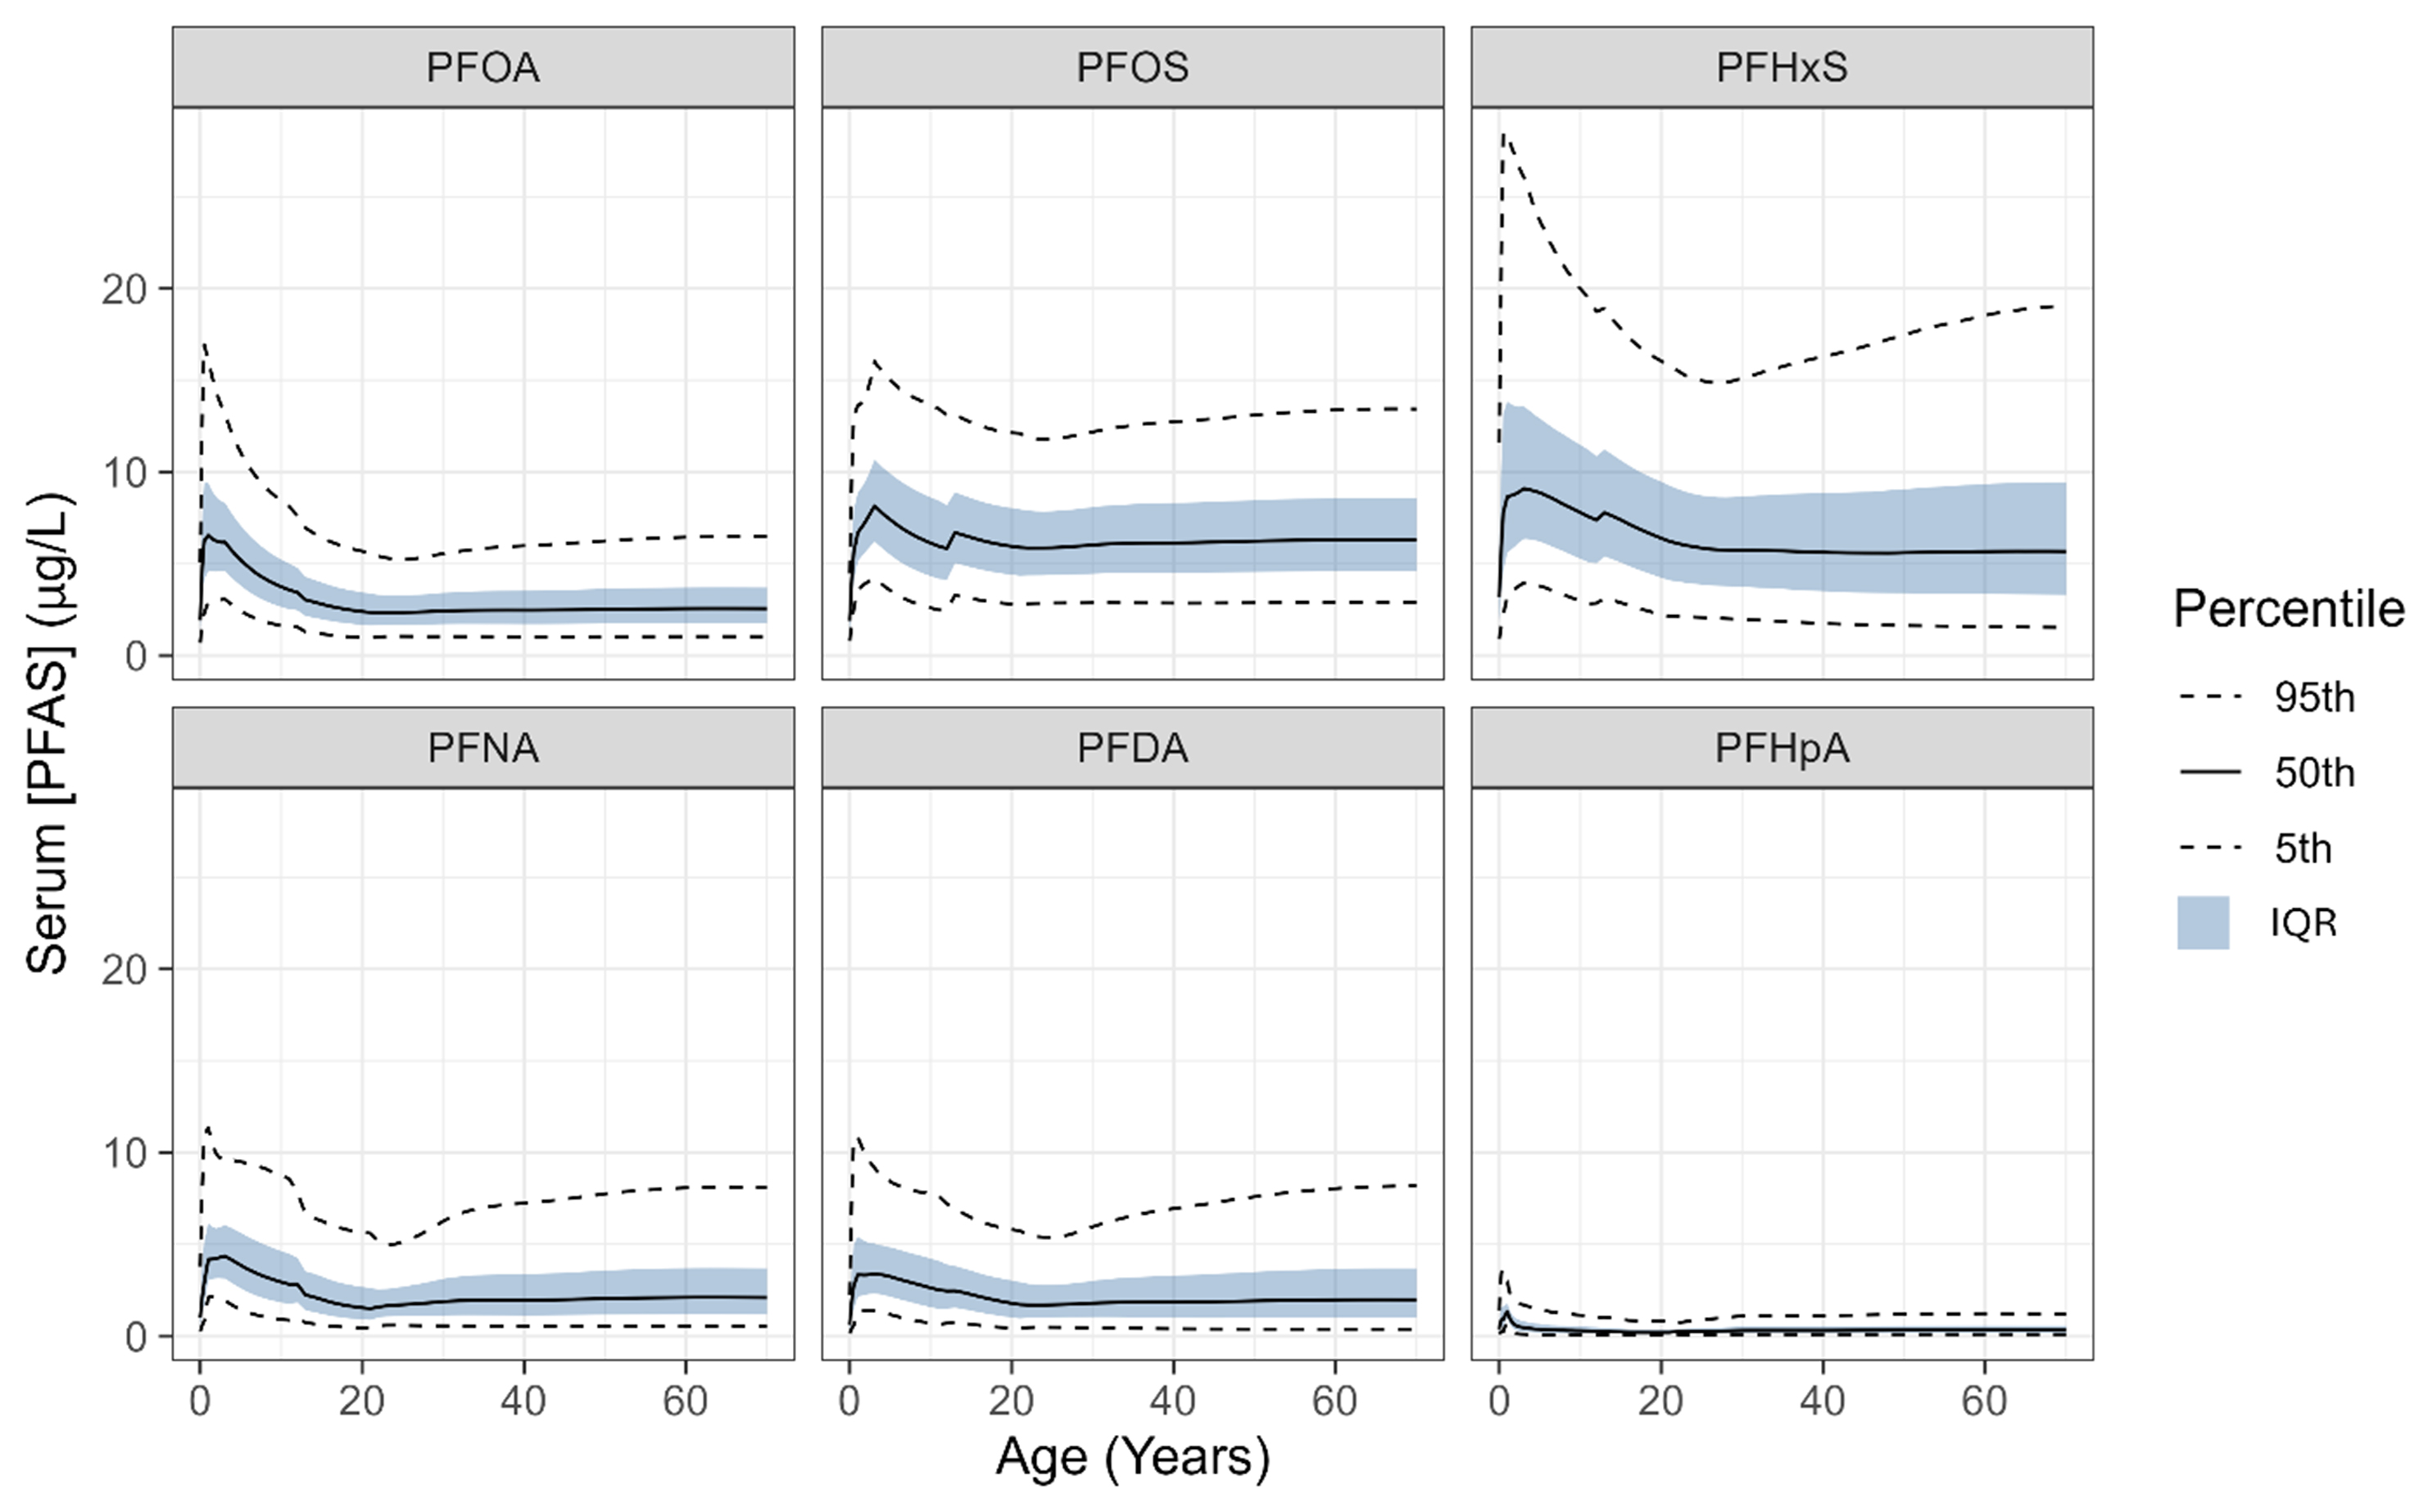
Figure 2. Serum PFAS concentrations modeled over time with constant exposure to 20 ng/L PFAS in drinking water. This modeled male population was breastfed for six months; maternal exposure is from a modeled population of 40-year-old women [Supplementary Table 6]. Lifetime drinking water exposure for both maternal and breastfed male populations was set at 20 ng/L PFAS in drinking water. PFAS: Per- and polyfluoroalkyl substances; PFOA: perfluorooctanoic acid; PFOS: perfluorooctanesulfonic acid; PFHxS: perfluorohexanesulfonic acid; PFNA: perfluorononanoic acid; PFDA: perfluorodecanoic acid; PFHpA: perfluoroheptanoic acid; IQR: interquartile range.
Peak serum concentrations for all six PFAS occur within the first 3 years of life [Figure 2]. After this peak, serum PFAS concentrations decline as the declining body weight-adjusted drinking water intake reduces exposure [Supplementary Figure 2]. Key trends in modeled lifetime serum PFAS concentrations, including peak concentrations in early life, have been observed in both epidemiological and TK modeling studies. Longitudinal epidemiological studies measuring early life serum concentrations show trajectories similar to the modeled lifetime trajectory, with PFOA, PFOS, PFNA, and PFDA generally increasing during the first 6-11 months followed by decreases at later timepoints[64,74]. For PFHxS, findings differ across studies: one reported increasing concentrations between birth and 6 months, followed by decreases[64], while another observed declining concentrations after birth[74].
Additional evidence indicates that early life serum concentrations of PFOA, PFOS, PFHxS, and PFNA are significantly higher than those measured in mid- and late childhood[75]. The early life increase observed for most PFAS corresponds to the nursing period[64,74], indicating that breastfeeding is an important exposure pathway in early life. Consistent with this interpretation, multiple studies have reported positive associations between breastfeeding duration and PFAS concentrations in infants and children, especially for PFOS and PFOA[64,74-78]. TK models similarly predict peak serum concentrations of PFOA, PFOS, and PFHxS within the first 1-2 years of life for both breastfed and formula-fed infants, with the latter peak resulting from high body weight-adjusted drinking water intake for young children[18,49]. In addition to these temporal trends, some studies report changes in population variability similar to the lifetime trajectory modeling. One longitudinal epidemiological study measuring serum PFOA, PFOS, PFHxS, and PFNA concentrations between ages 1-10.5 observed decreasing variability in the distribution of measured concentrations over time along with decreasing median concentrations[75]. Together, these findings support the ability of the population PFAS TK model to capture both temporal trends in serum PFAS concentrations over time and changes in population-level exposure factors during sensitive life stages.
Evaluating model performance
The population PFAS TK model performed well in predicting the distribution of population serum concentrations reported in empirical studies with paired drinking water and serum data for the six modeled PFAS, across exposure levels spanning 3-4 orders of magnitude [Figure 3]. Modeled central tendency and upper percentile serum PFAS concentrations mostly fell within two-fold error of the observed concentrations reported in each study. When results were combined for all PFAS and modeled study populations, RMSE values were similar for predictions of both central tendency and upper percentile values from the observed serum PFAS distributions [Figure 3A and B]. The comparable predictive performance at the center and upper percentiles of the distribution indicates the model captures population variability in TK and exposure factor parameters.
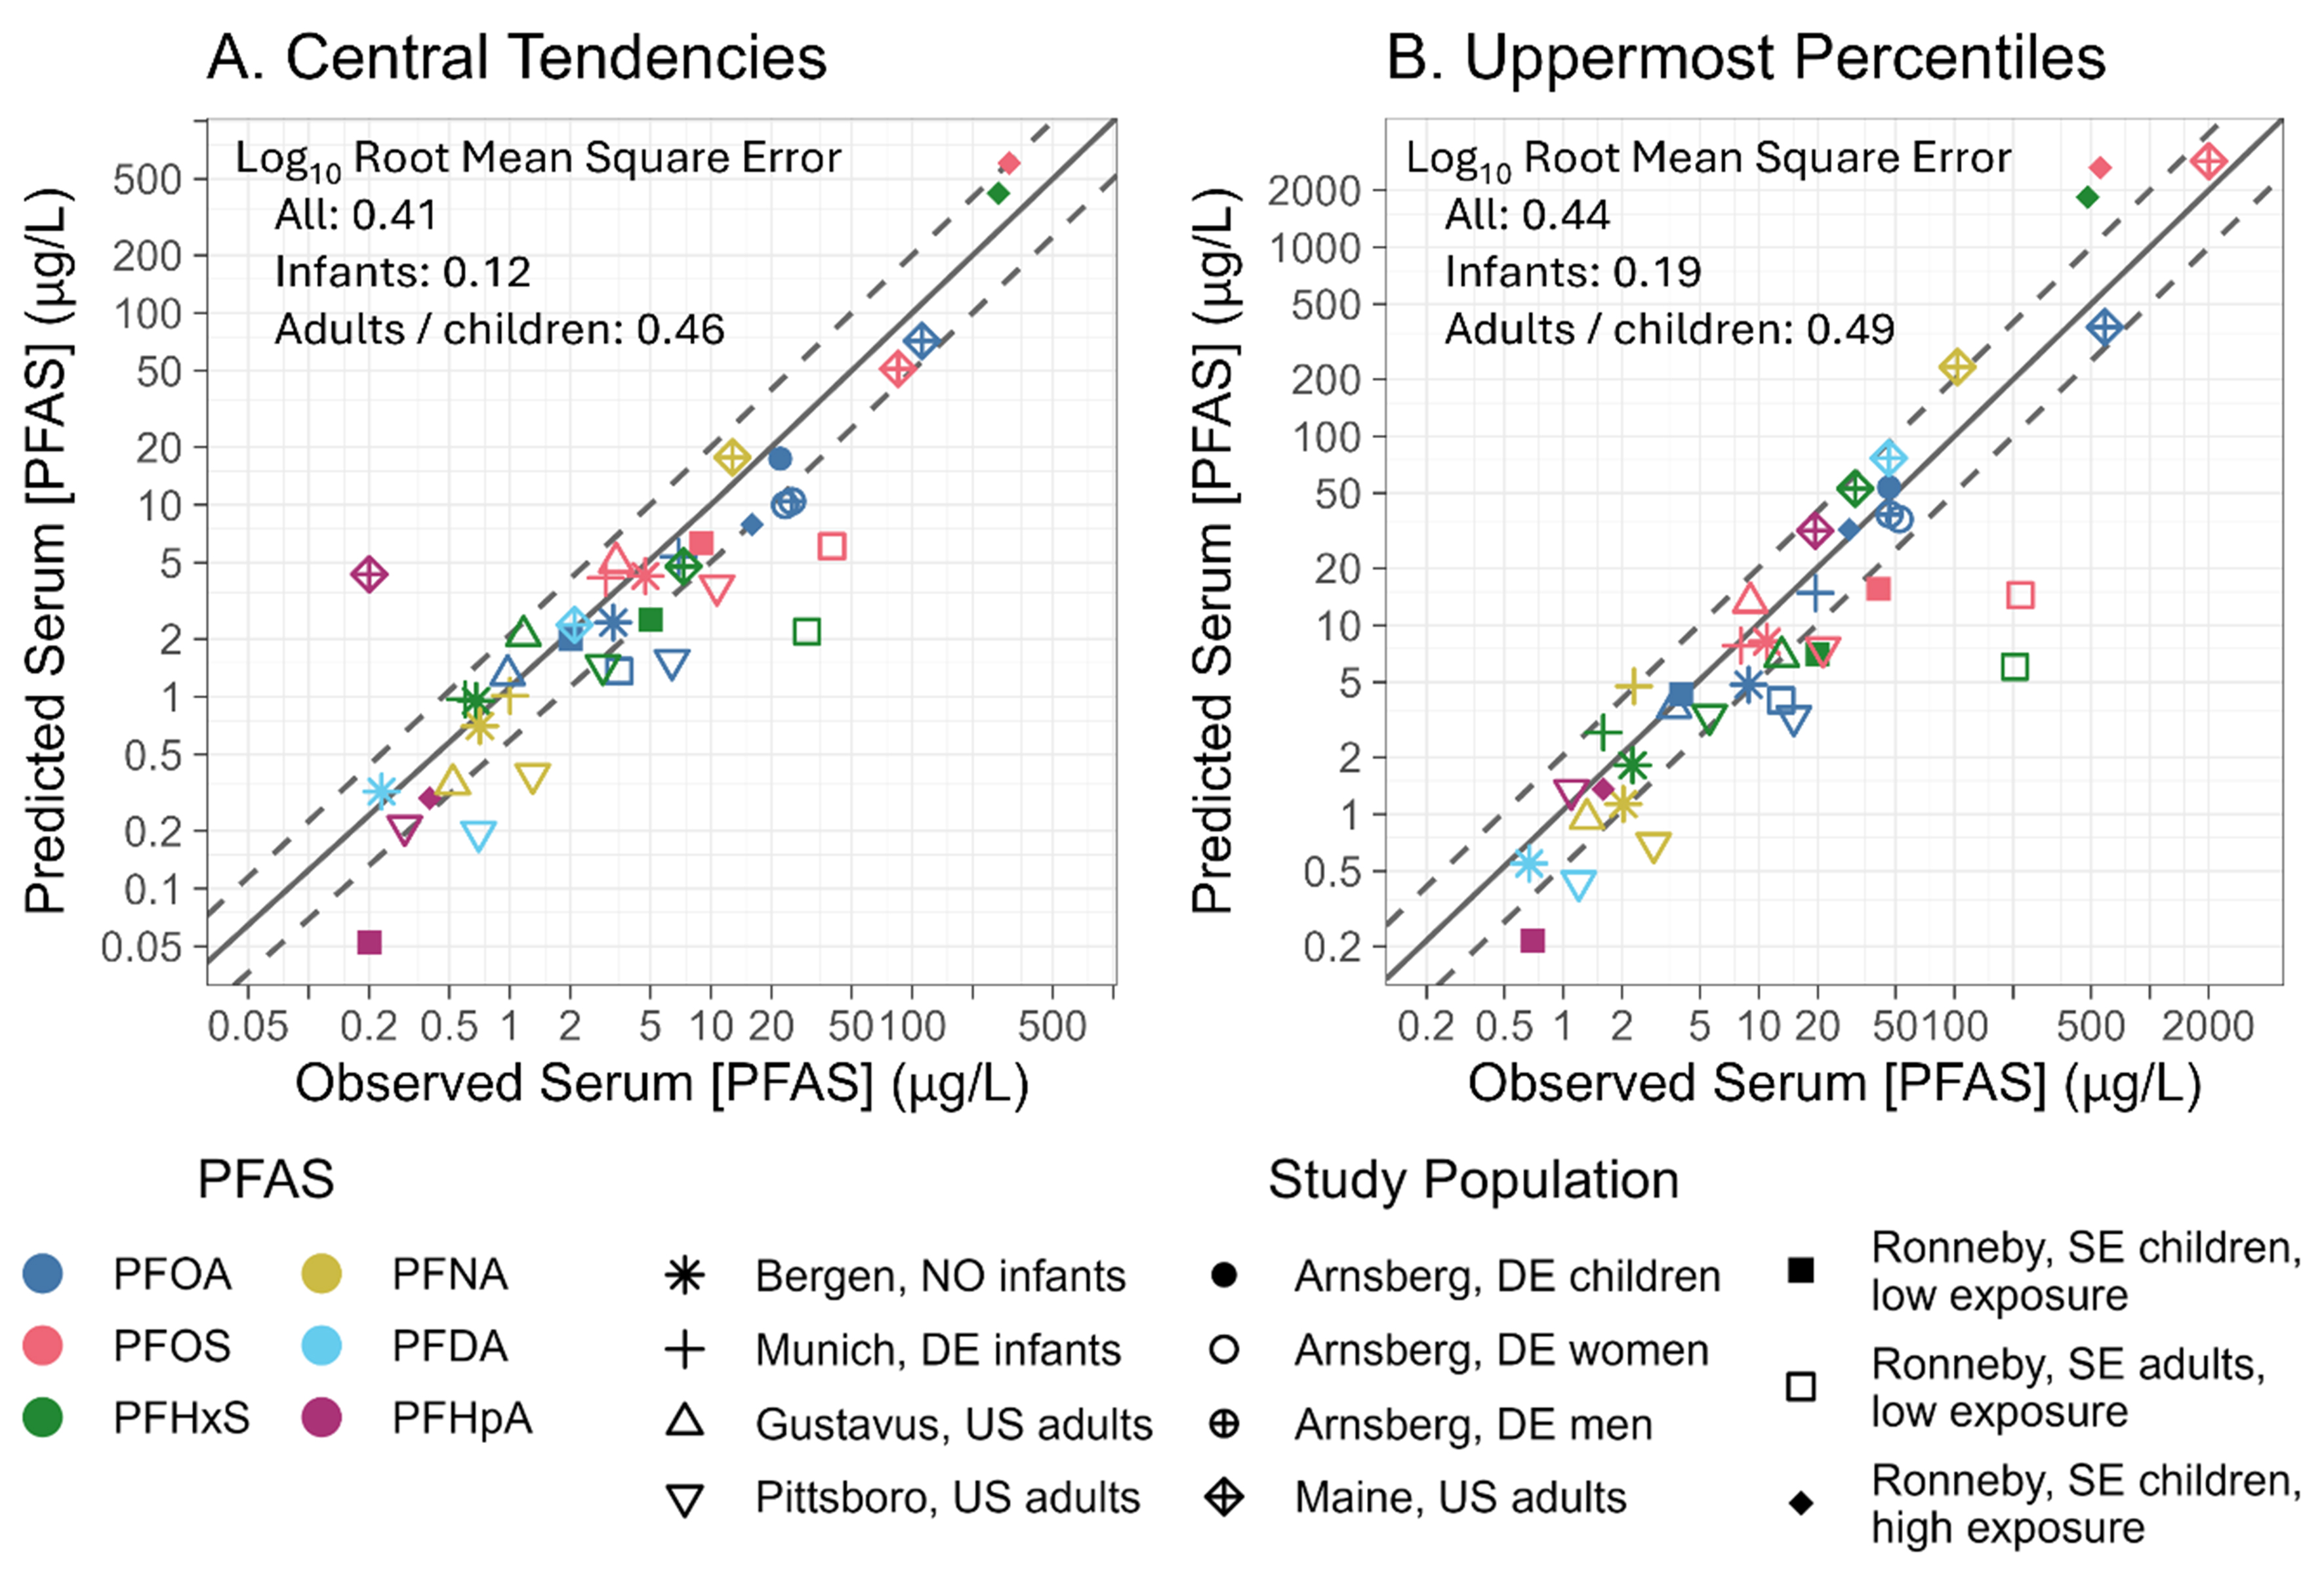
Figure 3. Goodness of fit model evaluation results for (A) central tendency values and (B) upper percentile values on log scale axes. Central tendency values are medians or GMs. Upper percentile values are 90th or 95th percentiles or study maxima. Modeling exposure scenarios are described in Supplementary Tables 7 and 8. The dashed line shows a two-fold difference from the solid line of equality. For points above the line of equality, the model overpredicts the empirical data. For points below the line of equality, the model underpredicts the empirical data. For each data point, the color corresponds to the PFAS and the shape corresponds to the Study Population. GMs: Geometric means; PFAS: per- and polyfluoroalkyl substances; PFOA: perfluorooctanoic acid; PFNA: perfluorononanoic acid; PFOS: perfluorooctanesulfonic acid; PFDA: perfluorodecanoic acid; PFHxS: perfluorohexanesulfonic acid; PFHpA: perfluoroheptanoic acid; NO: Norway; DE: Germany; US: United States of America; SE: Sweden.
Less human TK data are available for PFNA, PFDA, and PFHpA, and data gaps for these chemicals were filled with a combination of data from animal studies, read-across from other PFAS, and imputation in the case of breastmilk elimination rate constants for PFNA and PFDA, as described in the methods. Overall, model error was not consistently higher for PFAS with more limited human TK data compared with data-rich PFAS. For example, imputed breast milk elimination rate constants for PFNA and PFDA, combined with less available data on breast milk transfer factors, did not result in consistently higher model prediction error for these PFAS. PFHpA, which has the least human TK information among the six modeled PFAS, showed the highest model error at central tendency values but comparable error to the data-rich PFAS at the upper percentile values [Supplementary Table 10]. These results suggest that the methods used to address PFAS-specific TK data gaps, especially for modeling infant exposure, can capture population-level TK for comparatively data-poor chemicals. However, serum PFAS distributions for compounds with less certain TK parameters are associated with greater modeling uncertainty because both the central estimates and variability of the input parameters are less well-characterized. In contrast, for PFAS with TK parameter distributions informed by human data, the resulting serum distribution is more representative of human variability and therefore associated with less uncertainty. Additional sources of uncertainty intrinsic to the model include the application of a single T1/2 distribution for modeling all populations, including the single-sex populations from Arnsberg, DE, and uncertainty in exposure factors used for modeling.
Model error was lower for infant populations than for adults and older children across PFAS and at both the central tendency and upper percentiles of the distribution [Figure 3A and B, Supplementary Table 10]. For infant modeling scenarios, maternal serum PFAS concentrations are the exposure input that dictates the starting infant serum PFAS concentrations and the exposure via breast milk for exclusively breastfed infants. The availability of more complete exposure information and shorter modeled time periods for infant populations likely contributed to reduced model error.
Model accuracy depends on both an accurate reconstruction of the exposure scenario used for evaluation and the accuracy of the TK parameters and exposure factors used in the model. In addition to intrinsic model uncertainties discussed above, incomplete or inaccurately captured exposure information from sources including drinking water concentrations, exposure duration, and background exposure can contribute to discrepancies between predicted and observed concentrations.
For example, the model underpredicts empirical data from two study populations - the Ronneby, SE low exposure cohort and the Pittsboro, US cohort - at both the central tendencies and upper percentiles from the observed serum PFAS distributions. Uncertainty in reconstructing the exposure scenarios likely contributed to these discrepancies. For the Pittsboro, US cohort, lifetime drinking water exposure was modeled using constant PFAS concentrations reported in the study. However, PFAS concentrations in the Haw River, which serves as the drinking water source for the Pittsboro, US cohort, have varied substantially over time[62,79].
Similarly, for the adult population modeled from Ronneby, SE, the potential underestimation of exposure combined with the long modeling timeframe may have contributed to model underprediction. In Ronneby, one drinking water source was highly contaminated with PFAS (up to 8,000 ng/L for PFOS) while another source had exposure levels several orders of magnitude lower[35]. Although the evaluation cohort resided in areas served by the lower-exposure source, their proximity to areas supplied by the highly contaminated water source raises the possibility of unaccounted exposure through consumption of contaminated water or other exposure pathways not captured in the modeling scenario. Beyond the scenario-specific uncertainties addressed above, the use of 2017-2018 and 2013-2014 NHANES data for adults and children, respectively, for all modeling scenarios could contribute additional uncertainty, especially when modeling historical exposures. Importantly, the flexible model inputs that accommodate temporal and concentration variability over time in drinking water and background serum PFAS levels, among other inputs, allow for the reconstruction of complex historical exposures.
Relationship between modeled drinking water and serum concentrations
The population PFAS TK model was applied to estimate CGWC for the sensitive population of breastfed infants. Adult values were also calculated for comparison.
Figure 4 shows the relationship between increasing drinking water PFAS concentrations and the 90th percentile serum PFAS concentrations for six-month-old, exclusively breastfed infants. For this population, drinking water concentrations determine the distribution of maternal serum PFAS concentrations, which in turn define both the starting point for infant serum PFAS levels and PFAS concentrations in breast milk. For all six PFAS, increasing drinking water concentrations produced a linear increase in modeled serum concentrations.
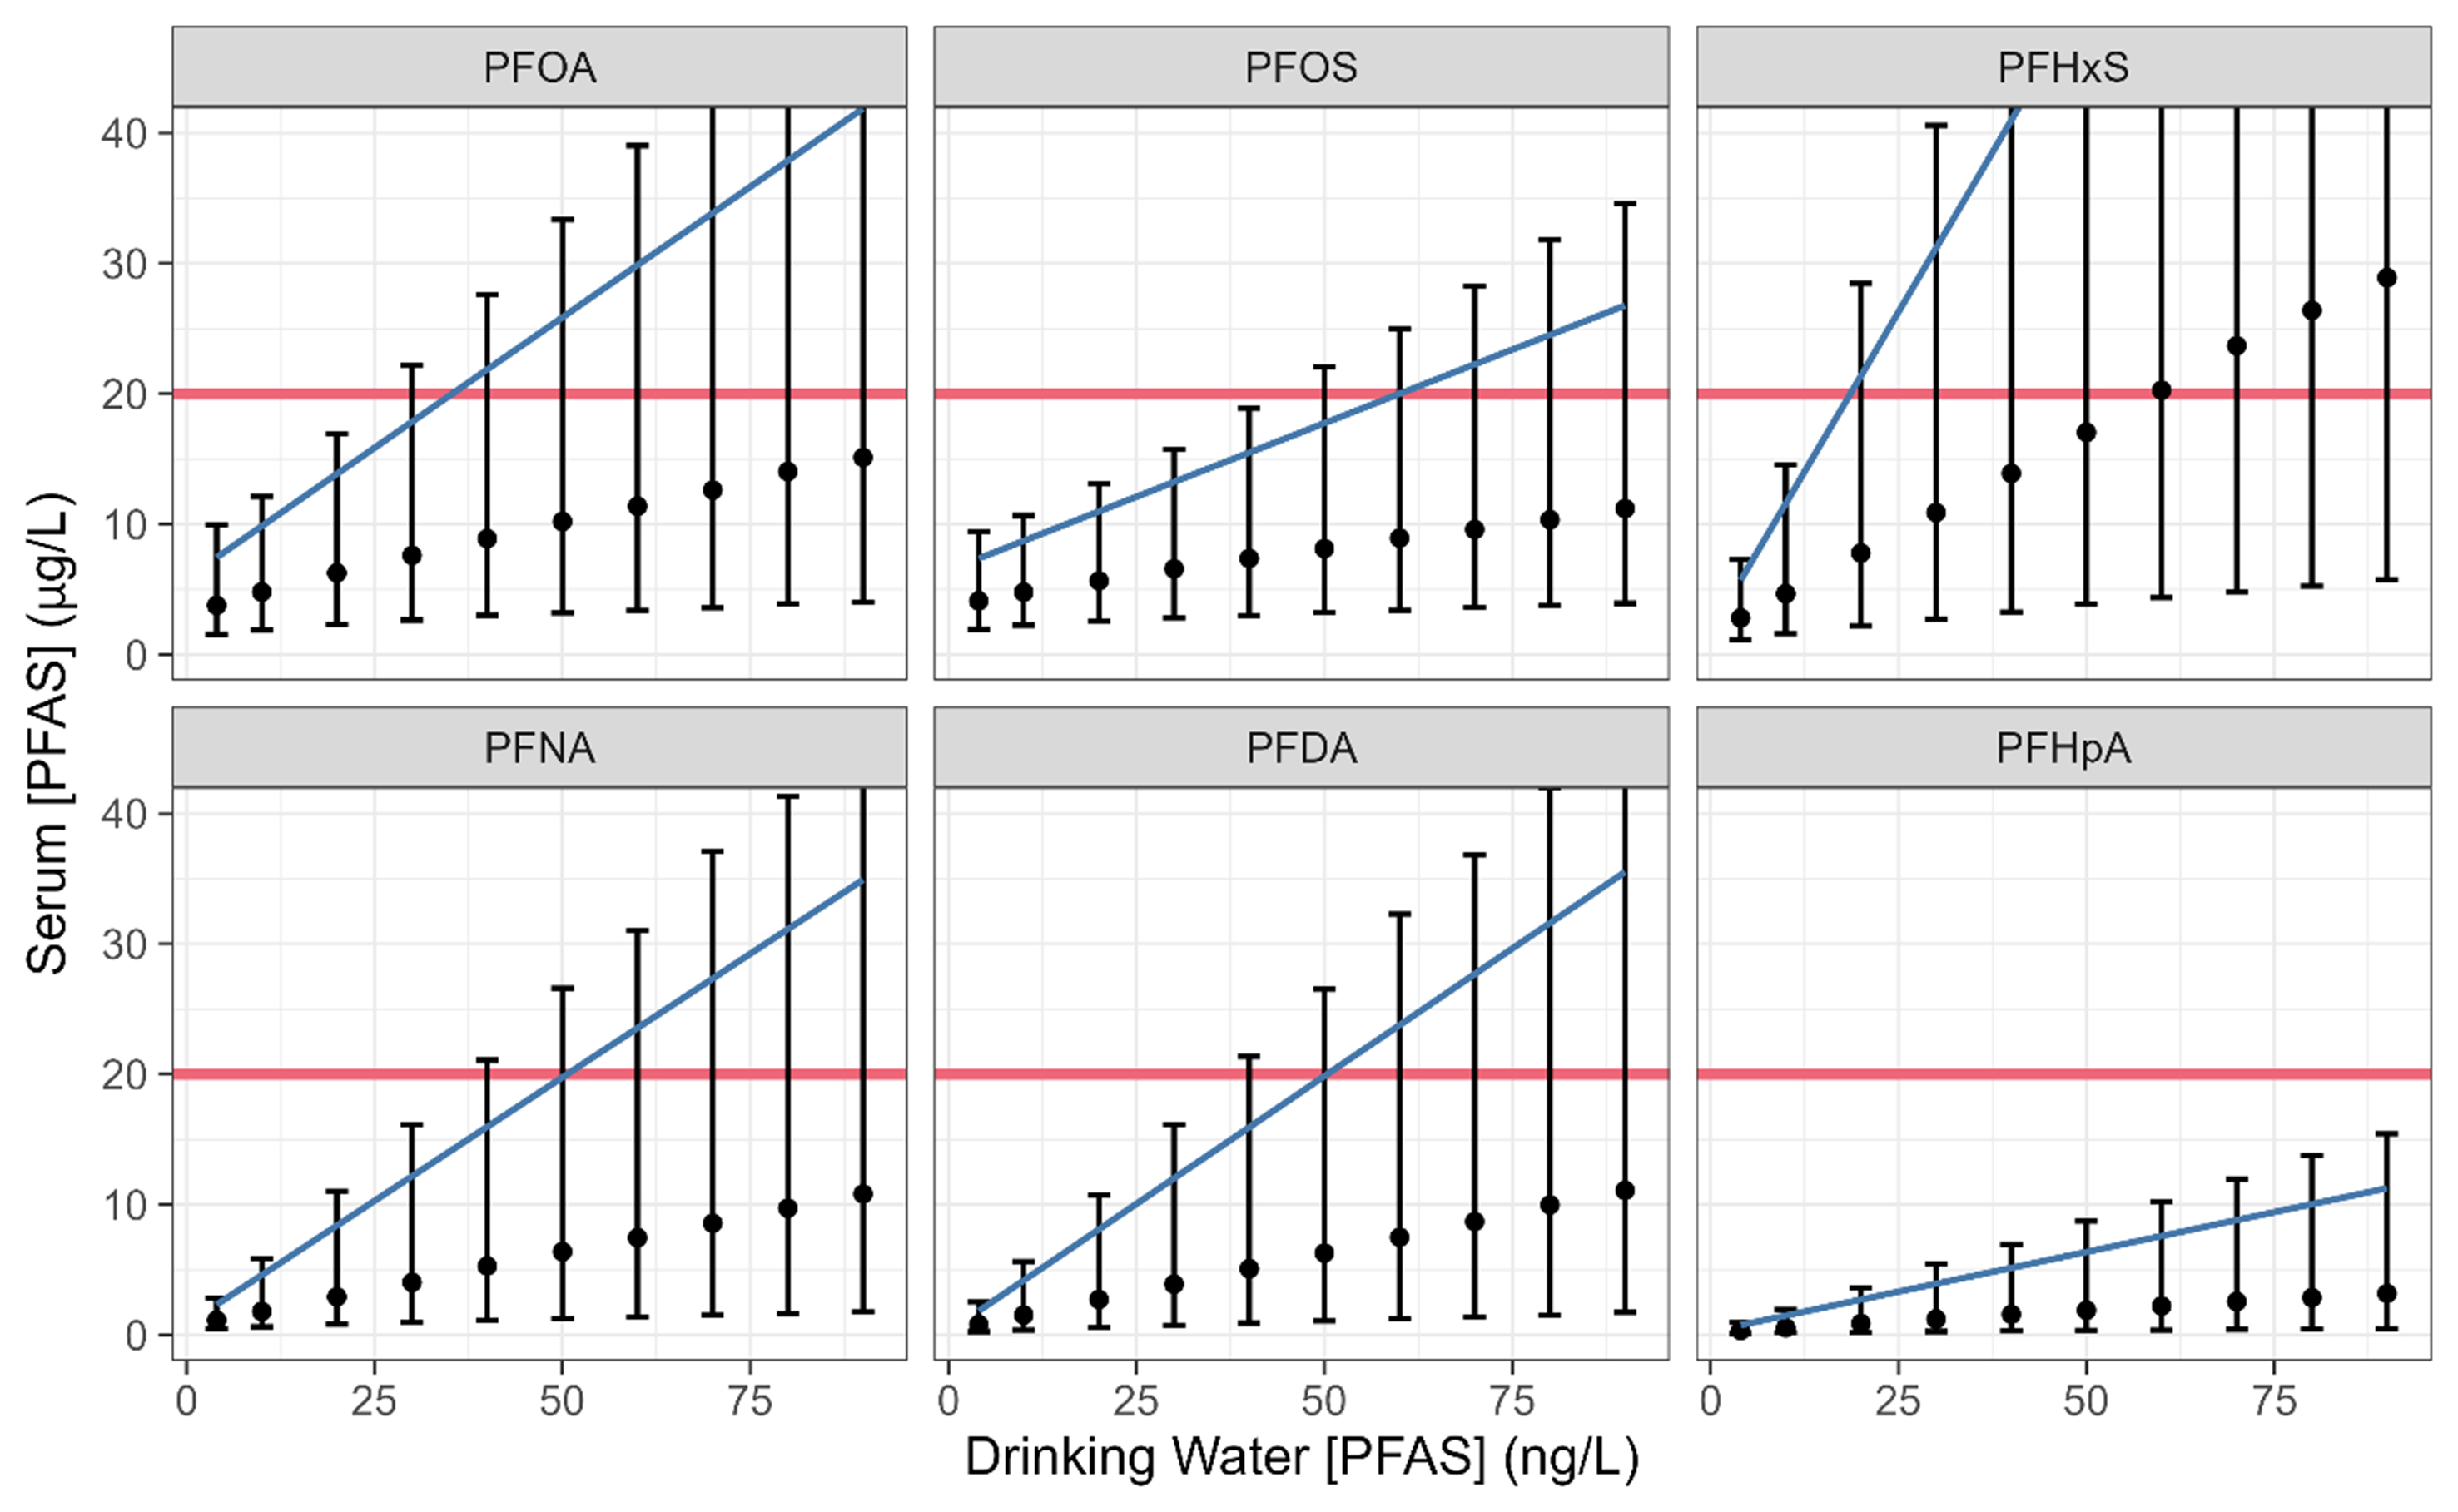
Figure 4. Model-predicted serum concentrations for 6-month-old, exclusively breastfed infants for a suite of PFAS at varying maternal drinking water exposure levels. The stated drinking water concentration determines maternal serum PFAS concentrations and breast milk concentrations. Vertical black lines are the modeled distribution of serum PFAS concentrations at each drinking water exposure level, with the median shown as a point and the horizontal bars showing the 5th and 95th percentiles. The blue regression line depicts the linear relationship at the 90th percentile of predicted serum values. The red horizontal line shows the NASEM 20 ng/mL clinical action level. PFAS: Per- and polyfluoroalkyl substances; NASEM: National Academies of Sciences, Engineering, and Medicine; PFOA: perfluorooctanoic acid; PFOS: perfluorooctanesulfonic acid; PFHxS: perfluorohexanesulfonic acid; PFNA: perfluorononanoic acid; PFDA: perfluorodecanoic acid; PFHpA: perfluoroheptanoic acid.
The slope of the regression line at the 50th and 90th percentiles of the population serum distribution for infants and adults derived using this model compared with literature values are shown in Table 2. These slopes are the change in serum PFAS concentration (μg/L) per one ng/L increase in drinking water PFAS concentration. Comparing model-derived slopes for the six modeled PFAS, differences in slope across chemicals highlight the importance of elimination half-life for the relationship between drinking water exposure and serum levels in breastfed infants: PFHxS with the longest half-life has a large regression coefficient while PFHpA with the shortest half-life has the smallest.
Modeled slope for the relationship between drinking water and population serum PFAS levels compared with literature values
| PFAS | Modeled regression coefficients (slope) | Literature regression coefficients or serum:water ratiosa | ||||||
| Median (infant) | Median (adult male) | 90th Percentile (infant) | 90th Percentile (adult male) | Minimum | Median | Maximum | Number of studies (number of values)b | |
| PFOA | 0.13 | 0.048 | 0.40 | 0.14 | 0.03 | 0.10 | 0.25 | 10 (22) |
| PFOS | 0.081 | 0.073 | 0.23 | 0.19 | 0.03 | 0.10 | 0.35 | 3 (9) |
| PFHxS | 0.31 | 0.20 | 0.98 | 0.53 | 0.05 | 0.12 | 0.52 | 3 (8) |
| PFHpA | 0.033 | 0.011 | 0.12 | 0.039 | 0.001 | 0.005 | 0.035 | 3 (8) |
| PFNAc | 0.11 | 0.077 | 0.38 | 0.25 | - | - | - | 1 |
| PFDAc | 0.12 | 0.081 | 0.39 | 0.25 | - | - | - | 1 |
The relationship between drinking water and serum PFAS concentrations has been investigated using a variety of methods in empirical studies. Regression analyses using either measured data[33,80,81] or modeled data[82] to relate drinking water and serum PFAS concentrations can control for potentially confounding variables such as age and sex. Another approach is to calculate the serum-to-water ratio from empirical data[83-86], or similar relationships predicted with TK modeling[39,87] enabling examination of the distribution of serum to water ratios across a study population. Both regression analysis and serum-to-water ratios yielded similar interpretations, showing an estimated increase in serum PFAS concentrations for each unit increase in drinking water PFAS concentration, providing some comparability to the slope derived from the regression analysis from the TK modeling in this work.
The median and maximum of available literature regression coefficients for PFOA, PFOS, PFHxS, and PFHpA were within 2-fold of the regression coefficients at the median and 90th percentile modeled for adult male populations in this study [Table 2]. For the regression coefficients in infant populations, regression coefficients at the median and 90th percentile were similarly within 2-fold of literature-reported values for PFOA and PFOS, and were larger than literature-reported values for PFHxS and PFHpA. The single available literature regression coefficients for PFNA and PFDA may be biased by methods to impute data points below limits of detection[80]; regression coefficients at the median of the adult male population modeled for this study were higher for both chemicals. Despite the methodological variability in literature-based values, modeled regression coefficients from this analysis were overall similar to those reported in the literature for multiple PFAS. While literature approaches provide useful empirical summaries of the relationship between drinking water and serum concentrations, they do not explicitly represent the combined effects of life-stage-specific exposure pathways and interindividual variability in TK parameters. By contrast, the population PFAS TK model framework used here integrates these factors to estimate how drinking water exposure translates into population distributions of serum PFAS concentrations over time.
Predicting CGWCs for PFAS
The linear regression equation from the relationship between drinking water and serum PFAS concentrations at the 90th percentile of the distribution was used to calculate the CGWC for breastfed infants and adults. The CGWC is defined as the drinking water concentration for each PFAS predicted to result in 90th percentile serum concentrations reaching the NASEM clinical action level of 20 ng/mL.
Table 3 shows the PFAS CGWCs calculated for each PFAS for breastfed infants and adults. CGWCs are lower for breastfed infants than adults for all PFAS. For both populations, PFHxS has the lowest CGWC and PFHpA has the highest CGWC, underscoring the importance of chemical half-life in determining the relationship between drinking water exposure and serum PFAS levels.
Clinical Guidance-based Water Concentrations (CGWCs) for six PFAS
| PFAS | CGWC (ng/L, equivalent to ppt)a | |
| Age 6 monthsb | Age 40 yearsb | |
| PFOA | 35 | 125 |
| PFOS | 60 | 67 |
| PFHxS | 19 | 33 |
| PFNA | 51 | 77 |
| PFDA | 50 | 78 |
| PFHpA | 162 | 515 |
For comparison, we entered the PFOA CGWC into a recently revised, transgenerational PFOA TK model that takes deterministic TK parameters and exposure factors to calculate a reasonable maximum exposure scenario with a combination of central tendency and upper percentile values[49]. The projected serum concentrations at the CGWC under parallel exposure scenarios for infants and adults were 22.5 and
The CGWC for each PFAS in Table 3 could be used in Equation (4) to evaluate a mixture of PFAS concentrations in drinking water compared to the NASEM clinical action level of 20 ng/mL. CGWCs are not health-protective drinking water values but rather concentrations associated with elevated health risk sufficient to prompt clinical follow-up. The CGWC could be used as a screening tool for clinicians and regulatory agencies to screen for exposure scenarios where enhanced clinical action, health monitoring, and/or exposure interventions are warranted.
CONCLUSION
This population PFAS TK model provides a flexible tool to predict the relationship between drinking water and population serum levels for six PFAS. The model performed well in predicting the distribution of population serum concentrations reported in empirical studies with paired drinking water and serum data for the six modeled PFAS across 3-4 orders of magnitude of exposure. Potential model applications include reconstructing historical exposures, estimating the impact of drinking water regulations on human exposure and clinical metrics, assessing exposure interventions, and as a tool to support policy, regulatory, and clinical decision-making. By integrating population TK modeling with clinical guidance levels for PFAS in serum, this framework can help identify population exposure scenarios in which enhanced clinical action may be warranted. More broadly, this approach provides a quantitative link between drinking water - an important source of PFAS exposure - and clinical guidance, supporting more integrated evaluations of PFAS risks across environmental, regulatory, and public health contexts.
DECLARATIONS
Acknowledgements
The authors thank David R. Brown, Marissa Hauptman, Libby Levison, Elsie M. Sunderland, and Thomas F. Webster for their constructive comments on this body of work; Meghan T. Lynch for input on model development and evaluation; and Richard H. Spady for statistical advice and assistance.
Authors’ contributions
Made substantial contributions to conception and design of the revised model, model implementation, and interpretation: Nielsen, G.; Spady, E. S.; Moody, N. S.; Baird, S. J. S.; Heiger-Bernays, W.; Smith, C. M.
Drafted manuscript: Nielsen, G.
Developed model code: Spady, E. S.
All authors approved the final manuscript. Opinions expressed herein are those of the authors and do not represent the official position of the Massachusetts Department of Environmental Protection.
Availability of data and materials
Supporting information is available in the Supplementary Materials. The full model R code, ReadMe documentation, and model demo files are available as a zip file. User-defined inputs and model results underlying the results and conclusions in this paper are available upon reasonable request from the corresponding author.
AI and AI-assisted tools statement
Not applicable.
Financial support and sponsorship
None.
Conflicts of interest
All authors declared that there are no conflicts of interest.
Ethical approval and consent to participate
Not applicable.
Consent for publication
Not applicable.
Copyright
© The Author(s) 2026.
Supplementary Materials
REFERENCES
1. Glüge, J.; Scheringer, M.; Cousins, I. T.; et al. An overview of the uses of per- and polyfluoroalkyl substances (PFAS). Environ. Sci. Processes. Impacts. 2020, 22, 2345-73.
2. Calafat, A. M.; Wong, L.; Kuklenyik, Z.; Reidy, J. A.; Needham, L. L. Polyfluoroalkyl chemicals in the U.S. population: data from the National Health and Nutrition Examination Survey (NHANES) 2003-2004 and comparisons with NHANES 1999-2000. Environ. Health. Perspect. 2007, 115, 1596-602.
3. Nelson, J. W.; Hatch, E. E.; Webster, T. F. Exposure to polyfluoroalkyl chemicals and cholesterol, body weight, and insulin resistance in the general U.S. population. Environ. Health. Perspect. 2010, 118, 197-202.
4. Winquist, A.; Steenland, K. Modeled PFOA exposure and coronary artery disease, hypertension, and high cholesterol in community and worker cohorts. Environ. Health. Perspect. 2014, 122, 1299-305.
5. Schlezinger, J.; Hyötyläinen, T.; Sinioja, T.; et al. Perfluorooctanoic acid induces liver and serum dyslipidemia in humanized PPARα mice fed an American diet. Toxicol. Appl. Pharmacol. 2021, 426, 115644.
6. Ward-Caviness, C. K.; Moyer, J.; Weaver, A.; Devlin, R.; Diaz-Sanchez, D. Associations between PFAS occurrence and multimorbidity as observed in an electronic health record cohort. Environ. Epidemiol. 2022, 6, e217.
7. Nian, M.; Li, Q.; Bloom, M.; et al. Liver function biomarkers disorder is associated with exposure to perfluoroalkyl acids in adults: isomers of C8 Health Project in China. Environ. Res. 2019, 172, 81-8.
8. Baumert, B. O.; Maretti-Mira, A. C.; Walker, D. I.; et al. Translational framework linking perfluoroheptanoic acid (PFHpA) exposure to metabolic dysfunction associated steatotic liver disease in adolescents. Commun. Med. 2025, 5, 430.
9. Sagiv, S. K.; Rifas-Shiman, S. L.; Fleisch, A. F.; et al. Early-pregnancy plasma concentrations of perfluoroalkyl substances and birth outcomes in project Viva: confounded by pregnancy hemodynamics? Am. J. Epidemiol. 2018, 187, 793-802.
10. Wikström, S.; Lin, P.; Lindh, C. H.; Shu, H.; Bornehag, C. Maternal serum levels of perfluoroalkyl substances in early pregnancy and offspring birth weight. Pediatr. Res. 2019, 87, 1093-9.
11. Budtz-Jørgensen, E.; Grandjean, P. Application of benchmark analysis for mixed contaminant exposures: mutual adjustment of perfluoroalkylate substances associated with immunotoxicity. PLoS. ONE. 2018, 13, e0205388.
12. Zahm, S.; Bonde, J. P.; Chiu, W. A.; et al. Carcinogenicity of perfluorooctanoic acid and perfluorooctanesulfonic acid. Lancet. Oncol. 2024, 25, 16-7.
13. MassDEP. Per- and polyfluoroalkyl substances (PFAS): an updated subgroup approach to groundwater and drinking water values. 2019. https://www.mass.gov/doc/per-and-polyfluoroalkyl-substances-pfas-an-updated-subgroup-approach-to-groundwater-and/download. (accessed 2026-07-10).
14. Dewitt, J. C.; Blossom, S. J.; Schaider, L. A. Exposure to per-fluoroalkyl and polyfluoroalkyl substances leads to immunotoxicity: epidemiological and toxicological evidence. J. Expo. Sci. Environ. Epidemiol. 2018, 29, 148-56.
15. Kaye, E.; Marques, E.; Agudelo Areiza, J.; Modaresi, S. M. S.; Slitt, A. Exposure to a PFOA, PFOS and PFHxS mixture during gestation and lactation alters the liver proteome in offspring of CD-1 mice. Toxics 2024, 12, 348.
16. Appel, M.; Forsthuber, M.; Ramos, R.; et al. The transplacental transfer efficiency of per- and polyfluoroalkyl substances (PFAS): a first meta-analysis. J. Toxicol. Environ. Health. B. Crit. Rev. 2021, 25, 23-42.
17. Midasch, O.; Drexler, H.; Hart, N.; Beckmann, M. W.; Angerer, J. Transplacental exposure of neonates to perfluorooctanesulfonate and perfluorooctanoate: a pilot study. Int. Arch. Occup. Environ. Health. 2007, 80, 643-8.
18. Goeden, H. M.; Greene, C. W.; Jacobus, J. A. A transgenerational toxicokinetic model and its use in derivation of Minnesota PFOA water guidance. J. Expo. Sci. Environ. Epidemiol. 2019, 29, 183-95.
19. Kingsley, S. L.; Eliot, M. N.; Kelsey, K. T.; et al. Variability and predictors of serum perfluoroalkyl substance concentrations during pregnancy and early childhood. Environ. Res. 2018, 165, 247-57.
20. Van Beijsterveldt, I. A.; Van Zelst, B. D.; De Fluiter, K. S.; Van Den Berg, S. A.; Van Der Steen, M.; Hokken-Koelega, A. C. Poly- and perfluoroalkyl substances (PFAS) exposure through infant feeding in early life. Environ. Int. 2022, 164, 107274.
21. Zheng, G.; Schreder, E.; Dempsey, J. C.; et al. Per- and polyfluoroalkyl substances (PFAS) in breast milk: concerning trends for current-use PFAS. Environ. Sci. Technol. 2021, 55, 7510-20.
22. De Silva, A. O.; Armitage, J. M.; Bruton, T. A.; et al. PFAS exposure pathways for humans and wildlife: a synthesis of current knowledge and key gaps in understanding. Environ. Toxicol. Chem. 2021, 40, 631-57.
23. Deluca, N. M.; Minucci, J. M.; Mullikin, A.; Slover, R.; Cohen Hubal, E. A. Human exposure pathways to poly- and perfluoroalkyl substances (PFAS) from indoor media: a systematic review. Environ. Int. 2022, 162, 107149.
24. EFSA, Panel. on. Contaminants. in. the. Food. Chain. (EFSA. C. O. N. T. A. M. Panel).; Schrenk D. Risk to human health related to the presence of perfluoroalkyl substances in food. EFSA. J. 2020, 18, e06223.
25. Haug, L. S.; Thomsen, C.; Brantsæter, A. L.; et al. Diet and particularly seafood are major sources of perfluorinated compounds in humans. Environ. Int. 2010, 36, 772-8.
26. Vestergren, R.; Cousins, I. T. 12 - Human dietary exposure to per- and poly-fluoroalkyl substances (PFASs). In Persistent organic pollutants and toxic metals in foods. Woodhead Publishing; 2013. pp. 279-307.
27. Haug, L. S.; Huber, S.; Schlabach, M.; Becher, G.; Thomsen, C. Investigation on per- and polyfluorinated compounds in paired samples of house dust and indoor air from norwegian homes. Environ. Sci. Technol. 2011, 45, 7991-8.
28. Holder, C.; Cohen Hubal, E. A.; Luh, J.; Lee, M. G.; Melnyk, L. J.; Thomas, K. Systematic evidence mapping of potential correlates of exposure for per- and poly-fluoroalkyl substances (PFAS) based on measured occurrence in biomatrices and surveys of dietary consumption and product use. Int. J. Hyg. Environ. Health. 2024, 259, 114384.
29. Pennoyer, E. H.; Fillman, T.; Heiger-Bernays, W.; et al. Exposure to legacy per- and polyfluoroalkyl substances from diet and drinking water in California adults, 2018-2020. Environ. Sci. Technol. 2025, 59, 9896-906.
30. Hu, X. C.; Tokranov, A. K.; Liddie, J.; et al. Tap water contributions to plasma concentrations of poly- and perfluoroalkyl substances (PFAS) in a nationwide prospective cohort of U.S. women. Environ. Health. Perspect. 2019, 127, 067006.
31. Hurley, S.; Houtz, E.; Goldberg, D.; et al. Preliminary associations between the detection of perfluoroalkyl acids (PFAAs) in drinking water and serum concentrations in a sample of California women. Environ. Sci. Technol. Lett. 2016, 3, 264-9.
32. Shin, H.; Vieira, V. M.; Ryan, P. B.; Steenland, K.; Bartell, S. M. Retrospective exposure estimation and predicted versus observed serum perfluorooctanoic acid concentrations for participants in the C8 Health Project. Environ. Health. Perspect. 2011, 119, 1760-5.
33. Hoffman, K.; Webster, T. F.; Bartell, S. M.; Weisskopf, M. G.; Fletcher, T.; Vieira, V. M. Private drinking water wells as a source of exposure to perfluorooctanoic acid (PFOA) in communities surrounding a fluoropolymer production facility. Environ. Health. Perspect. 2011, 119, 92-7.
34. Graber, J. M.; Alexander, C.; Laumbach, R. J.; et al. Per and polyfluoroalkyl substances (PFAS) blood levels after contamination of a community water supply and comparison with 2013-2014 NHANES. J. Expo. Sci. Environ. Epidemiol. 2018, 29, 172-82.
35. Xu, Y.; Nielsen, C.; Li, Y.; et al. Serum perfluoroalkyl substances in residents following long-term drinking water contamination from firefighting foam in Ronneby, Sweden. Environ. Int. 2021, 147, 106333.
36. Daly, E. R.; Chan, B. P.; Talbot, E. A.; et al. Per- and polyfluoroalkyl substance (PFAS) exposure assessment in a community exposed to contaminated drinking water, New Hampshire, 2015. Int. J. Hyg. Environ. Health. 2018, 221, 569-77.
37. Landsteiner, A.; Huset, C.; Johnson, J.; Williams, A. Biomonitoring for perfluorochemicals in a Minnesota community with known drinking water contamination. J. Environ. Health. 2014, 77, 14-9.
38. Cserbik, D.; Casas, M.; Flores, C.; et al. Concentrations of per- and polyfluoroalkyl substances (PFAS) in paired tap water and blood samples during pregnancy. J. Expo. Sci. Environ. Epidemiol. 2023, 34, 90-6.
39. Post, G. B. Recent US State and Federal drinking water guidelines for per- and polyfluoroalkyl substances. Environ. Toxicol. Chem. 2021, 40, 550-63.
40. USEPA. Per- and polyfluoroalkyl substances national primary drinking water regulation [EPA-HQ-OW-2022-0114]. 2024. https://www.regulations.gov/document/EPA-HQ-OW-2022-0114-3076. (accessed 2026-07-10).
41. USEPA. Rescission of regulatory determinations and removal of related provisions for four PFAS substances (PFHxS, PFNA, HFPO-DA (GenX), and the mixture of these three PFAS plus PFBS) [EPA-HQ-OW-2025-0654; FRL 12843-01-OW]. 2026. https://www.govinfo.gov/content/pkg/FR-2026-05-20/pdf/2026-10085.pdf. (accessed 2026-07-10).
42. National Academies of Sciences, Engineering, and Medicine; Health and Medicine Division; Division on Earth and Life Studies; Board on Population Health and Public Health Practice; Board on Environmental Studies and Toxicology; Committee on the Guidance on PFAS Testing and Health Outcomes. Guidance on PFAS exposure, testing, and clinical follow-up. Washington, D.C.: National Academies Press; 2022.
43. Lynch, M. T.; Lay, C. R.; Sokolinski, S.; et al. Community-facing toxicokineticmodels to estimate PFAS serum levels based on life history and drinking water exposures. Environ. Int. 2023, 176, 107974.
44. Chiu, W. A.; Lynch, M. T.; Lay, C. R.; et al. Bayesian estimation of human population toxicokinetics of PFOA, PFOS, PFHxS, and PFNA from studies of contaminated drinking water. Environ. Health. Perspect. 2022, 130, 127001.
45. USEPA. Perfluorodecanoic acid (PFDA) [CASRN 335-76-2]. Toxicological review of perfluorodecanoic acid (PFDA) and related salts (Final Report, 2024). https://iris.epa.gov/document/&deid=361797. (accessed 2026-07-10).
46. Dawson, D. E.; Lau, C.; Pradeep, P.; et al. A machine learning model to estimate toxicokinetic half-lives of per- and polyfluoro-alkyl substances (PFAS) in multiple species. Toxics 2023, 11, 98.
47. Ohmori, K.; Kudo, N.; Katayama, K.; Kawashima, Y:. Comparison. of. the. toxicokinetics. between. perfluorocarboxylic. acids. with. different. carbon. chain. length. Toxicology 2003;184:135-40.
48. Kabadi, S. V.; Fisher, J.; Aungst, J.; Rice, P. Internal exposure-based pharmacokinetic evaluation of potential for biopersistence of 6:2 fluorotelomer alcohol (FTOH) and its metabolites. Food. Chem. Toxicol. 2018, 112, 375-82.
49. Greene, C. W.; Bogdan, A. R.; Goeden, H. M. A revised and improved toxicokinetic model to simulate serum concentrations of bioaccumulative PFAS. J. Environ. Expo. Assess. 2024, 3, 12.
50. Zheng, P.; Liu, Y.; An, Q.; et al. Prenatal and postnatal exposure to emerging and legacy per-/polyfluoroalkyl substances: levels and transfer in maternal serum, cord serum, and breast milk. Sci. Total. Environ. 2022, 812, 152446.
51. Mahfouz, M.; Harmouche-Karaki, M.; Matta, J.; et al. Maternal serum, cord and human milk levels of per- and polyfluoroalkyl substances (PFAS), association with predictors and effect on newborn anthropometry. Toxics 2023, 11, 455.
52. Blomberg, A. J.; Haug, L. S.; Lindh, C.; et al. Changes in perfluoroalkyl substances (PFAS) concentrations in human milk over the course of lactation: a study in Ronneby mother-child cohort. Environ. Res. 2023, 219, 115096.
53. USEPA. Update for Chapter 3 of the Exposure Factors Handbook: Ingestion of water and other select liquids. 2019. https://www.epa.gov/sites/default/files/2019-02/documents/efh_-_chapter_3_update.pdf. (accessed 2026-07-10).
54. USEPA. Exposure Factors Handbook: Chapter 15 - Human milk intake. 2011. https://www.epa.gov/system/files/documents/2025-01/efh-chapter15_508.pdf. (accessed 2026-07-10).
55. Belgorodski, N.; Greiner, M.; Tolksdorf, K.; Schueller, K.; Flor, M.; Göhring, L. Package ‘rriskDistributions’: fitting distributions to given data or known quantiles. ver.2.1.2, 2017. https://cran.r-project.org/web/packages/rriskDistributions/rriskDistributions.pdf. (accessed 2026-07-10).
56. USEPA. Methodology for deriving ambient water quality criteria for the protection of human health (2000) [EPA 822-B-00-004]. 2000. https://19january2021snapshot.epa.gov/sites/static/files/2018-10/documents/methodology-wqc-protection-hh-2000.pdf. (accessed 2026-07-10).
57. USEPA. 2018 Edition of the Drinking Water Standards and Health Advisories Tables [EPA 822-F-18-001]. 2018. https://www.epa.gov/system/files/documents/2022-01/dwtable2018.pdf. (accessed 2026-07-10).
58. R Core Team. R: a language and environment for statistical computing. ver.4.5.1. 2025. https://www.R-project.org/. (accessed 2026-07-10).
59. Morris, T. P.; White, I. R.; Crowther, M. J. Using simulation studies to evaluate statistical methods. Stat. Med. 2019, 38, 2074-102.
60. Hölzer, J.; Midasch, O.; Rauchfuss, K.; et al. Biomonitoring of perfluorinated compounds in children and adults exposed to perfluorooctanoate-contaminated drinking water. Environ. Health. Perspect. 2008, 116, 651-7.
61. Babayev, M.; Capozzi, S. L.; Miller, P.; et al. PFAS in drinking water and serum of the people of a southeast Alaska community: a pilot study. Environ. Pollut. 2022, 305, 119246.
62. Hall, S. M.; Zhang, S.; Tait, G. H.; et al. PFAS levels in paired drinking water and serum samples collected from an exposed community in Central North Carolina. Sci. Total. Environ. 2023, 895, 165091.
63. Criswell, R. L.; Simones, T.; Chatterjee, M.; Waite, J.; Diaz, S.; Smith, A. Quantifying levels of per- and polyfluoroalkyl substances (PFAS) in water and serum after contamination from agricultural biosolid application. Environ. Int. 2024, 190, 108850.
64. Fromme, H.; Mosch, C.; Morovitz, M.; et al. Pre- and postnatal exposure to perfluorinated compounds (PFCs). Environ. Sci. Technol. 2010, 44, 7123-9.
65. Varsi, K.; Torsvik, I. K.; Huber, S.; Averina, M.; Brox, J.; Bjørke-Monsen, A. Impaired gross motor development in infants with higher PFAS concentrations. Environ. Res. 2022, 204, 112392.
66. Bartell, S. M. Online serum PFOA calculator for adults. Environ. Health. Perspect. 2017, 125, 104502.
67. Arzuaga, X.; Druwe, I. L.; Bateson, T. F.; et al. IRIS toxicological review of perfluorohexanesulfonic acid (PFHxS, CASRN 335-46-4) and related salts. Washington (DC): U.S. Environmental Protection Agency; 2025. https://www.ncbi.nlm.nih.gov/books/NBK614202/. (accessed 2026-07-10).
68. USEPA. Human health toxicity assessment for perfluorooctanoic acid (PFOA) and related salts, final [815R24006]. 2024. https://www.epa.gov/system/files/documents/2024-05/final-human-health-toxicity-assessment-pfoa.pdf. (accessed 2026-07-10).
69. USEPA. Human health toxicity assessment for perfluorooctane sulfonic acid (PFOS) and related salts, final [815R24007] 2024. https://www.epa.gov/system/files/documents/2024-05/final-human-health-toxicity-assessment-pfos.pdf. (accessed 2026-07-10).
70. USEPA. IRIS toxicological review of perfluorononanoic acid (PFNA) and related salts (Public Comment and External Review Draft) [EPA/635/R-24/031a] 2024. https://assessments.epa.gov/risk/document/&deid%3D355409. (accessed 2026-07-10).
71. USEPA. Maximum contaminant level goals (MCLGs) for three individual per- and polyfluoroalkyl substances (PFAS) and a mixture of four PFAS, final [EPA-815-R-24-004]. 2024. https://www.epa.gov/system/files/documents/2024-04/pfas-hi-mclg_final508.pdf. (accessed 2026-07-10).
72. USEPA. Guidelines for the health risk assessment of chemical mixtures [EPA/630/R-98/002]. 1986. https://www.epa.gov/sites/default/files/2014-11/documents/chem_mix_1986.pdf. (accessed 2026-07-10).
73. USEPA. Supplementary guidance for conducting health risk assessment of chemical mixtures [EPA/630/R-00/002]. 2000. https://ordspub.epa.gov/ords/eims/eimscomm.getfile?p_download_id=4486. (accessed 2026-07-10).
74. Mogensen, U. B.; Grandjean, P.; Nielsen, F.; Weihe, P.; Budtz-Jørgensen, E. Breastfeeding as an exposure pathway for perfluorinated alkylates. Environ. Sci. Technol. 2015, 49, 10466-73.
75. Koponen, J.; Winkens, K.; Airaksinen, R.; et al. Longitudinal trends of per- and polyfluoroalkyl substances in children’s serum. Environ. Int. 2018, 121, 591-9.
76. Mondal, D.; Weldon, R. H.; Armstrong, B. G.; et al. Breastfeeding: a potential excretion route for mothers and implications for infant exposure to perfluoroalkyl acids. Environ. Health. Perspect. 2014, 122, 187-92.
77. Papadopoulou, E.; Sabaredzovic, A.; Namork, E.; Nygaard, U. C.; Granum, B.; Haug, L. S. Exposure of Norwegian toddlers to perfluoroalkyl substances (PFAS): the association with breastfeeding and maternal PFAS concentrations. Environ. Int. 2016, 94, 687-94.
78. Vannoy, B. N.; Lam, J.; Zota, A. R. Breastfeeding as a predictor of serum concentrations of per- and polyfluorinated alkyl substances in reproductive-aged women and young children: a rapid systematic review. Curr. Environ. Health. Rep. 2018, 5, 213-24.
79. Pétré, M. A.; Salk, K. R.; Stapleton, H. M.; et al. Per- and polyfluoroalkyl substances (PFAS) in river discharge: modeling loads upstream and downstream of a PFAS manufacturing plant in the Cape Fear watershed, North Carolina. Sci. Total. Environ. 2022, 831, 154763.
80. Johanson, G.; Gyllenhammar, I.; Ekstrand, C.; et al. Quantitative relationships of perfluoroalkyl acids in drinking water associated with serum concentrations above background in adults living near contamination hotspots in Sweden. Environ. Res. 2023, 219, 115024.
81. Zhang, S.; Kang, Q.; Peng, H.; et al. Relationship between perfluorooctanoate and perfluorooctane sulfonate blood concentrations in the general population and routine drinking water exposure. Environ. Int. 2019, 126, 54-60.
82. Bogdan, A. R.; Fossen Johnson, S.; Goeden, H. Estimation of serum PFOA concentrations from drinking and non–drinking water exposures. Environ. Health. Perspect. 2023, 131, 067701.
83. McDonough, C. A.; Choyke, S.; Barton, K. E.; et al. Unsaturated PFOS and other PFASs in human serum and drinking water from an AFFF-impacted community. Environ. Sci. Technol. 2021, 55, 8139-48.
84. Lewis-Michl, E. L.; Forand, S. P.; Hsu, W.; et al. Perfluorooctanoic acid serum concentrations and half-lives in a community exposed to contaminated drinking water in New York State. J. Expo. Sci. Environ. Epidemiol. 2025, 35, 403-13.
85. Xu, Y.; Fletcher, T.; Pineda, D.; et al. Serum half-lives for short- and long-chain perfluoroalkyl acids after ceasing exposure from drinking water contaminated by firefighting foam. Environ. Health. Perspect. 2020, 128, 077004.
86. Emmett, E. A.; Shofer, F. S.; Zhang, H.; Freeman, D.; Desai, C.; Shaw, L. M. Community exposure to perfluorooctanoate: relationships between serum concentrations and exposure sources. J. Occup. Environ. Med. 2006, 48, 759-70.
Cite This Article
 Open Access
How to Cite
Download Citation
Export Citation File:
Type of Import
Tips on Downloading Citation
Citation Manager File Format
Type of Import
Direct Import: When the Direct Import option is selected (the default state), a dialogue box will give you the option to Save or Open the downloaded citation data. Choosing Open will either launch your citation manager or give you a choice of applications with which to use the metadata. The Save option saves the file locally for later use.
Indirect Import: When the Indirect Import option is selected, the metadata is displayed and may be copied and pasted as needed.
About This Article
Copyright

Data & Comments
Data
0










Comments
Comments must be written in English. Spam, offensive content, impersonation, and private information will not be permitted. If any comment is reported and identified as inappropriate content by OAE staff, the comment will be removed without notice. If you have any queries or need any help, please contact us at [email protected].