
fig3
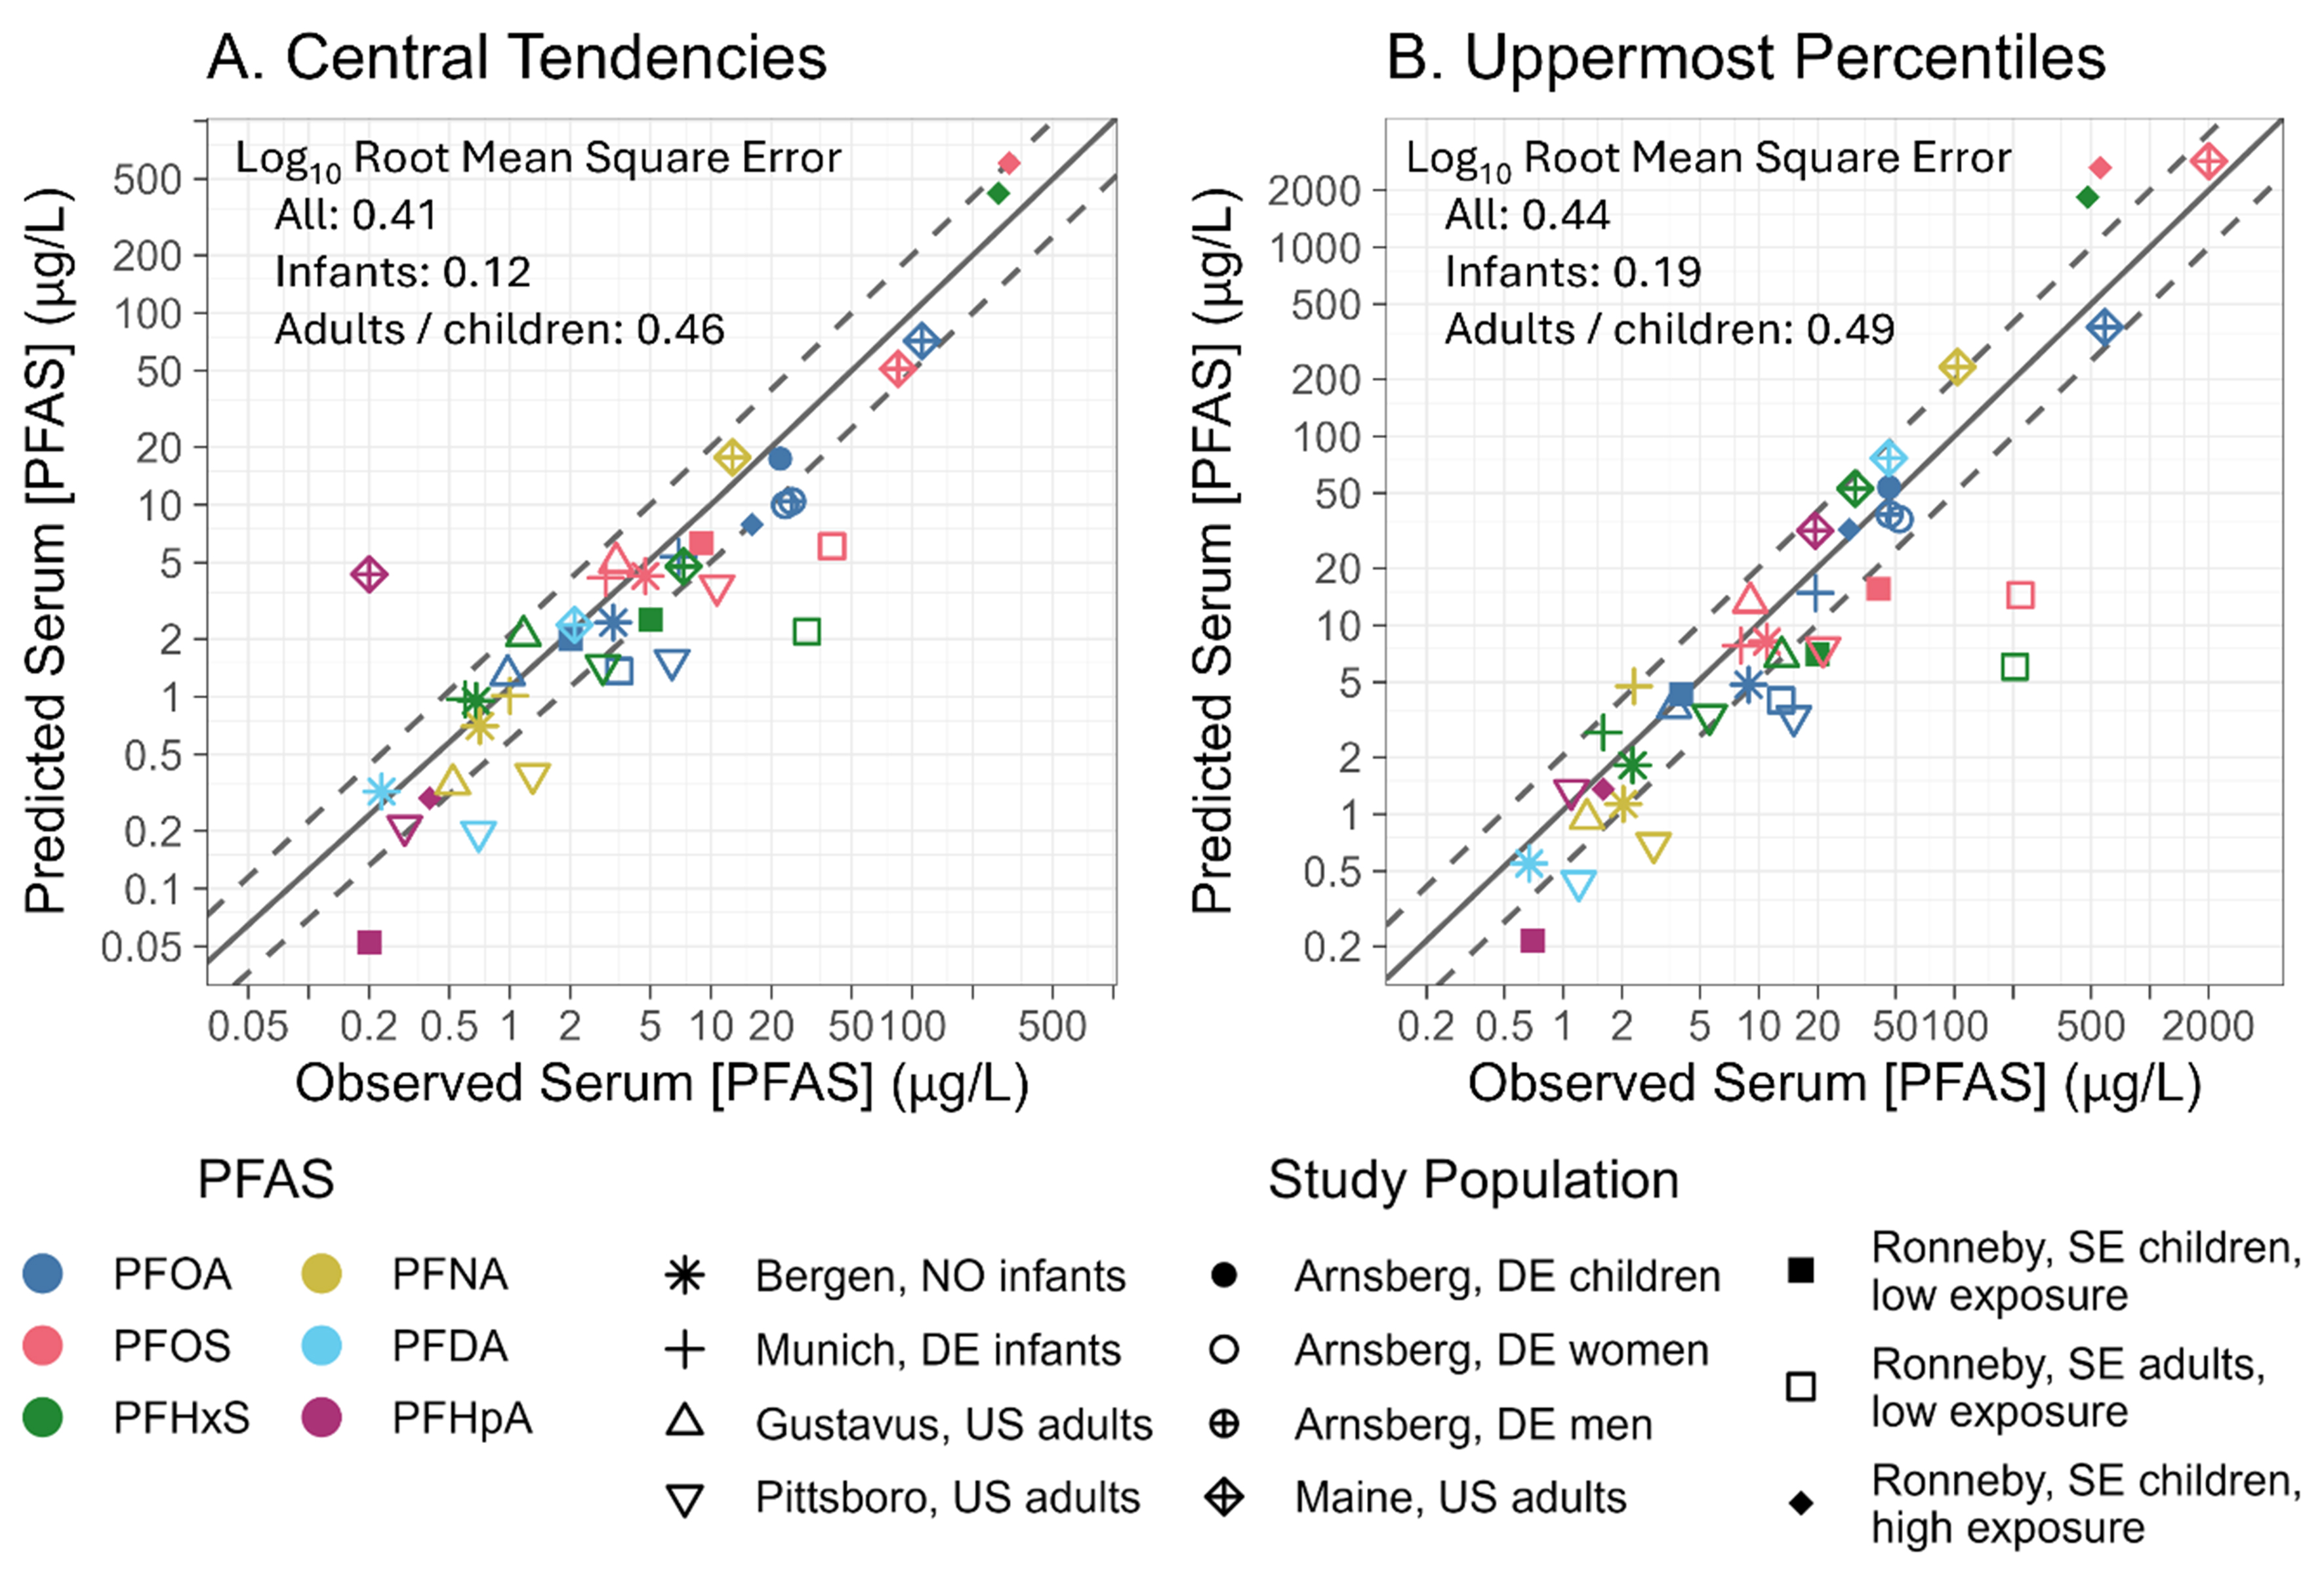
Figure 3. Goodness of fit model evaluation results for (A) central tendency values and (B) upper percentile values on log scale axes. Central tendency values are medians or GMs. Upper percentile values are 90th or 95th percentiles or study maxima. Modeling exposure scenarios are described in Supplementary Tables 7 and 8. The dashed line shows a two-fold difference from the solid line of equality. For points above the line of equality, the model overpredicts the empirical data. For points below the line of equality, the model underpredicts the empirical data. For each data point, the color corresponds to the PFAS and the shape corresponds to the Study Population. GMs: Geometric means; PFAS: per- and polyfluoroalkyl substances; PFOA: perfluorooctanoic acid; PFNA: perfluorononanoic acid; PFOS: perfluorooctanesulfonic acid; PFDA: perfluorodecanoic acid; PFHxS: perfluorohexanesulfonic acid; PFHpA: perfluoroheptanoic acid; NO: Norway; DE: Germany; US: United States of America; SE: Sweden.