


fig1
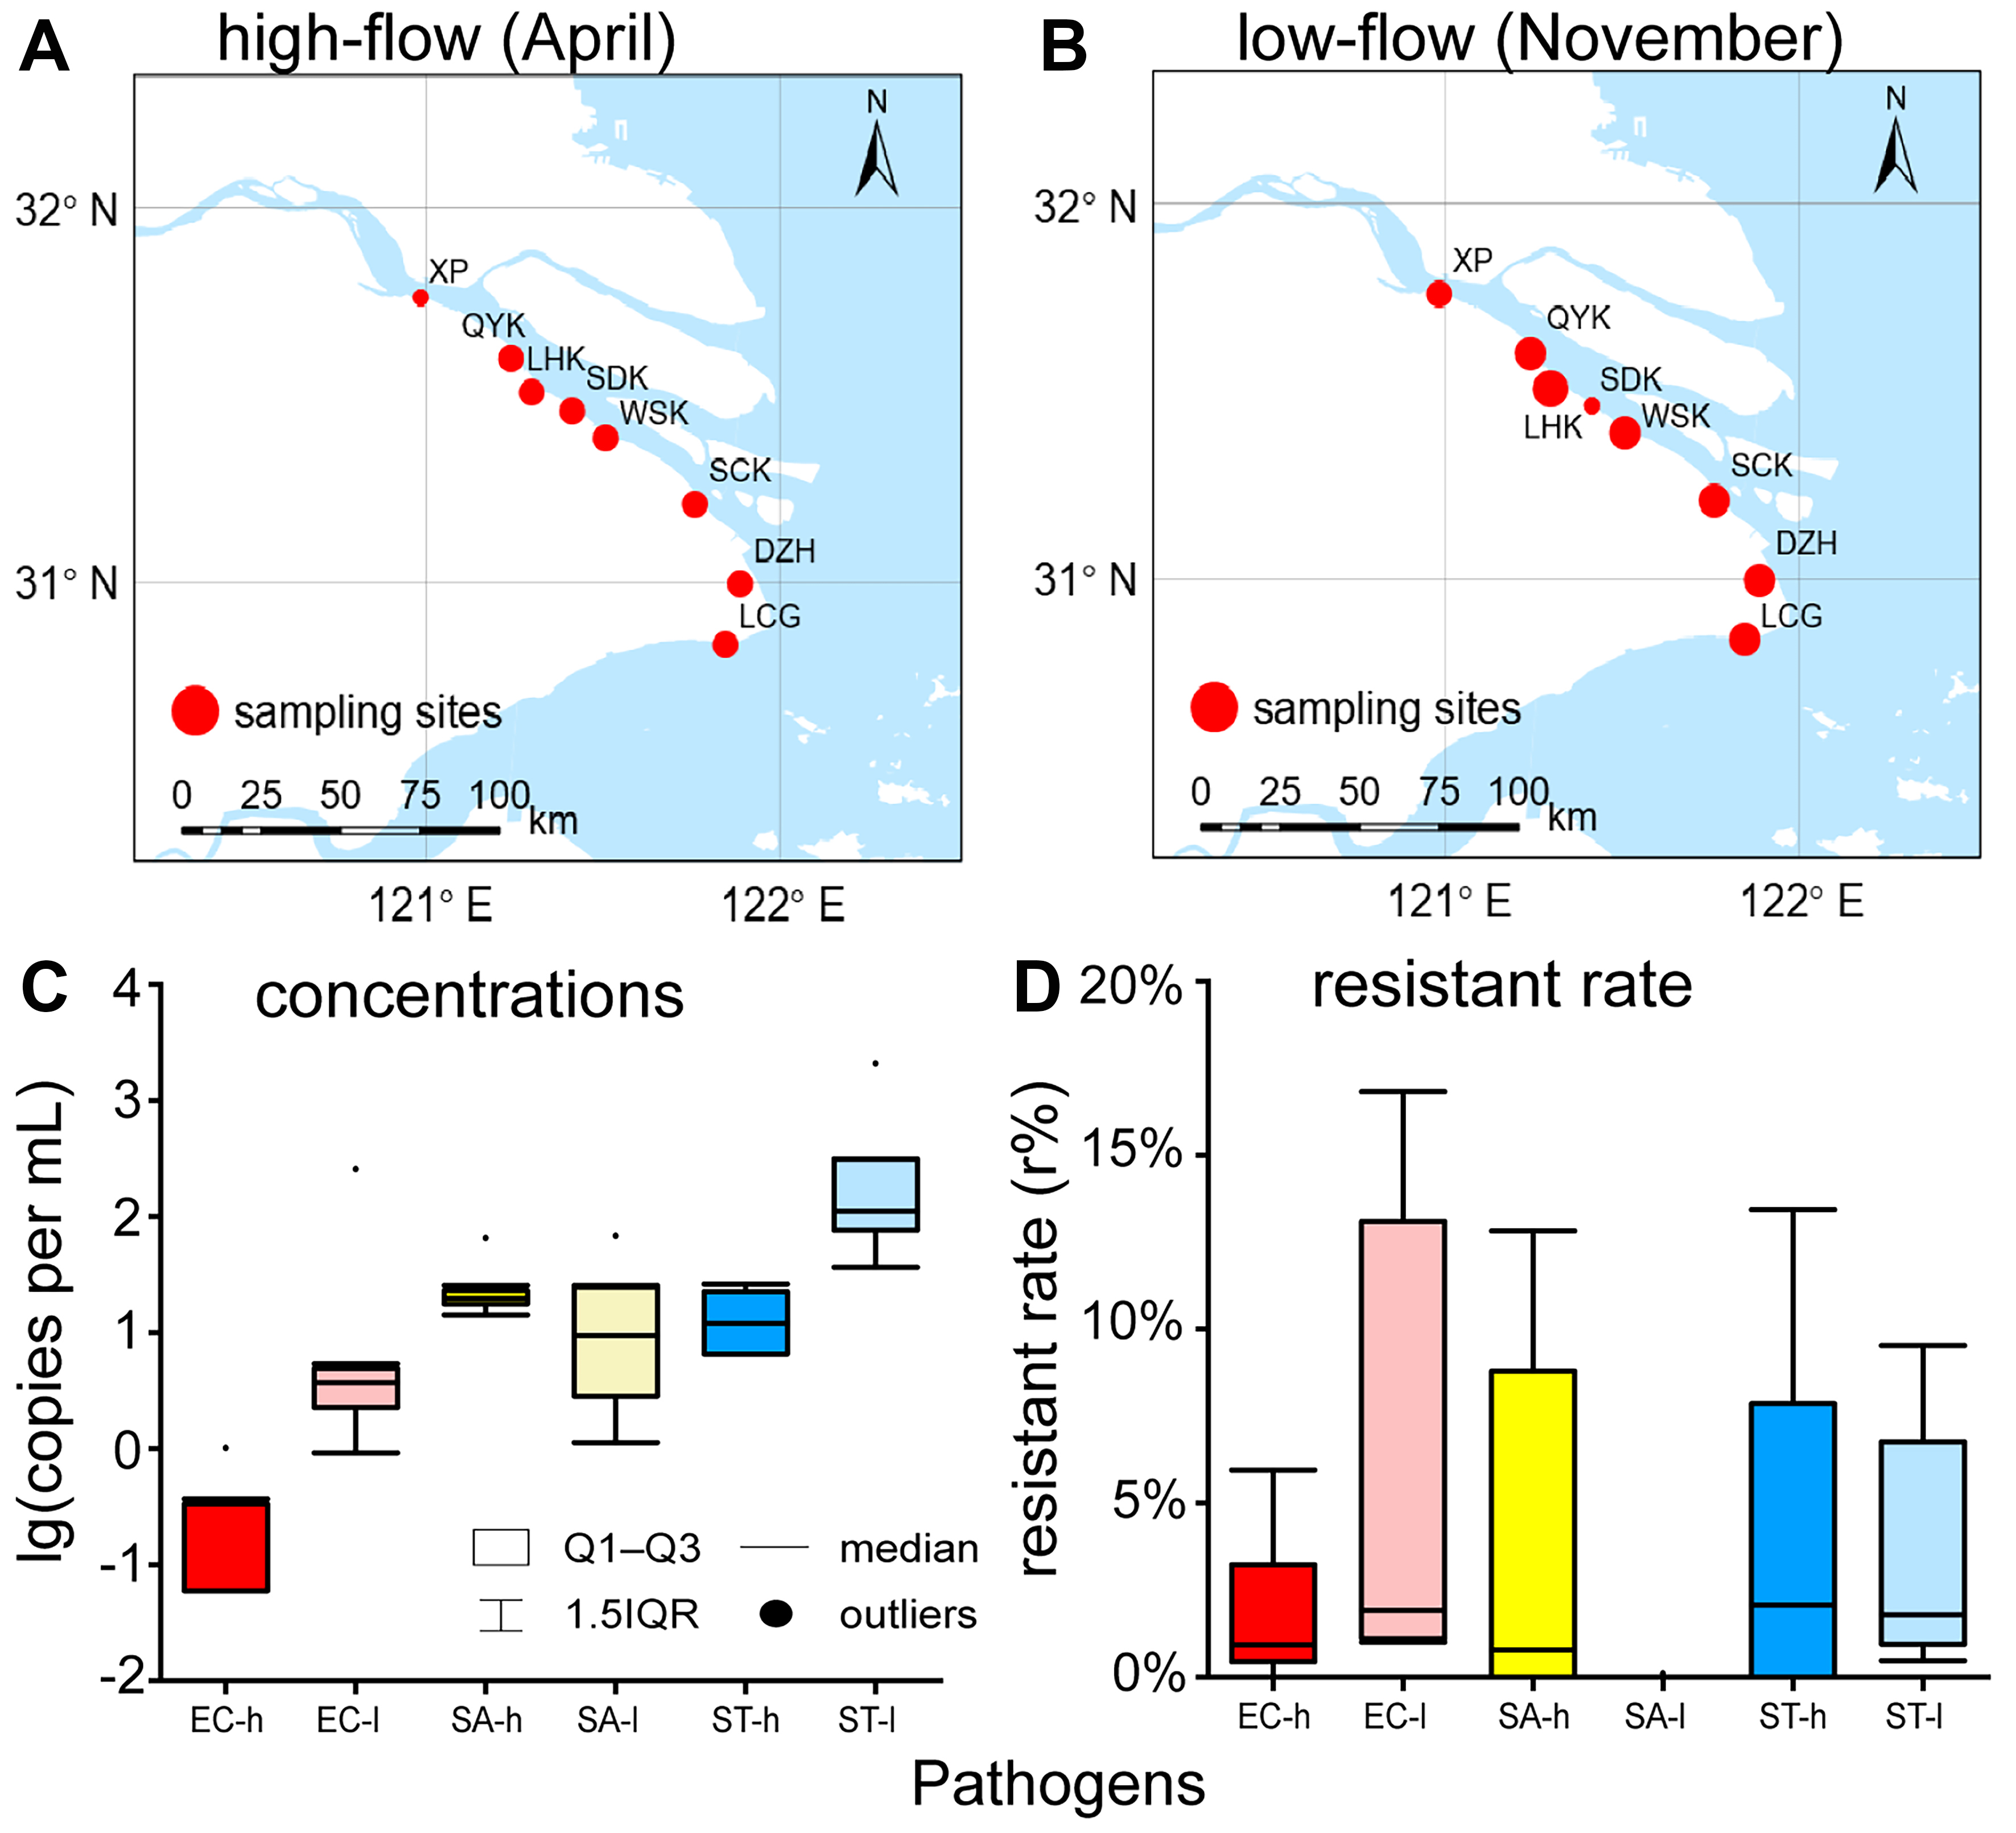
Figure 1. Sampling sites in (A) high-flow season and (B) low-flow season in the Yangtze Estuary of this study, with size of points representing combined concentration of EC, SA and ST; and quantification of (C) general pathogens and (D) resistant ratios. The base map used in this figure was obtained from National Catalogue Service For Geographic Information[25] (https://www.webmap.cn). EC: Escherichia coli; SA: Staphylococcus aureus; ST: Salmonella typhi; h: high-flow season; l: low-flow season; XP: Xupu; QYK: Qiyakou; LHK: Liuhekou; SDK: Shidongkou; WSK: Wusongkou; SCK: Sanchakou; DZH: Dazhihe; LCG: Luchaogang; IQR: interquartile range.


