


fig2
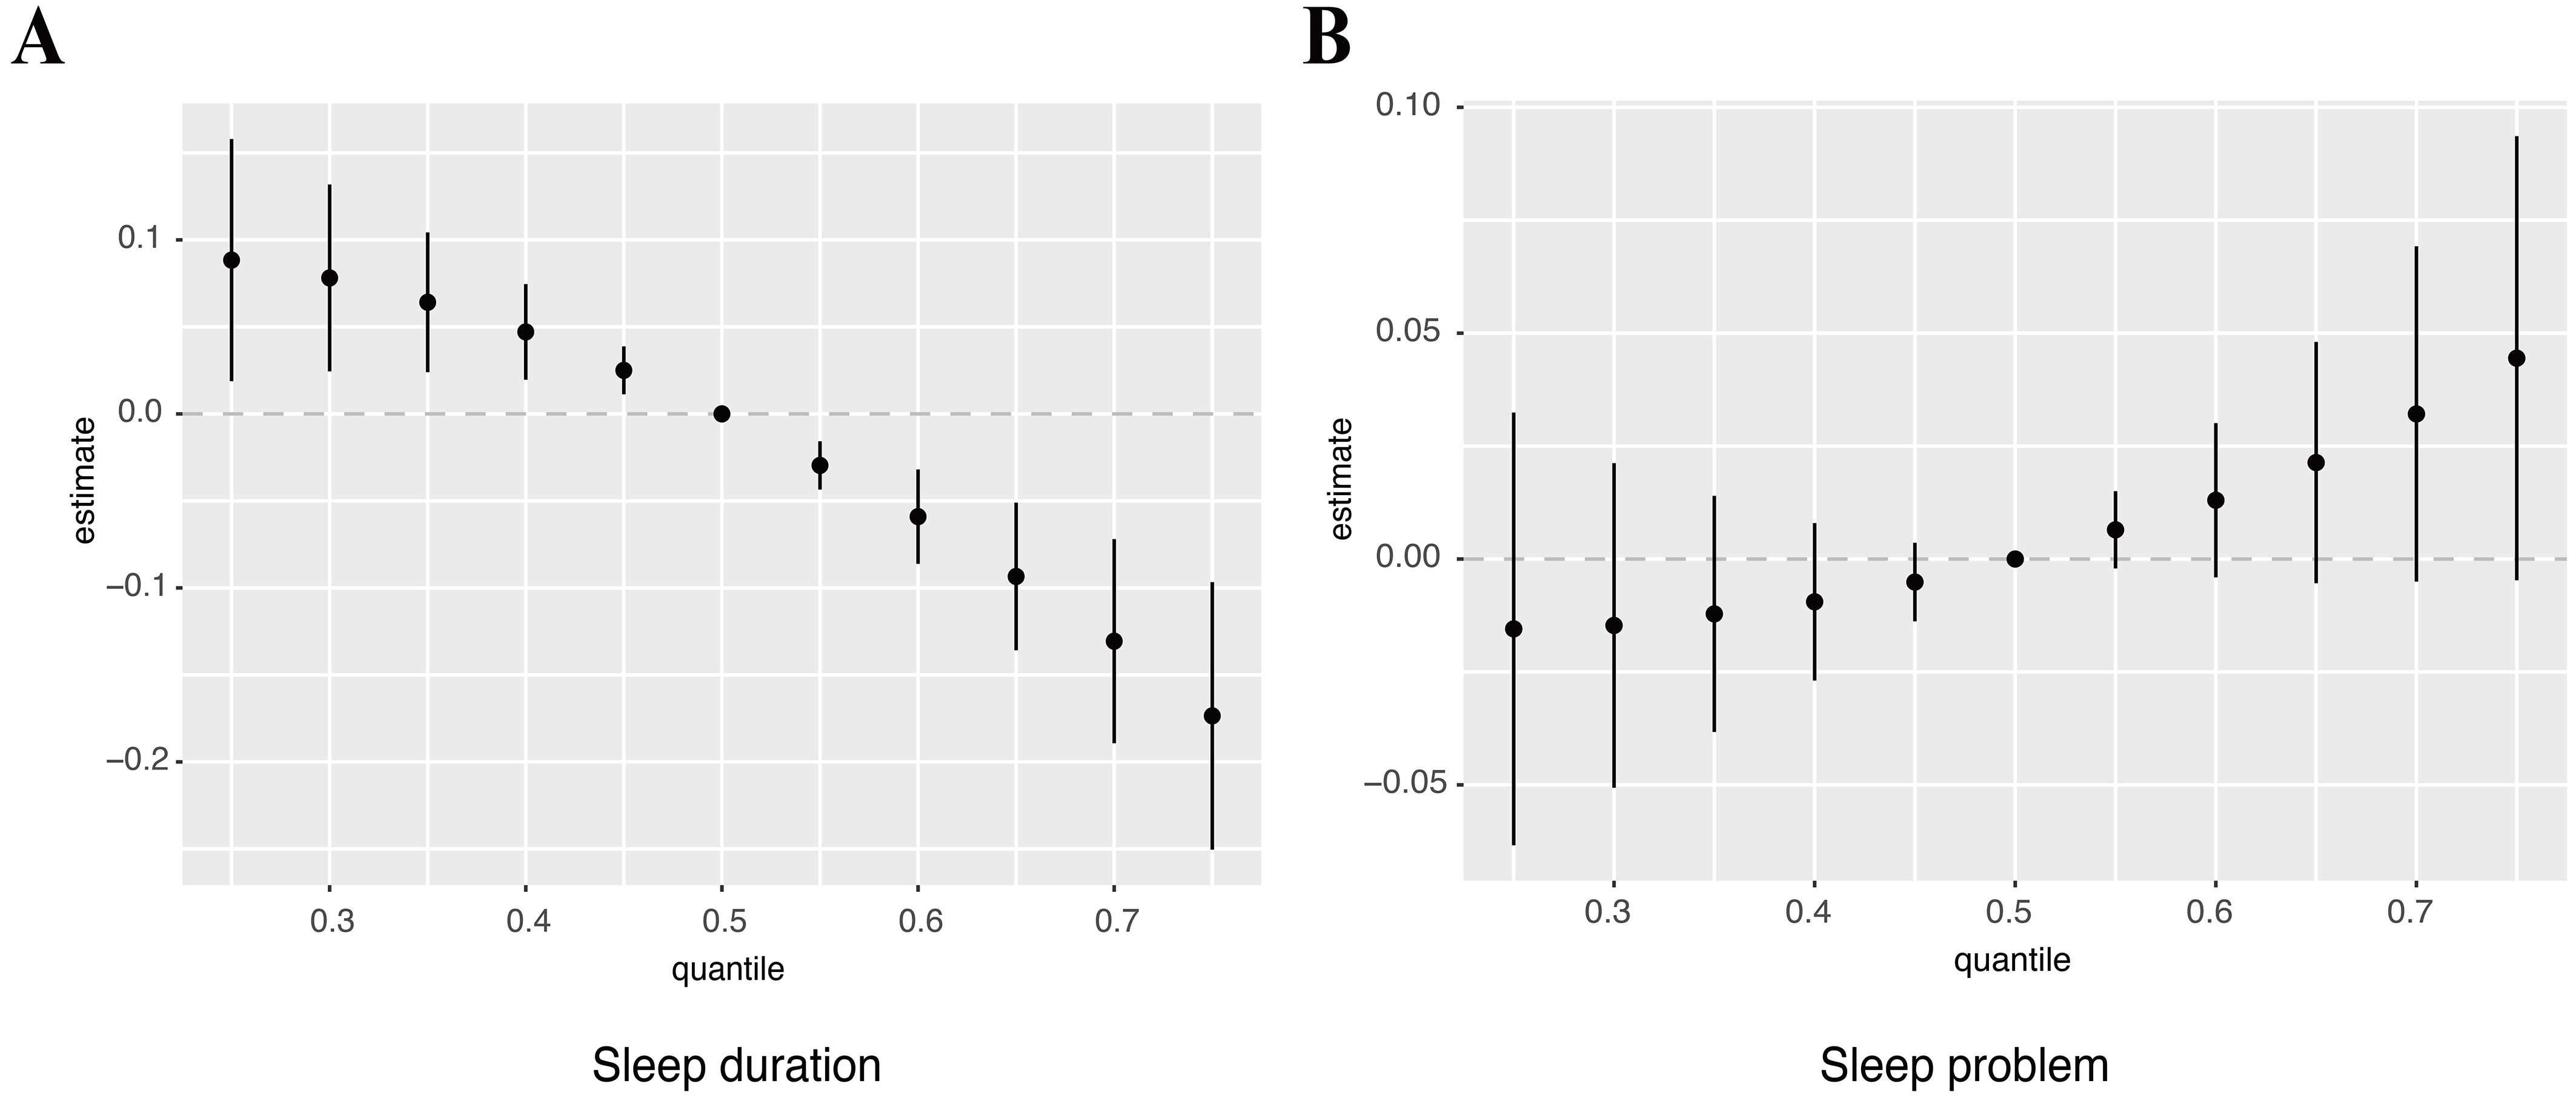
Figure 2. BKMR analysis showed associations between the overall OPE metabolite mixture and sleep duration (A) and sleep problems (B). The model was adjusted for covariates including age, sex, race, education, BMI, marital status, alcohol status, smoking status, and PIR. OPE: Organophosphate ester; BMI: body mass index; PIR: poverty-income ratio.


