

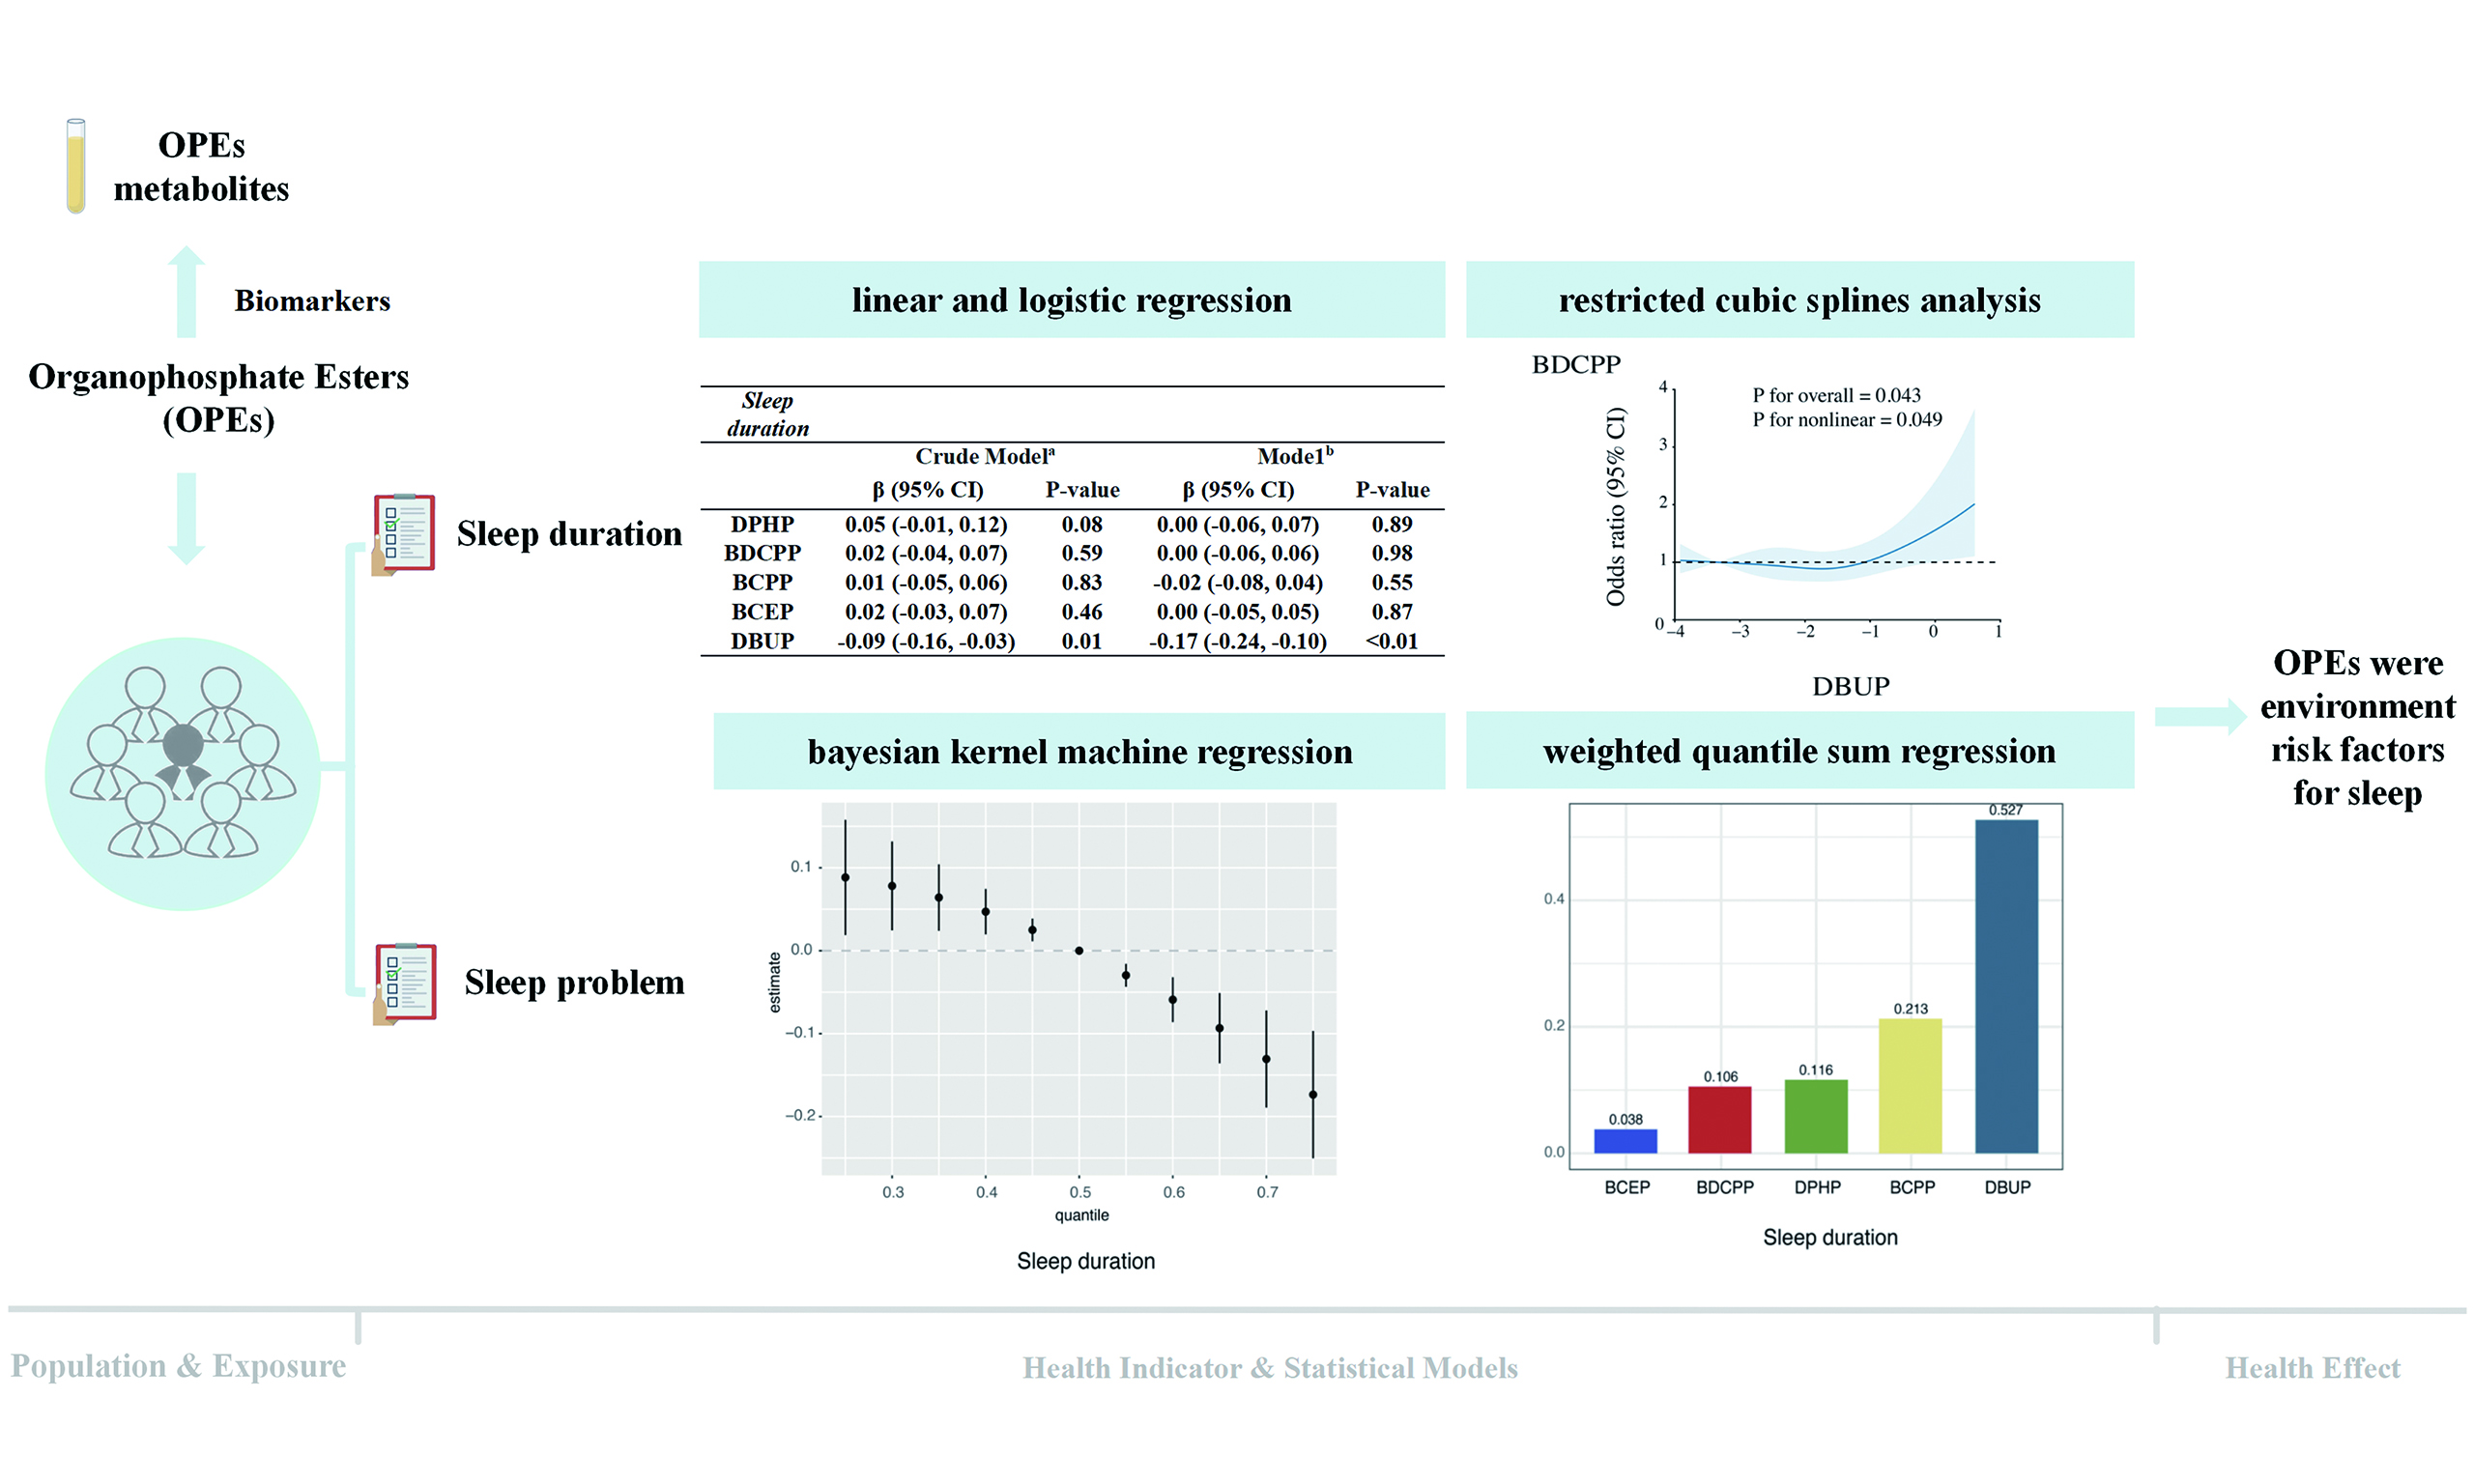
Organophosphate esters exposure associated with increased risk of sleep problems
 0
0 Abstract
Organophosphate esters (OPEs), commonly employed as flame retardants and plasticizers, have raised increasing concern due to their potential impacts on human health. Despite their widespread use, population-based evidence regarding their relationship with sleep health remains scarce. In this research, we examined data from the 2013-2016 cycles of the U.S. National Health and Nutrition Examination Survey (NHANES) to investigate the relationship between urinary OPE metabolites and sleep outcomes. The analysis included 2,606 participants who had complete data on both exposure and outcomes. Multivariable linear and logistic regression models were applied to examine associations, while restricted cubic spline models were used to test for potential nonlinear dose-response patterns. To account for combined exposure, we further conducted Bayesian kernel machine regression and weighted quantile sum regression. Our findings showed that dibutyl phosphate (DBUP) was inversely related to sleep duration and exhibited nonlinear associations with sleep indicators. Mixed-exposure analyses indicated that higher cumulative levels of OPEs were linked to shorter sleep duration. Additionally, bis(1-chloro-2-propyl) phosphate (BCPP) was positively related to self-reported sleep problems, particularly among older participants. In general, the findings indicate that exposure to OPEs, particularly DBUP (which originates from tri-n-butyl phosphate, TNBP) and BCPP [derived from tris(2-chloro-isopropyl) phosphate, TCPP], may be associated with sleep disturbances among the U.S. population. Additional mechanistic and long-term studies are needed to validate these associations.
Keywords
INTRODUCTION
Organophosphate esters (OPEs) are man-made chemicals commonly utilized as plasticizers and flame retardants in various consumer and industrial items. These include products such as polyurethane foams, plastics, construction materials, and goods intended for infants[1-5]. Because OPEs are physically mixed into rather than chemically bound to polymers, they are prone to volatilization, abrasion, and leaching, leading to continuous release into the surrounding environment[1].
OPEs are widely detected in indoor and outdoor environments, leading to ubiquitous exposure among the general population. Indoor dust, air, and household surfaces are considered major sources, as OPEs are frequently emitted from furniture, electronics, and building materials into indoor microenvironments. Inhalation of contaminated air, ingestion of settled dust, and dermal contact are common exposure pathways in daily life. In addition, dietary intake, especially from fatty foods, packaging materials, and drinking water, also contributes to overall exposure. Biomonitoring studies have detected measurable levels of OPE metabolites in the urine of adults, children, and even infants, confirming that non-occupational exposure is widespread and persistent in the general population[6-8].
Biomonitoring studies have reported ubiquitous human exposure, with urinary metabolites such as diphenyl phosphate (DPHP) and bis(1,3-dichloro-2-propyl) phosphate (BDCPP) detected in more than 95% of samples[9]. Urinary metabolites are now recognized as reliable, non-invasive biomarkers reflecting recent exposure. Toxicological evidence further indicates that OPEs can act as endocrine disruptors and may cause carcinogenic, reproductive, developmental, and neurotoxic effects[10-12]. The increasing burden of sleep problems highlights the importance of identifying modifiable environmental risk factors that may be linked to sleep disruption. Sleep disturbance is also an early and sensitive indicator of central nervous system dysregulation, reflecting subtle neurobehavioral effects before the onset of more overt neurological or metabolic disorders. Given that OPEs have been implicated in oxidative stress, neuroinflammation, and endocrine disruption, which are biological pathways strongly linked to sleep regulation, examining sleep provides a sensitive and meaningful endpoint for evaluating the neurotoxic potential of OPE exposure.
Biological mechanisms support a possible link between OPE exposure and sleep disturbances. Animal studies demonstrate that certain OPEs induce oxidative stress, neuroinflammation, and mitochondrial dysfunction[13-15], all of which are implicated in sleep regulation. For example, tri-n-butyl phosphate (TNBP), the parent compound of urinary dibutyl phosphate (DBUP), has been shown to disrupt motor behavior, elevate reactive oxygen species (ROS), and alter stress-related signaling pathways in nematodes and to accumulate in neural tissues of earthworms with concomitant reductions in glutamate and ATPase activities[16]. Since glutamate and γ-aminobutyric acid (GABA) are key neurotransmitters in sleep control[17], such disturbances provide biological plausibility for impaired sleep. Similarly, tris(2-chloro-isopropyl) phosphate (TCPP), the parent of bis(1-chloro-2-propyl) phosphate (BCPP), reduces serotonin levels and induces oxidative stress in experimental models[18]. Serotonin is central to sleep homeostasis[19], further supporting a mechanistic link between OPEs and sleep regulation.
Despite this plausibility, epidemiological evidence is scarce. Most human studies of OPEs have focused on outcomes such as reproductive and thyroid function, neurodevelopment, or cancer[9,11], whereas sleep has received little attention. By contrast, other environmental contaminants, such as per- and polyfluoroalkyl substances (PFAS) and phthalates, have been associated with altered sleep duration and quality in NHANES (U.S. National Health and Nutrition Examination Survey) analyses. These findings suggest that environmental chemicals may play a broader role in sleep health, but OPEs have not been systematically evaluated. Additionally, previous research on OPEs has often focused on single-pollutant models, which fail to account for the complexity of real-life exposures, where individuals are simultaneously exposed to several interconnected chemicals. Ignoring such co-exposure may underestimate the true health risks or obscure interactive effects.
This study fills these gaps by examining the relationship between urinary OPE metabolites and both sleep duration and self-reported sleep issues in a nationally representative cohort of U.S. adults, using data from the 2013-2016 NHANES. In addition to conventional multivariable regression, we also applied restricted cubic splines (RCS) to explore possible nonlinear relationships between exposure and response. To capture the combined effects of co-exposure, we further applied two advanced mixture modeling approaches: Bayesian kernel machine regression (BKMR) and weighted quantile sum (WQS) regression[20,21]. By integrating traditional regression with mixture-based methods, this study further assessed the effects of mixed exposure to OPEs on sleep-related indicators. It has important implications for understanding the effects of OPEs on human health.
MATERIALS AND METHODS
Study design and population
The NHANES is an ongoing, biennial program that uses a complex, stratified, multistage probability sampling approach to collect data representative of the non-institutionalized civilian population in the United States (NHANES, https://www.cdc.gov/nchs/nhanes/index.htm). Ethical approval for the surveys was obtained from the National Center for Health Statistics (NCHS) Research Ethics Review Board (Protocol #2011-17), and all participants provided written informed consent. The present analysis drew on data from the 2013-2014 and 2015-2016 cycles. Participants were eligible if they met the following criteria: (1) had available measurements of urinary OPE metabolites; (2) completed questionnaires on sleep duration and self-reported sleep problems; and (3) had no missing values for key covariates. After applying these criteria, 2,606 individuals were retained for the final analysis, as illustrated in Supplementary Figure 1. Both urine specimens and sleep questionnaire data were collected during the same NHANES examination visit; thus, exposure and outcome were assessed at essentially the same time point.
Urinary OPEs metabolite measurements
Spot urine samples were collected from participants during the Mobile Examination Center (MEC) visit of each NHANES cycle. After collection, specimens were refrigerated immediately, frozen at -20 °C, and shipped on dry ice to the National Center for Environmental Health (NCEH), Centers for Disease Control and Prevention (CDC), for analysis. Analytical procedures involved enzymatic deconjugation of metabolite conjugates, followed by automated off-line solid-phase extraction, separation using reversed-phase high-performance liquid chromatography, and detection through isotope dilution coupled with electrospray ionization tandem mass spectrometry[22]. In both NHANES survey cycles, seven metabolites were assayed. For concentrations below the limit of detection (LOD), values were imputed as LOD divided by the square root of two. To maintain the robustness of the analysis, only metabolites with detection frequencies of 50% or higher were included, namely DPHP, BDCPP, BCPP, bis(2-chloroethyl) phosphate (BCEP), and DBUP. All analyses were performed at the Division of Laboratory Sciences, NCEH, CDC, following standardized quality-assurance and quality-control (QA/QC) procedures, including calibration verification, analysis of reagent blanks, and blind duplicate samples.
Sleep problems and sleep duration assessment
NHANES provided participants with questionnaires regarding sleep duration. Sleep problems were identified based on “Ever told doctor had trouble sleeping?”. Sleep duration was obtained from the question “How much sleep do you usually get at night on weekdays or workdays?” (variable SLD010H) and treated as a continuous variable (h). Sleep problems were determined based on participants’ responses (“yes” or “no”) to the question “Have you ever told a doctor or other health professional that you have trouble sleeping?” (variable SLQ050). Both variables were collected through self-administered questionnaires during the same examination visit in NHANES, reflecting usual sleep patterns rather than clinically diagnosed disorders.
Covariates
The following potential confounders were identified based on the previous research[23]. The demographic data included age, sex, race, education, marital status and family poverty-income ratio (PIR). Age was categorized as < 60 years and ≥ 60 years[24]. Race included Mexican American, Other Hispanic, Non-Hispanic White, Non-Hispanic Black and Other races. Educational levels were categorized as less than 9th grade, 9th-11th grade, high school graduate, some college or Associate of Arts (AA) degree, and college graduate or above. Marital status was categorized as married, widowed, divorced, separated, never married and living with a partner. Body mass index (BMI) was computed by dividing weight (in kilograms) by the square of height (in meters) (kg/m²). Smoking status is based on having smoked ≥ 100 cigarettes in a person’s lifetime, and alcohol status is based on consuming ≥ 12 alcoholic drinks per year[25].
Statistical analysis
Analyses were conducted in a stepwise manner. We first described baseline demographic and exposure characteristics and then examined single-metabolite associations, followed by nonlinear exposure-response analyses and mixture models to evaluate combined exposures. Group differences in demographic characteristics by age were evaluated using chi-square tests for categorical variables, and Mann-Whitney or Kruskal-Wallis tests for continuous variables as appropriate. Urinary OPE concentrations were creatinine (Cr)-corrected in the primary analyses. Because distributions were skewed, concentrations were log-transformed prior to modeling. To evaluate robustness to urine dilution adjustment, additional models using unadjusted concentrations were examined. Pairwise correlations among metabolites were quantified using Spearman’s rank correlation.
Associations with sleep duration (continuous outcome) were assessed using multivariable linear regression, and with sleep problems (binary outcome) using logistic regression. Model 1 was not adjusted, while Model 2 included adjustments for age, sex, race/ethnicity, education, BMI, marital status, smoking, alcohol, and PIR. Analyses were further stratified by age group (< 60 vs. ≥ 60 years). Regression diagnostics were performed to verify assumptions. Nonlinear relationships were explored using RCS regression, with knots placed at selected percentiles (e.g., 10th, 50th, 90th) of the exposure distribution. Curves and overall P-values for nonlinearity were reported.
To assess health effects of concurrent exposures, we applied two complementary mixture modeling approaches. In BKMR, univariate exposure-response functions were estimated for each metabolite while holding the others at their median, and potential interactions were visualized with bivariate functions. Models were run for 10,000 iterations. In WQS regression, indices were constructed in the negative direction for sleep duration and positive direction for sleep problems, with the dataset randomly split into a 40% training set and a 60% validation set to reduce overfitting. The component weights indicated the proportional contribution of each metabolite to the overall effect of the mixture. BKMR allows flexible estimation of non-linear and interactive effects[26], while WQS provides interpretable rankings of component importance; applying both approaches offers complementary insights. All analyses were conducted in R version 4.0.5. Statistical significance was set at two-sided P < 0.05.
RESULTS AND DISCUSSION
Participant characteristics
Table 1 summarizes the demographic and exposure characteristics of the 2,606 participants: 1,744 (66.9%) were younger than 60 years and 862 (33.1%) were aged 60 years or older. Significant differences by age group were observed for race/ethnicity, education level, and marital status. Younger adults reported higher rates of alcohol consumption, whereas smoking prevalence was greater among older participants. Consistent with established age-related patterns, individuals in the ≥ 60 years group tended to report longer average sleep duration and a higher frequency of sleep problems.
Basic demographic characteristics of participants stratified by age
| Characteristics | Total (n = 2,606) | < 60 years (n = 1,744) | ≥ 60 years (n = 862) | P-value |
| Mean (SD) or n (%) | ||||
| Sex | 0.90 | |||
| Men | 1,268 (48.66%) | 847 (48.57%) | 421 (48.84%) | |
| Women | 1,338 (51.34%) | 897 (51.43%) | 441 (51.16%) | |
| Race | < 0.01 | |||
| Mexican American | 377 (14.47%) | 257 (14.74%) | 120 (13.92%) | |
| Other Hispanic | 267 (10.25%) | 181 (10.38%) | 86 (9.98%) | |
| Non-Hispanic White | 1,102 (42.29%) | 703 (40.31%) | 399 (46.29%) | |
| Non-Hispanic Black | 513 (19.69%) | 346 (19.84%) | 167 (19.37%) | |
| Other races | 347 (13.32%) | 257 (14.74%) | 90 (10.44%) | |
| BMI (kg/m2) | 29.52 (7.16) | 29.63 (7.55) | 29.30 (6.30) | 0.68 |
| Education | < 0.01 | |||
| Less than 9th Grade | 205 (7.87%) | 94 (5.39%) | 111 (12.88%) | |
| 9-11th Grade | 302 (11.59%) | 199 (11.41%) | 103 (11.95%) | |
| High school Grade | 584 (22.41%) | 393 (22.53%) | 191 (22.16%) | |
| Some college or AA degree | 859 (32.96%) | 607 (34.81%) | 252 (29.23%) | |
| College graduate or above | 656 (25.17%) | 451 (25.86%) | 205 (23.78%) | |
| Marital status | < 0.01 | |||
| Married | 1,376 (52.80%) | 893 (51.20%) | 483 (56.03%) | |
| Widowed | 174 (6.68%) | 20 (1.15%) | 154 (17.87%) | |
| Divorced | 307 (11.78%) | 176 (10.09%) | 131 (15.20%) | |
| Separated | 80 (3.07%) | 58 (3.33%) | 22 (2.55%) | |
| Never married | 478 (18.34%) | 428 (24.54%) | 50 (5.80%) | |
| Living with partner | 191 (7.33%) | 169 (9.69%) | 22 (2.55%) | |
| Alcohol status | < 0.01 | |||
| Yes | 1,865 (71.57%) | 1,294 (74.20%) | 571 (66.24%) | |
| No | 741 (28.43%) | 450 (25.80%) | 291 (33.76%) | |
| Smoking status | < 0.01 | |||
| Yes | 1,175 (45.09%) | 736 (42.20%) | 439 (50.93%) | |
| No | 1,431 (54.91) | 1,008 (57.80%) | 423 (49.07%) | |
| PIR | 2.51 (1.61) | 2.54 (1.64) | 2.45 (1.57) | 0.27 |
| Sleep duration (h/night) | 7.28 (1.51) | 7.18 (1.47) | 7.49 (1.58) | < 0.01 |
| Sleep problems | < 0.01 | |||
| Yes | 743 (28.51%) | 442 (25.34%) | 301 (34.92%) | |
| No | 1,863 (71.49%) | 1,302 (74.66%) | 561 (65.08%) | |
| 50th (25th,75th) | ||||
| DPHP (μg/g Cr.) | 0.72 (0.42, 1.31) | 0.73 (0.44, 1.28) | 0.69 (0.40, 1.37) | 0.24 |
| BDCPP (μg/g Cr.) | 0.80 (0.41, 1.57) | 0.89 (0.46, 1.73) | 0.66 (0.33, 1.27) | < 0.01 |
| BCPP (μg/g Cr.) | 0.18 (0.09, 0.34) | 0.17 (0.09, 0.34) | 0.18 (0.10, 0.32) | 0.24 |
| BCEP (μg/g Cr.) | 0.39 (0.19, 0.81) | 0.37 (0.19, 0.77) | 0.42 (0.21, 0.90) | 0.02 |
| DBUP (μg/g Cr.) | 0.15 (0.08, 0.27) | 0.13 (0.07,0.24) | 0.17 (0.09, 0.32) | < 0.01 |
Distributions of Cr-adjusted urinary OPE metabolites are also presented in Table 1. Median concentrations were highest for BDCPP, followed by DPHP, BCEP, BCPP, and DBUP. Age-stratified comparisons showed that BDCPP concentrations were significantly higher in participants < 60 years, while BCEP and DBUP concentrations were elevated among those ≥ 60 years. This age-related pattern may reflect differences in product usage and exposure sources. BDCPP, a metabolite of TDCPP, is commonly associated with furniture foam and children’s products, which may lead to higher exposure among younger individuals, whereas BCEP and DBUP, metabolites of TCEP and TNBP, respectively, are more prevalent in older building materials and household dust, potentially contributing to higher levels among older adults. Similar age-related trends have been reported in previous NHANES biomonitoring studies. Pairwise correlations between the five metabolites were weak, with Spearman’s coefficients ranging from -0.02 to 0.26 [Supplementary Figure 2].
Association of OPEs with sleep duration and problem
Table 2 presents the associations between urinary OPE metabolites and sleep outcomes. In fully adjusted models, higher DBUP concentrations were significantly associated with shorter sleep duration [regression coefficient (β) = -0.17; 95% confidence interval (CI): -0.24, -0.10; P < 0.01], indicating a 0.17-hour decrease in sleep duration per 1-unit increase in ln(DBUP, μg/g Cr). In addition, DBUP showed a positive association with self-reported sleep problems in crude models [odds ratio (OR) = 1.18; 95%CI: 1.07, 1.30; P < 0.01].
Association of OPE metabolites with sleep duration and sleep problems
| Sleep duration | ||||
| Crude modela | Modelb | |||
| β (95%CI) | P-value | β (95%CI) | P-value | |
| DPHP | 0.05 (-0.01, 0.12) | 0.08 | 0.00 (-0.06, 0.07) | 0.89 |
| BDCPP | 0.02 (-0.04, 0.07) | 0.59 | 0.00 (-0.06, 0.06) | 0.98 |
| BCPP | 0.01 (-0.05, 0.06) | 0.83 | -0.02 (-0.08, 0.04) | 0.55 |
| BCEP | 0.02 (-0.03, 0.07) | 0.46 | 0.00 (-0.05, 0.05) | 0.87 |
| DBUP | -0.09 (-0.16, -0.03) | 0.01 | -0.17 (-0.24, -0.10) | < 0.01 |
| Sleep problem | ||||
| Crude modela | Modelb | |||
| OR (95%CI) | P-value | OR (95%CI) | P-value | |
| DPHP | 1.04 (0.95, 1.14) | 0.35 | 0.96 (0.87, 1.06) | 0.45 |
| BDCPP | 0.97 (0.89, 1.05) | 0.48 | 0.97 (0.89, 1.06) | 0.46 |
| BCPP | 1.09 (1.00, 1.19) | 0.04 | 1.07 (0.98, 1.17) | 0.13 |
| BCEP | 1.07 (1.00, 1.16) | 0.06 | 1.04 (0.96, 1.13) | 0.29 |
| DBUP | 1.18 (1.07, 1.30) | < 0.01 | 1.08 (0.97, 1.20) | 0.16 |
RCS analyses further revealed evidence of nonlinearity for DBUP [Figure 1]. At moderate concentrations, DBUP was associated with shorter sleep duration, whereas at higher concentrations, the slope of the curve flattened and suggested a weak positive trend. For sleep problems, the RCS model also indicated a nonlinear association, with higher DBUP levels linked to increased odds of reporting sleep problems (nonlinear P = 0.049).
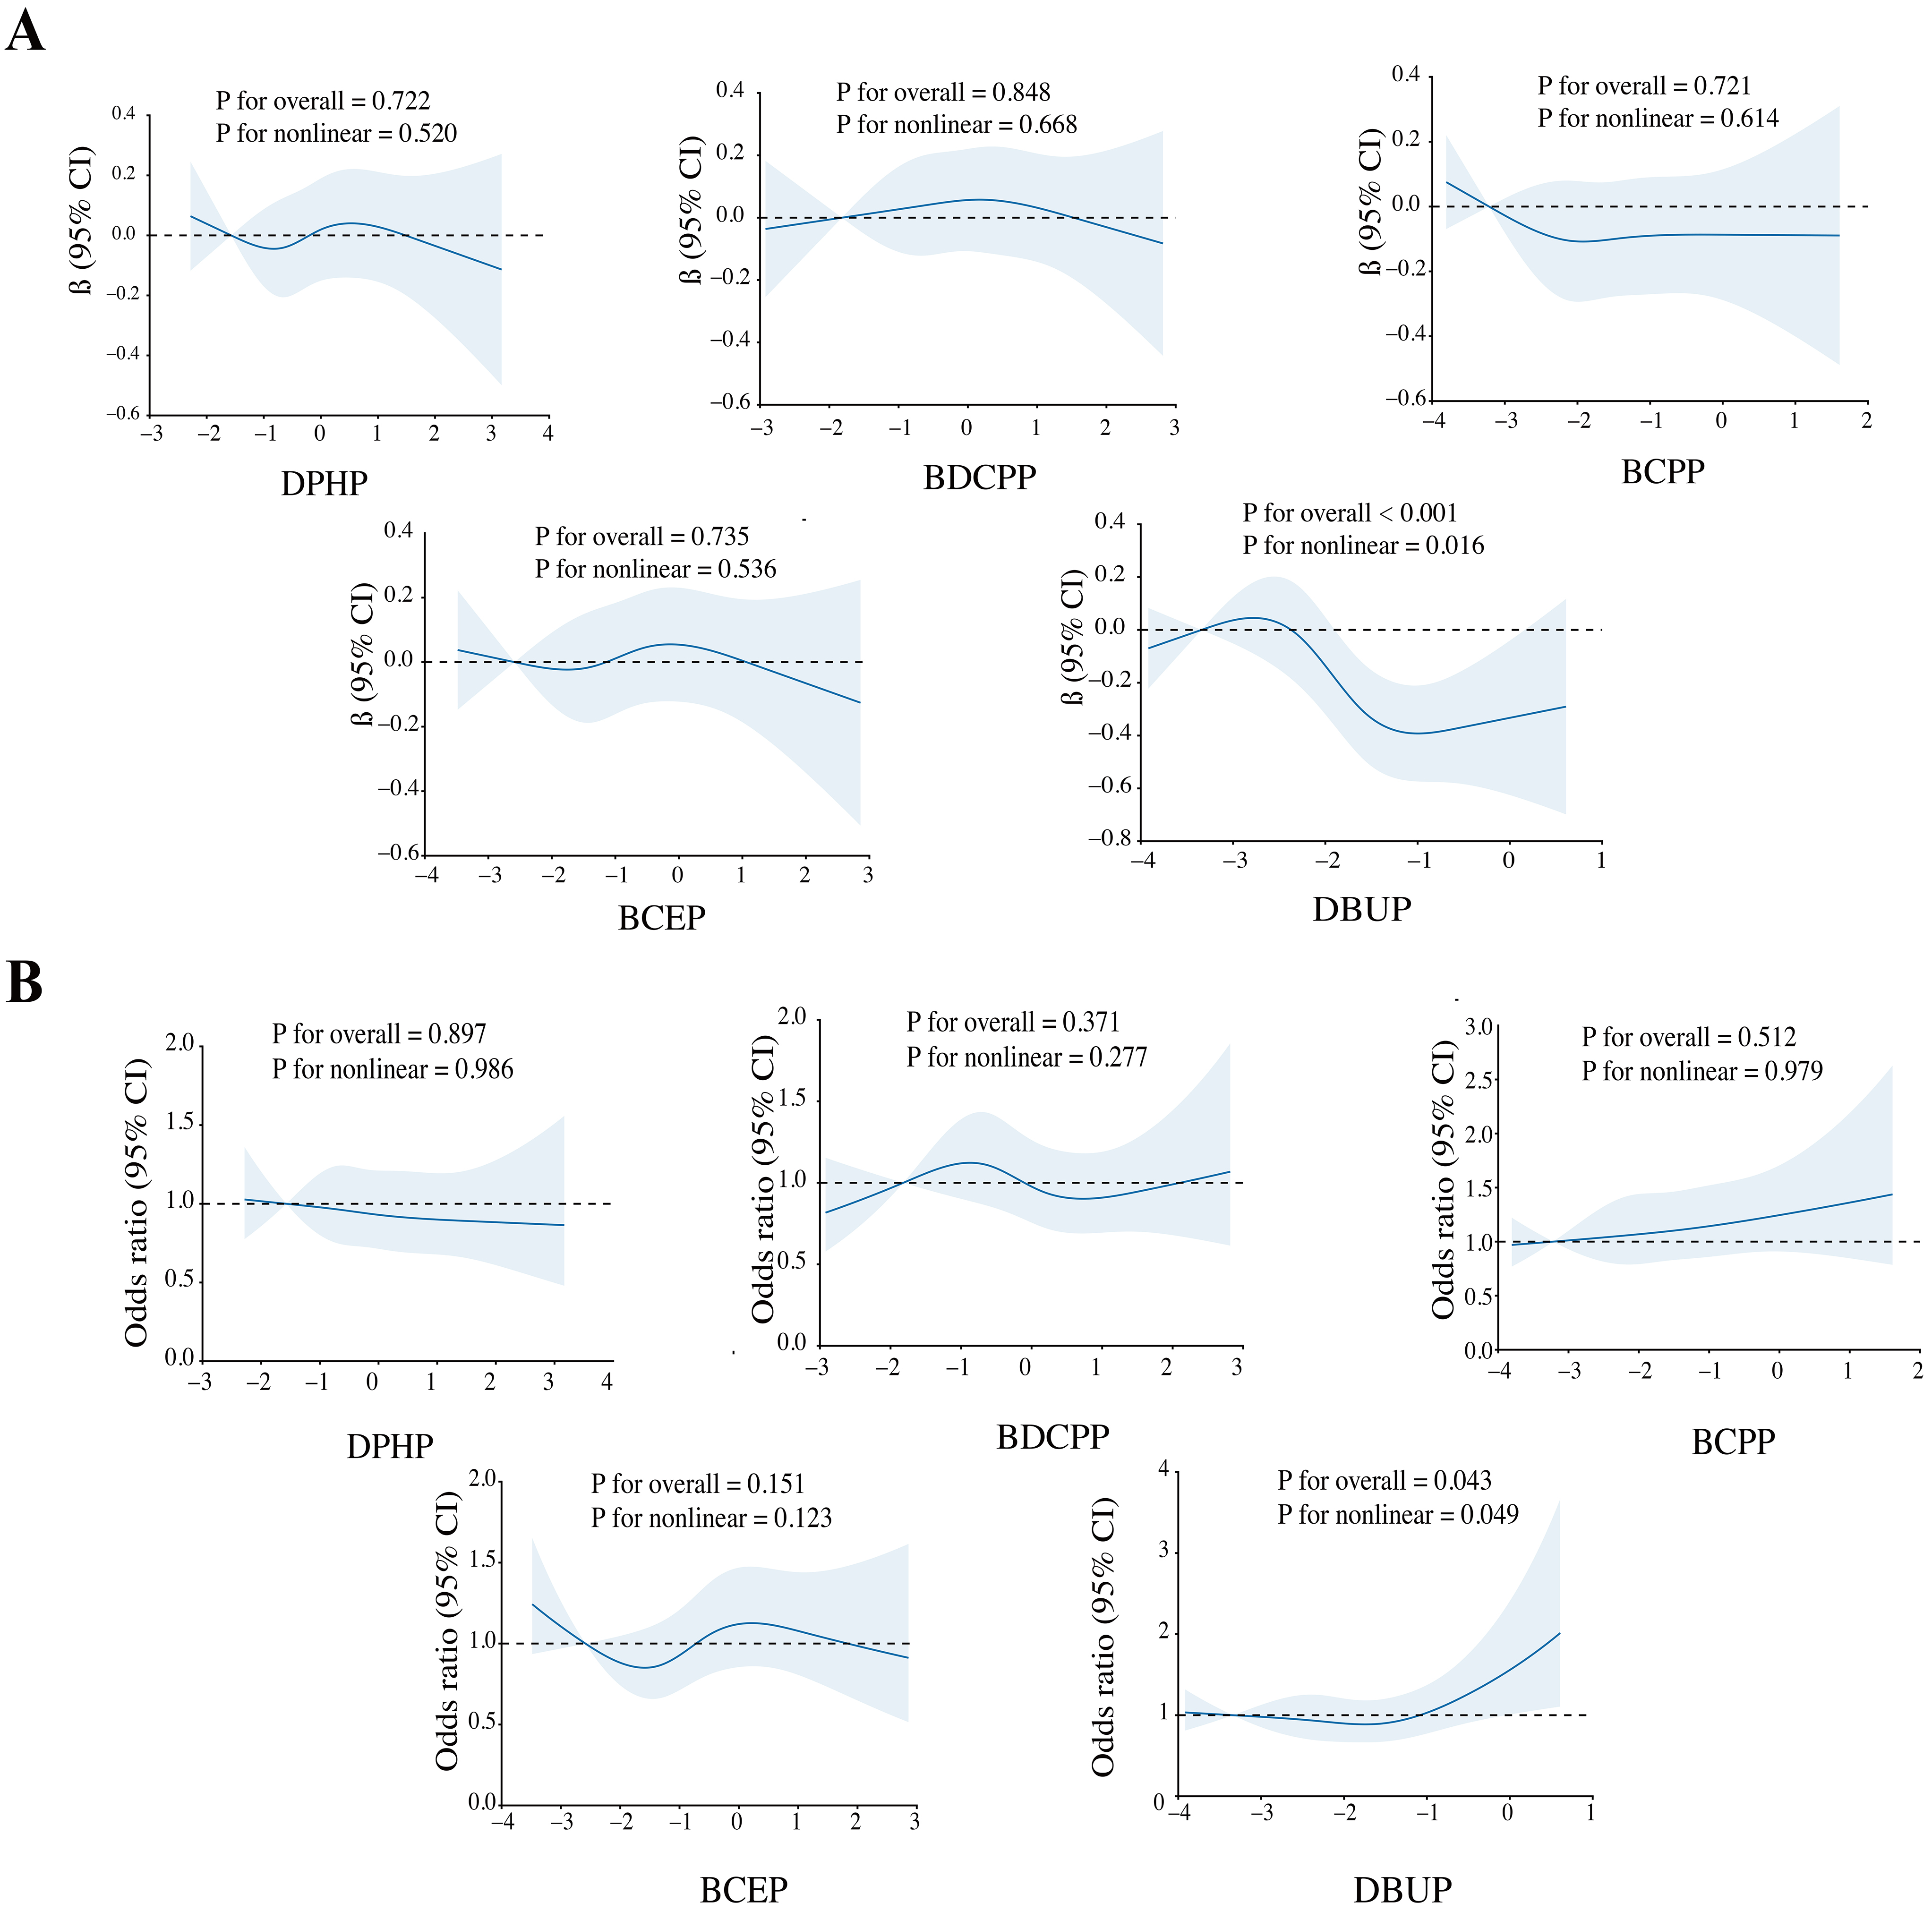
Figure 1. Dose-response relationships between organophosphate ester (OPE) metabolite concentrations and sleep duration (A) and sleep problems (B). The models were adjusted for covariates including age, sex, race, education, body mass index (BMI), marital status, alcohol consumption status, smoking status, and poverty-income ratio (PIR). CI: Confidence interval; DPHP: diphenyl phosphate; BDCPP: bis(1,3-dichloro-2-propyl) phosphate; BCPP: bis(1-chloro-2-propyl) phosphate; BCEP: bis(2-chloroethyl) phosphate; DBUP: dibutyl phosphate.
Association of OPEs with sleep duration and problem stratified by age
Prior literature has documented that sleep patterns vary considerably with age[27,28]. Table 1 showed that concentrations of multiple OPE metabolites differed when grouped by age, further prompting stratified analyses of the associations between OPE metabolites and sleep duration and sleep problems by age. Similar to the overall results, DBUP was significantly and negatively associated with sleep duration in both age groups, with a stronger association observed in the elderly group. Furthermore, sleep problems were significantly negatively associated with BDCPP in the < 60 years group and significantly positively associated with BCPP in the ≥ 60 years group [Table 3].
Association of OPE metabolites with sleep duration and sleep problems group by agea
| Sleep duration | ||||
| < 60 years | ≥ 60 years | |||
| β (95%CI) | P-value | β (95%CI) | P-value | |
| DPHP | 0.01 (-0.07, 0.09) | 0.77 | -0.01 (-0.11, 0.10) | 0.91 |
| BDCPP | 0.00 (-0.07, 0.07) | 0.94 | 0.00 (-0.10, 0.10) | 0.99 |
| BCPP | 0.01 (-0.06, 0.08) | 0.76 | -0.07 (-0.18, 0.04) | 0.21 |
| BCEP | 0.04 (-0.02, 0.10) | 0.20 | -0.05 (-0.14, 0.04) | 0.29 |
| DBUP | -0.16 (-0.24, -0.07) | < 0.01 | -0.22 (-0.35, -0.09) | < 0.01 |
| Sleep problem | ||||
| < 60 years | ≥ 60 years | |||
| OR (95%CI) | P-value | OR (95%CI) | P-value | |
| DPHP | 0.93 (0.82, 1.06) | 0.29 | 1.01 (0.87, 1.16) | 0.92 |
| BDCPP | 0.88 (0.78, 0.99) | 0.03 | 1.13 (0.98, 1.30) | 0.09 |
| BCPP | 1.03 (0.92, 1.15) | 0.64 | 1.17 (1.01, 1.37) | 0.04 |
| BCEP | 1.02 (0.92, 1.13) | 0.67 | 1.06 (0.94, 1.20) | 0.33 |
| DBUP | 1.07 (0.93, 1.23) | 0.34 | 1.09 (0.92, 1.31) | 0.32 |
BKMR analysis of OPE co-exposure in relation to sleep duration and sleep problems
We further performed a BKMR model to assess the effects of OPE mixture exposure on sleep-related indicators. OPE mixture exposure showed a significant negative association with sleep duration [Figure 2A] and a positive trend with sleep problems [Figure 2B]. Figure 3 indicated a potential interaction between DBUP and BCEP. The effects of OPE mixture exposure on sleep-related indicators were further examined after stratification by age [Supplementary Figure 3]. For sleep duration, OPE mixture exposure was negatively associated with sleep duration in the < 60 years group. In the ≥ 60 years group, when the overall concentration of the five OPE metabolites was above the P50, sleep duration showed a decreasing trend with increasing OPE metabolite concentrations. When the overall concentration exceeded the P75, sleep problems showed an increasing trend with increasing OPE metabolite concentrations in the ≥ 60 years group. These BKMR results extend the findings from single-pollutant regression models by capturing nonlinear dose-response relationships and potential joint effects among OPE metabolites. The quantile plots in Figure 2 illustrate that combined exposure to multiple OPEs was associated with reduced sleep duration and a tendency toward increased sleep problems, even after accounting for correlations among metabolites. This suggests that cumulative and interactive effects of OPE co-exposure may play a more important role in influencing sleep health than individual chemicals alone.
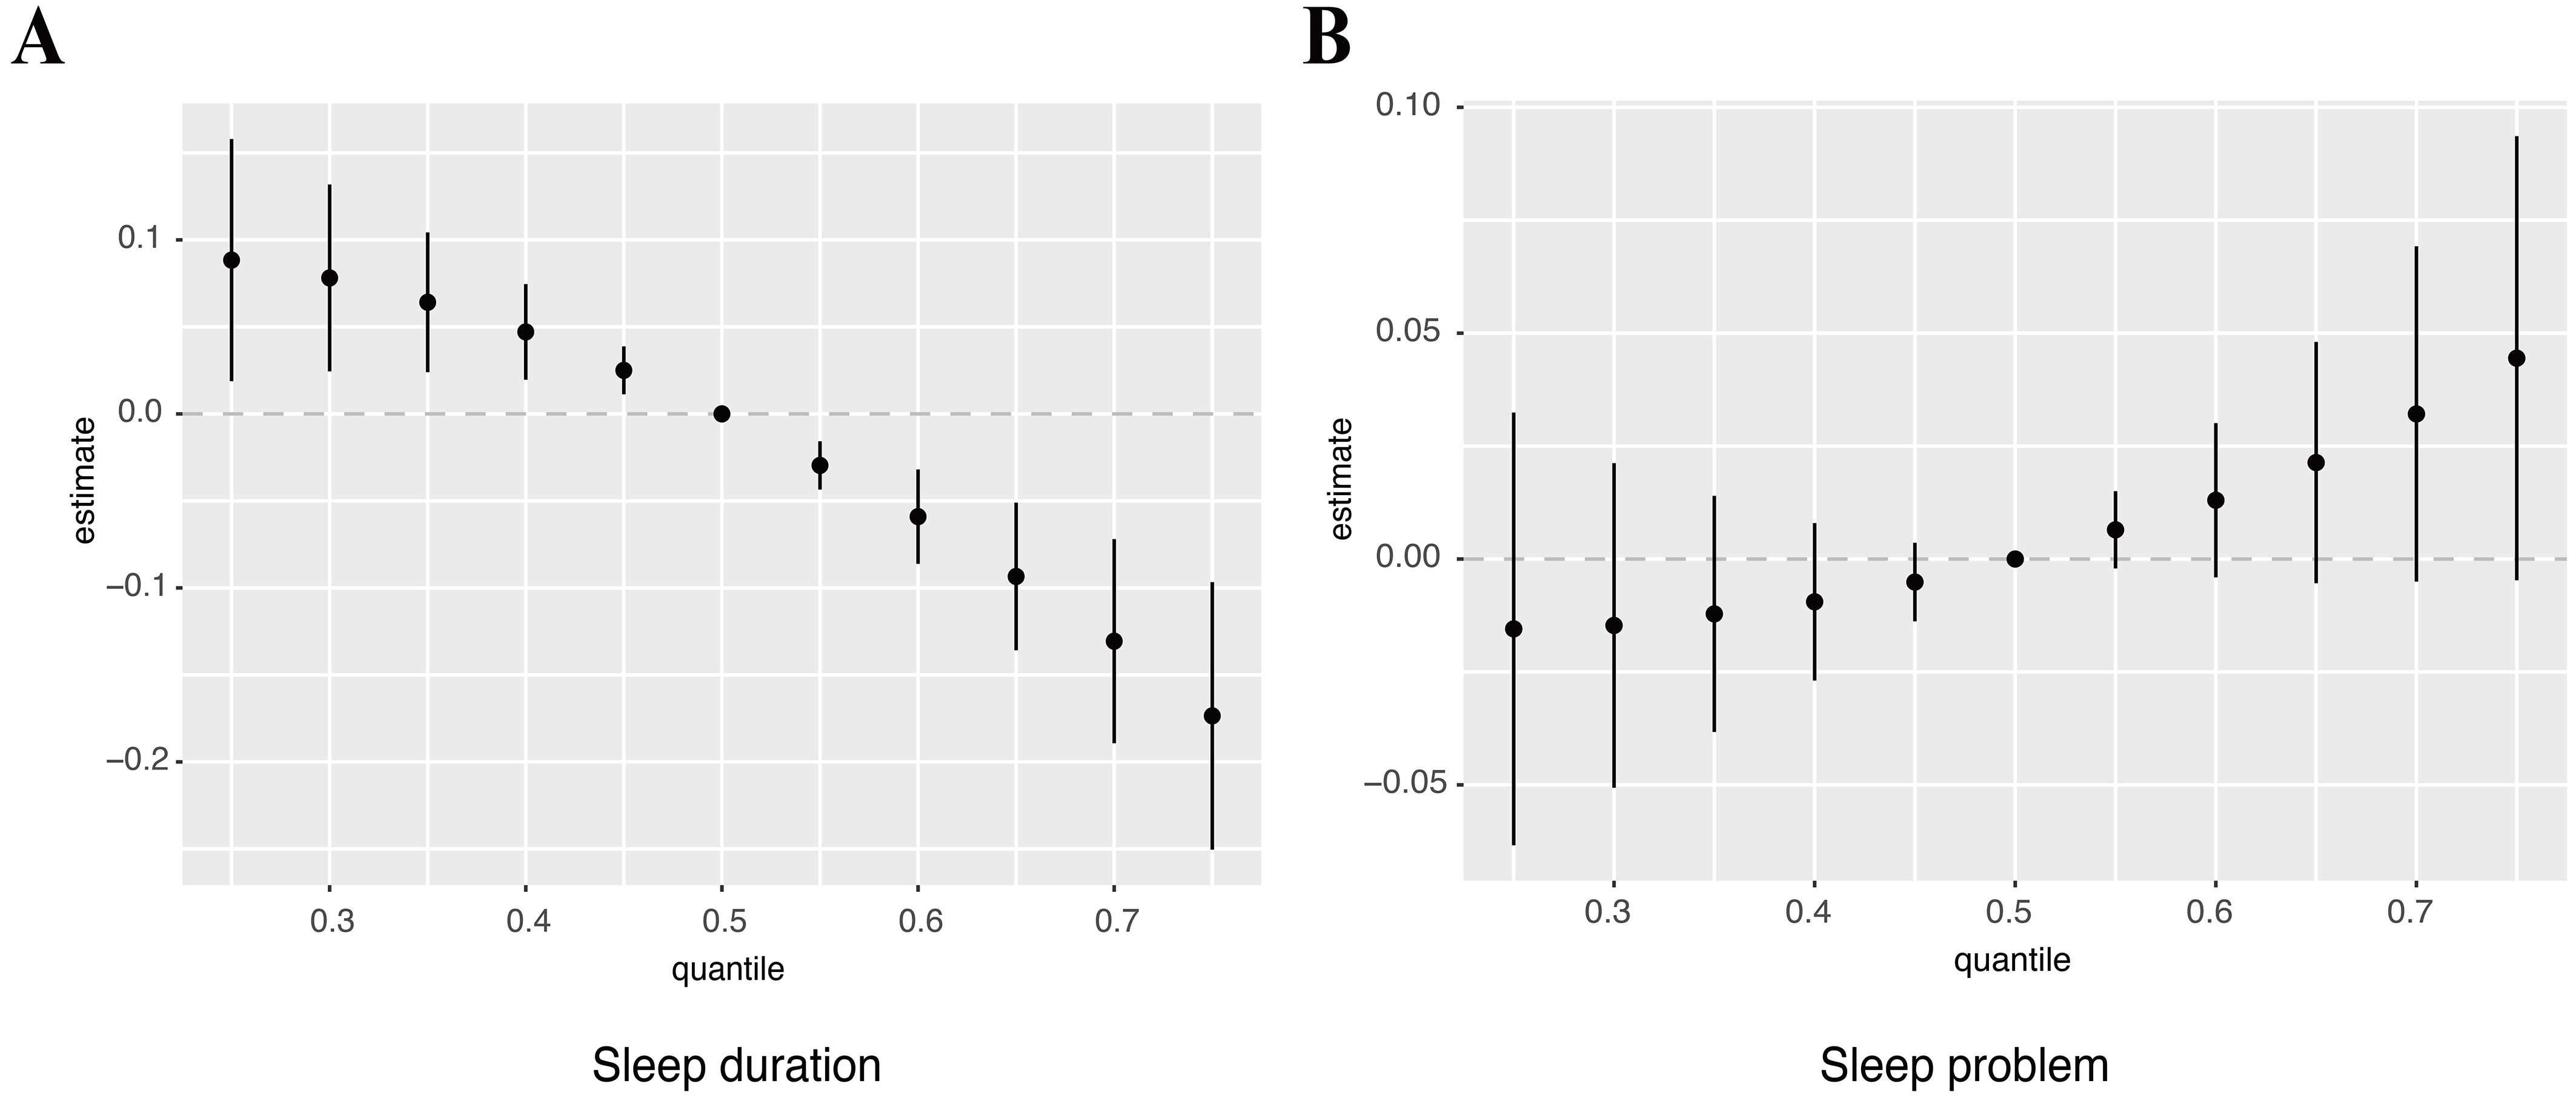
Figure 2. BKMR analysis showed associations between the overall OPE metabolite mixture and sleep duration (A) and sleep problems (B). The model was adjusted for covariates including age, sex, race, education, BMI, marital status, alcohol status, smoking status, and PIR. OPE: Organophosphate ester; BMI: body mass index; PIR: poverty-income ratio.
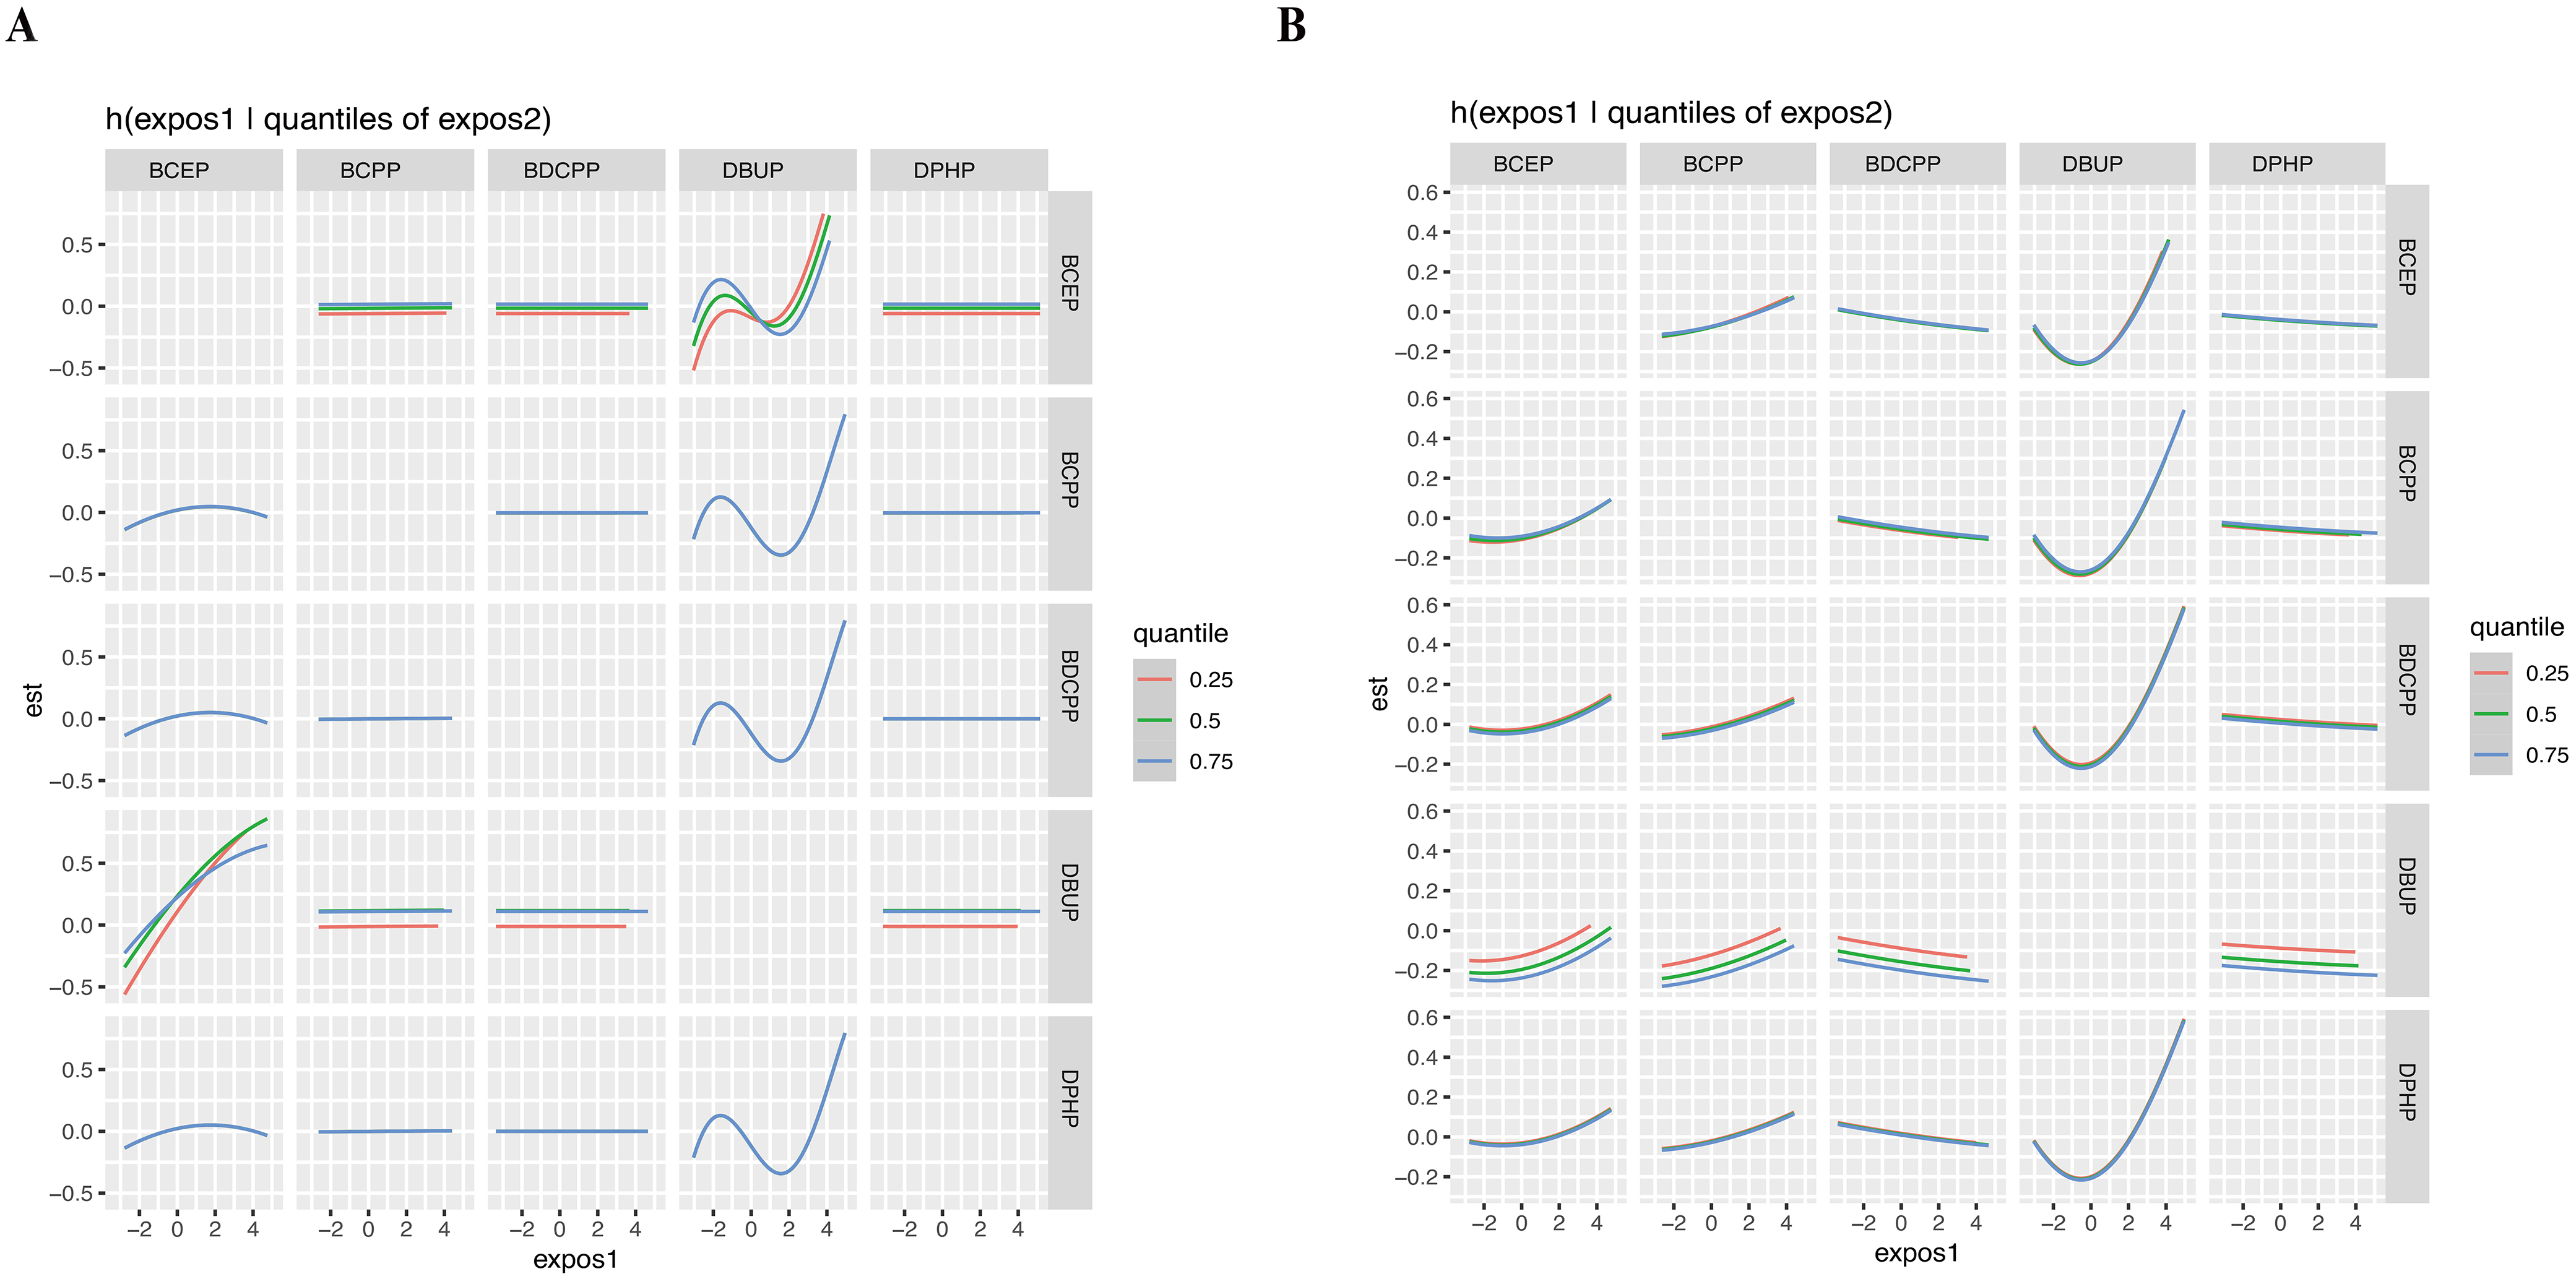
Figure 3. Bivariate exposure-response functions for individual OPE metabolite concentrations with sleep duration (A) and sleep problems (B) at different quartiles (25th, 50th, and 75th) of a second OPE metabolite, while all other OPE metabolites were fixed at their median levels, based on BKMR analysis. The model was adjusted for covariates including age, sex, race, education, BMI, marital status, alcohol status, smoking status, and PIR. OPE: Organophosphate ester; BKMR: Bayesian kernel machine regression; BMI: body mass index; PIR: poverty-income ratio; BCEP: bis(2-chloroethyl) phosphate; BCPP: bis(1-chloro-2-propyl) phosphate; BDCPP: bis(1,3-dichloro-2-propyl) phosphate; DBUP: dibutyl phosphate; DPHP: diphenyl phosphate.
WQS model evaluating OPE co-exposure in relation to sleep duration and sleep problems
The WQS regression results are summarized in Figure 4. In the overall population, higher OPE mixture exposure was significantly associated with shorter sleep duration (β = -0.16; 95%CI: -0.27, -0.06; P < 0.01), with DBUP contributing the greatest weight. In contrast, the OPE mixture was not significantly associated with sleep problems in the WQS model (OR = 1.04; 95%CI: 0.86, 1.24; P = 0.71), although BDCPP had the largest weight in the mixture index.
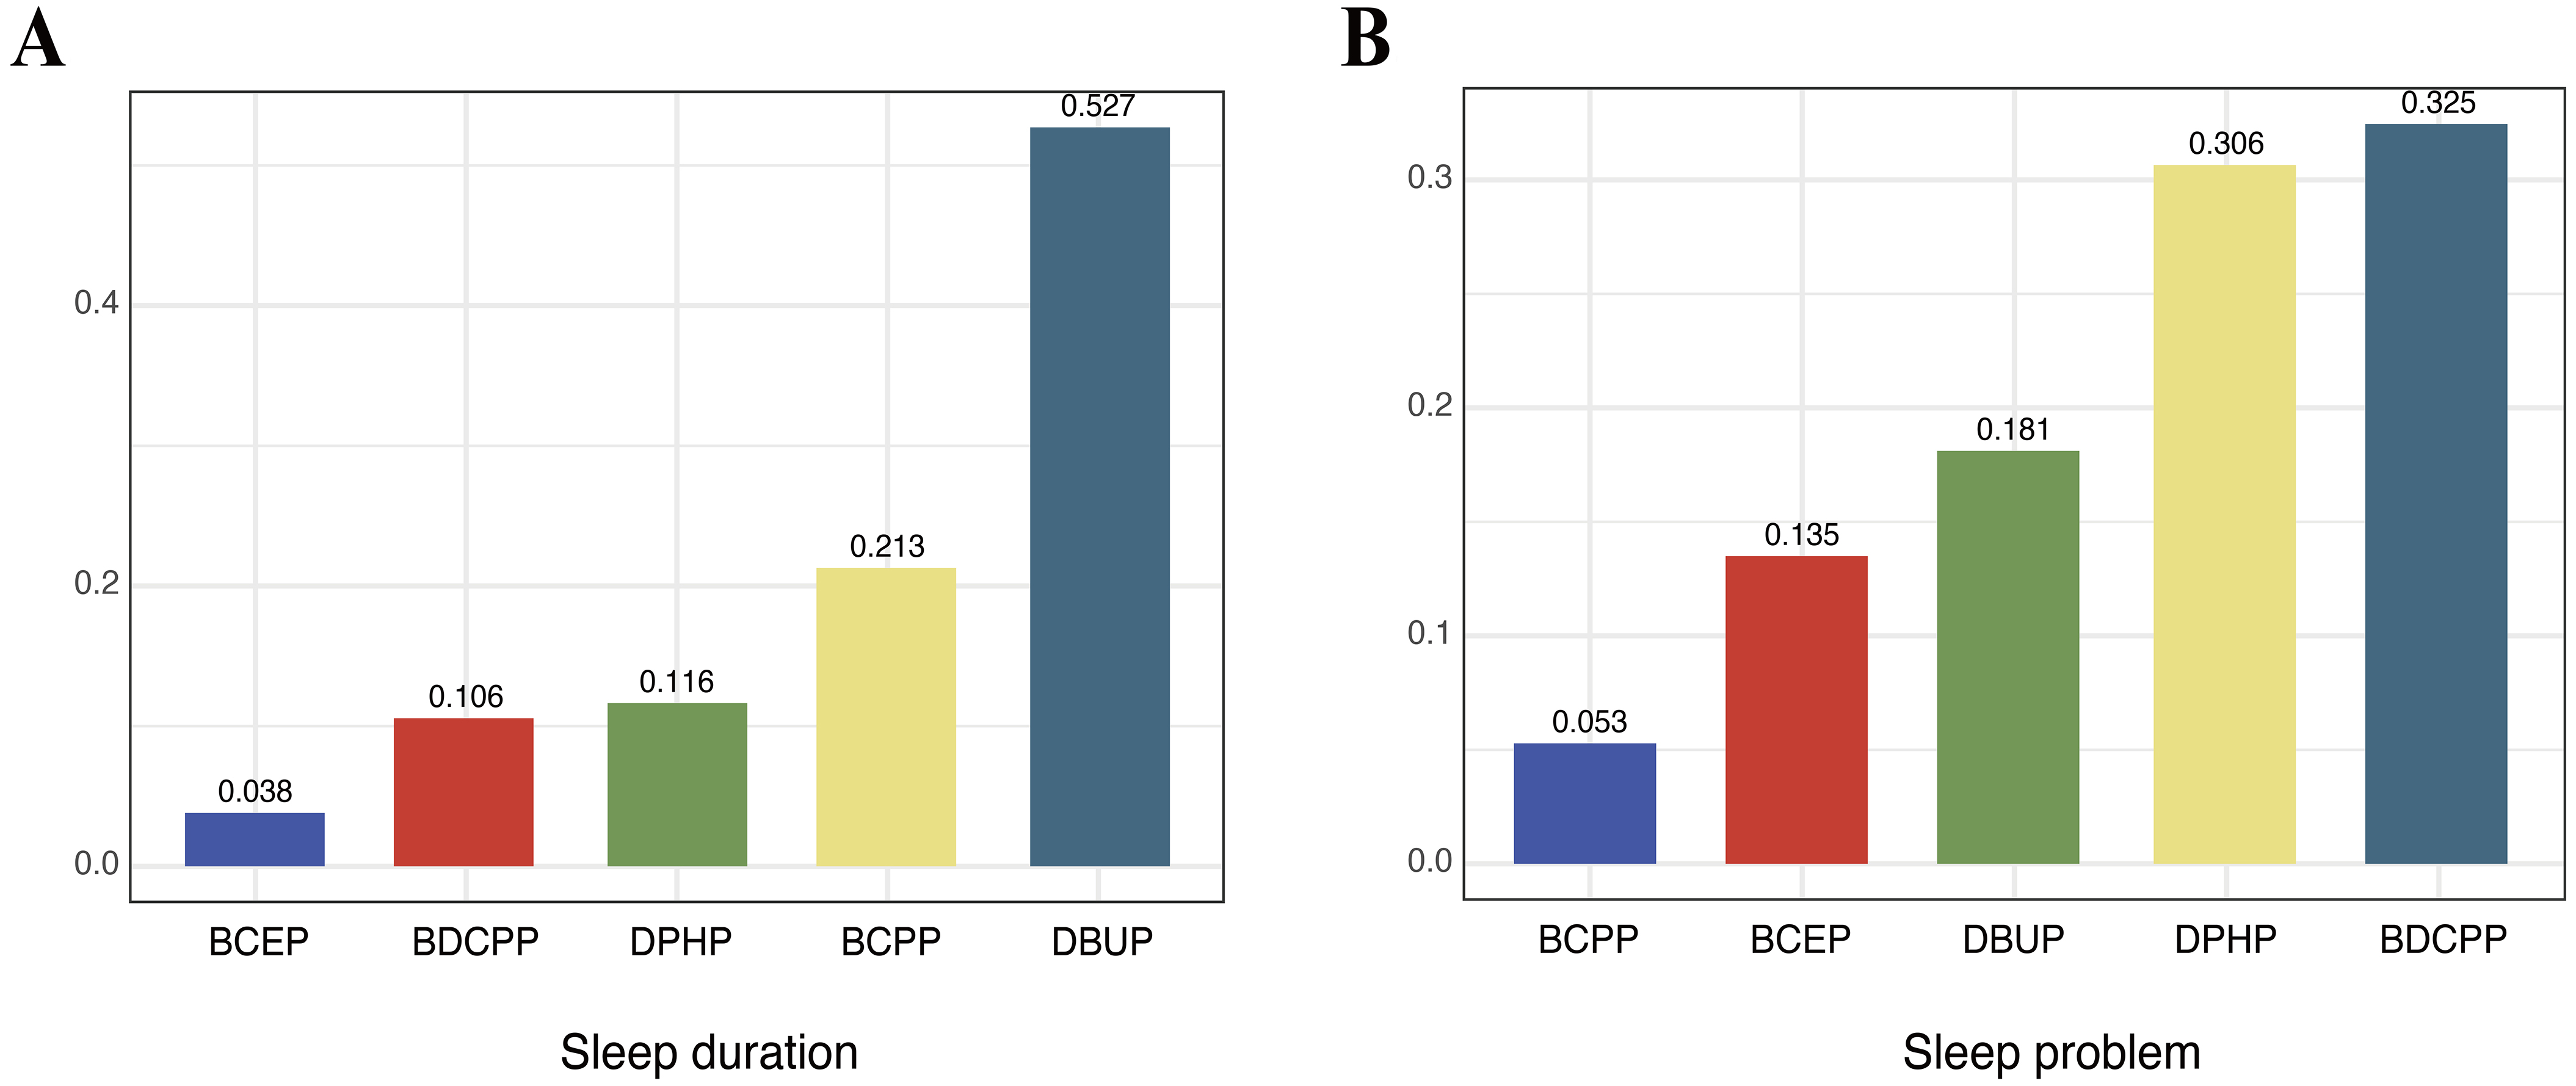
Figure 4. Weighted quantile sum (WQS) model weights of OPE metabolites for sleep duration in the negative direction (A) and for sleep problems in the positive direction (B). The model was adjusted for covariates including age, sex, race, education, BMI, marital status, alcohol status, smoking status, and PIR. OPE: Organophosphate ester; BMI: body mass index; PIR: poverty-income ratio; BCEP: bis(2-chloroethyl) phosphate; BDCPP: bis(1,3-dichloro-2-propyl) phosphate; DPHP: diphenyl phosphate; BCPP: bis(1-chloro-2-propyl) phosphate; DBUP: dibutyl phosphate.
Age-stratified models showed consistent results for sleep duration. In both age groups, higher OPE mixture exposure was associated with shorter sleep duration, with DBUP again contributing the most weight (< 60 years: β = -0.16; 95%CI: -0.27, -0.04; P < 0.01; ≥ 60 years: β = -0.21; 95%CI: -0.38, -0.04; P = 0.02) [Supplementary Figure 4A and B]. For sleep problems, associations with the mixture were not statistically significant in either subgroup (< 60 years: OR = 0.95; 95%CI: 0.80, 1.13; P = 0.57; ≥ 60 years: OR = 1.15; 95%CI: 0.88, 1.49; P = 0.31). At the component level, BDCPP was inversely associated with sleep problems in participants < 60 years, whereas BCPP was positively associated in those ≥ 60 years [Table 2, Supplementary Figure 4C and D]. These opposite age-specific trends may reflect differences in exposure sources and metabolic capacity (e.g., greater TDCPP/BDCPP exposure from newer consumer products in younger adults vs. accumulation of TCPP/BCPP with aging). Notably, the dominant contributors differed: BDCPP carried the greatest weight among participants < 60 years, whereas DPHP contributed most strongly among those ≥ 60 years [Supplementary Figure 4C and D]. Although DBUP had the largest weight in the mixture index, the overall WQS association for sleep problems was not statistically significant, possibly due to weaker or opposing effects of other metabolites that offset the mixture signal. The associations were generally consistent in direction, with higher OPE exposure related to shorter sleep duration and an increased likelihood of sleep problems. The differences in effect magnitude may reflect the nature of the outcomes, as sleep duration is a continuous behavioral measure, whereas sleep problems represent broader self-reported complaints that may include both transient and persistent difficulties.
Discussion
Using data from a nationally representative cohort of U.S. adults, our analysis identified consistent links between urinary OPE metabolites and sleep outcomes. Higher levels of DBUP were associated with shorter sleep duration and an increased probability of sleep problems. In mixture analyses, co-exposure to several OPEs was also related to reduced sleep duration. Age-stratified results suggested that these associations were stronger in older adults, pointing to potential vulnerability in this group. Overall, these findings suggest that urinary OPE metabolites may serve as environmental correlates of sleep health rather than causal determinants.
The biological mechanisms underlying the observed associations between OPE exposure and sleep outcomes remain to be fully elucidated, but several plausible pathways have been proposed. First, OPEs are known neurotoxicants that can interfere with cholinergic and GABAergic neurotransmission, potentially disturbing the neural circuits that regulate the sleep-wake cycle[17]. Second, OPEs act as endocrine-disrupting chemicals that influence thyroid and sex hormone levels, both of which are involved in sleep regulation[11]. Third, experimental studies have demonstrated that OPE exposure induces oxidative stress and neuroinflammation in the central nervous system, processes closely linked to sleep disruption[29]. Finally, OPEs may affect melatonin synthesis or circadian rhythm-related genes through alterations in tryptophan metabolism or hormone pathways[30]. These mechanisms collectively provide biological plausibility for the association observed in our study.
The regulation of sleep is a highly complex and integrated function involving multiple brain regions and neurotransmitters. Sleep problems have been associated with various neurological disorders[31]. In this study, DBUP was negatively associated with sleep duration. Interestingly, RCS results showed that DBUP had a nonlinear relationship with sleep-related indicators. The high concentration of DBUP tended to correlate positively with self-reported sleep problems, while negatively correlated with sleep duration. The corresponding parent compounds of DBUP are TNBP[32]. Previous studies have shown that TNBP is one of the more exposed OPEs in the living environment[33]. TNBP exposure has been shown to be associated with multiple health impairments such as lung damage and reproductive toxicity[29,30].
TNBP has been likewise shown to be associated with neural damage and sleep problems. Wild-type nematode (N2) larvae exposed to TNBP (0, 0.1, 1, 10 and 20 mg/L) for 72 h have shown suppressed body length and width, decreased neurobehavior, increased ROS production, and altered expression of genes related to mitochondrial oxidative stress and the P38 mitogen-activated protein kinase (p38MAPK) signaling pathway[16]. In earthworms, TNBP was shown to accumulate within brain ganglia, accompanied by reductions in glutamate levels and marked suppression of Na⁺/K⁺-ATPase and Ca2+-ATPase activities relative to controls[34]. Glutamate is also one of the neurotransmitters that play an important role in sleep[35]. Thus, TNBP may influence sleep-related neurotransmitters in experimental models, which could help explain the observed associations with sleep quality in humans.
We additionally observed that BCPP was positively associated with sleep problems among older adults aged ≥ 60 years. This finding aligns with evidence that oxidative stress is both a driver and a consequence of disturbed sleep, creating a bidirectional cycle that worsens sleep quality[31]. Prior studies have reported that bis(2-chloroethyl) phosphate (BCEtp), BCPP, and DPHP are linked to elevated oxidative stress biomarkers, such as 8-isoprostane and 8-hydroxy-2'-deoxyguanosine (8-OHdG), supporting this interpretation[36]. The corresponding parent compounds of BCPP are tris(2-chloro-isopropyl) phosphate (TCPP)[37]. The study has demonstrated that TCPP treatment significantly reduces the serotonin level in earthworms and induces oxidative stress and affects energy metabolism, leading to weight loss in earthworms[18]. Serotonin homeostasis has an important role in sleep regulation[19]. As for differences between groups caused by age, it may be that the sleep disorders become more pronounced with increasing age[38]. Epidemiological studies have shown that unfavorable environmental factors may disrupt sleep levels in old age[39]. In addition, because OPEs are widely present in indoor consumer products, longer time spent indoors and reduced mobility among the elderly may increase cumulative exposure, further elevating their vulnerability. Recent studies indicate that older adults spend a greater share of time indoors, while indoor air and house dust are established reservoirs of OPEs; biomonitoring in elderly cohorts also links OPE body burdens with indoor air/dust concentrations[40].
Our findings are broadly consistent with and extend prior work. Kang et al.reported associations between OPE metabolites and sleep disorders in U.S. adults using machine learning methods, identifying DBUP as an influential exposure[41]. While their study relied on a smaller sample and different analytical strategies, our analysis incorporated a larger NHANES dataset from 2013-2016 and applied both conventional regression and advanced mixture approaches. The convergence of results across studies strengthens the evidence that DBUP and other OPE metabolites are relevant to sleep health. Beyond OPEs, evidence from other chemical classes also points toward sleep disruption as an underrecognized outcome of environmental exposure. For instance, Guo et al. found that higher serum PFAS [particularly perfluorooctane sulfonate (PFOS)] was inversely associated with trouble sleeping and sleep disorders in U.S. adults participating in NHANES[15]. Similarly, a study of U.S. adolescents using 2005-2010 NHANES data reported that elevated urinary phthalate metabolites were associated with shorter sleep duration[42], and the magnitude of these associations was comparable to that observed in our study (approximately a 10-minute reduction in sleep duration). Together with our results, these findings underscore the need to systematically evaluate environmental pollutants as potential determinants of sleep health. The public health implications of these associations are considerable. Sleep disturbances already affect 50-70 million adults in the United States and are linked to increased risks of cardiovascular disease, obesity, type 2 diabetes, and mental health disorders. Even modest shifts in sleep duration at the population level can therefore translate into substantial morbidity and economic costs. Because OPEs are widely present in household items such as furniture, electronics, and plastics, exposure is nearly unavoidable. Our findings that older adults appear more vulnerable suggest that susceptible subgroups may face disproportionate risks. Given that aging itself is accompanied by biological changes in circadian regulation and sleep architecture, additional exposure to neurotoxic chemicals could exacerbate age-related declines in sleep quality.
While causal inference cannot be drawn, these associations underscore the need for further longitudinal research and potential exposure reduction efforts, particularly in vulnerable populations.
Mechanistically, our study adds plausibility to prior toxicological research. The observed nonlinear associations for DBUP may reflect threshold effects in oxidative stress or neurotransmitter disruption, consistent with experimental evidence linking TNBP exposure to increased ROS, altered glutamate homeostasis, and impaired ATPase function in neural tissues. Similarly, the positive association of BCPP with sleep problems in older adults may be explained by its parent compound TCPP, which has been shown to reduce serotonin levels and impair energy metabolism in animal models. Since glutamate, GABA, and serotonin are all central to the regulation of sleep, interference with these pathways offers a biologically coherent explanation for our epidemiological results.
From a policy perspective, these findings highlight a critical need to broaden the scope of chemical risk assessment. Current regulatory frameworks often emphasize reproductive or developmental toxicity endpoints while overlooking sleep and other neurobehavioral outcomes. Incorporating sleep health into chemical safety evaluations could better capture the true burden of exposure. In addition, interventions aimed at reducing OPE exposure in indoor environments, for example, through safer material substitutions, improved ventilation, or stricter labeling requirements, may yield benefits not only for reproductive and developmental outcomes but also for sleep and overall well-being. Future studies should focus on longitudinal designs, biomarker panels integrating oxidative stress and neurotransmitter profiles, and vulnerable subgroups such as the elderly, children, and those with preexisting sleep disorders.
A major strength of our study lies in the application of multiple complementary statistical approaches. By integrating both conventional regression models and advanced mixture modeling techniques, such as BKMR and WQS, we were able to address methodological challenges that traditional epidemiologic tools often struggle with, including nonlinearity, correlations among exposures, and potential interaction effects. Notably, the mixture models yielded results consistent with those from standard regression, reinforcing the robustness of our findings. We found that combined exposure to OPEs was inversely associated with sleep duration, while a suggestive positive association with sleep problems was also apparent. Furthermore, the identification of a nonlinear dose-response pattern for DBUP with sleep indicators provides additional insight into possible mechanisms underlying OPE-related sleep disturbances. The non-linear exposure-response pattern observed for DBUP may also reflect threshold or compensatory mechanisms, where low-level exposures activate adaptive responses, whereas higher exposures may overwhelm these mechanisms and impair sleep regulation.
From a public health perspective, these findings highlight the need to reduce OPE exposure in everyday environments. Indoor air, household dust, and consumer products such as furniture, electronic devices, building materials, and plastic goods are major contributors to indoor OPE levels. Practical actions including improving ventilation, minimizing the use of OPE-containing materials, promoting safer alternatives, and frequent cleaning to reduce dust accumulation may help lower OPE exposure and associated health risks.
Limitations
This study has several limitations that should be acknowledged. First, urinary metabolites were measured at a single time point and may not fully capture long-term or chronic exposure, whereas sleep problems are typically persistent conditions that may require repeated exposure assessment to confirm associations. Second, the cross-sectional design prevents us from establishing temporality or causality between OPE exposure and sleep-related outcomes. Because urinary OPE metabolites and sleep indicators were obtained during the same NHANES examination visit, temporal ordering cannot be established, and the observed relationships should be interpreted as associations rather than causal effects. Third, information on sleep relied on self-reported questionnaire data, which introduces the possibility of recall bias. Finally, our models did not account for other environmental chemical exposures such as PFAS, phthalates, or heavy metals, all of which have been linked to sleep health in prior studies. The absence of these co-exposures as covariates may lead to residual confounding and could partly explain the observed associations. Future longitudinal studies incorporating a broader range of environmental contaminants and mechanistic biomarkers (e.g., oxidative stress, inflammation, and endocrine indicators) are needed to comprehensively evaluate the temporal and biological pathways linking OPE exposure to sleep outcomes.
CONCLUSIONS
In summary, our findings suggest that urinary biomarkers of OPE exposure are statistically associated with sleep disturbances in the U.S. general population. Evidence from mixture analyses further indicates potential relationships between combined exposure to multiple OPEs and sleep health. Nevertheless, given the cross-sectional design of this study, these associations should not be interpreted as causal.
DECLARATIONS
Authors’ contributions
Conceptualization: Shan, T.; Chen, T.; Chen, L.; Nie, J.; Niu, P.
Writing-original draft: Shan, T.
Formal analysis: Shan, T.
Software: Shan, T.
Supervision: Chen, T.; Niu, P.
Methodology: Wang, X.; Zhang, G.; Ma, T.; Chen, L.; Nie, J.; Niu, P.
Validation: Wang, X.
Investigation: Ma, T.
Writing-review and editing: Nie, J.; Niu, P.
Availability of data and materials
The datasets analyzed during the current study are publicly available from the National Health and Nutrition Examination Survey (NHANES, https://www.cdc.gov/nchs/nhanes/index.htm).
Financial support and sponsorship
This study was supported by the Open Project Fund from Key Laboratory of Coal Environmental Pathogenicity and Prevention (Shanxi Medical University), Ministry of Education, China (MEKLCEPP/SXMU-202504).
Conflicts of interest
All authors declared that there are no conflicts of interest.
Ethical approval and consent to participate
The NHANES study protocol was approved by the National Center for Health Statistics (NCHS) Research Ethics Review Board of the U.S. Centers for Disease Control and Prevention (CDC) (Protocol #2011-17). All participants provided written informed consent prior to participation.
Consent for publication
Not applicable.
Copyright
© The Author(s) 2026.
Supplementary Materials
REFERENCES
1. Saillenfait, A. M.; Ndaw, S.; Robert, A.; Sabaté, J. P. Recent biomonitoring reports on phosphate ester flame retardants: a short review. Arch. Toxicol. 2018, 92, 2749-78.
2. Hammel, S. C.; Zhang, S.; Lorenzo, A. M.; Eichner, B.; Stapleton, H. M.; Hoffman, K. Young infants’ exposure to organophosphate esters: breast milk as a potential source of exposure. Environ. Int. 2020, 143, 106009.
3. Onoja, S.; Nel, H. A.; Abdallah, M. A.; Harrad, S. Microplastics in freshwater sediments: Analytical methods, temporal trends, and risk of associated organophosphate esters as exemplar plastics additives. Environ. Res. 2022, 203, 111830.
4. Tao, F.; Tan, Y.; Lu, Q.; et al. A natural environmental chamber study on the emissions and fate of organophosphate esters in the indoor environment. Sci. Total. Environ. 2022, 827, 154280.
5. Bi, R.; Meng, W.; Su, G. Organophosphate esters (OPEs) in plastic food packaging: non-target recognition, and migration behavior assessment. Environ. Int. 2023, 177, 108010.
6. Gbadamosi, M. R.; Abdallah, M. A.; Harrad, S. A critical review of human exposure to organophosphate esters with a focus on dietary intake. Sci. Total. Environ. 2021, 771, 144752.
7. Balasch, A.; Moreno, T.; Eljarrat, E. Assessment of daily exposure to organophosphate esters through PM2.5 inhalation, dust ingestion, and dermal contact. Environ. Sci. Technol. 2023, 57, 20669-77.
8. Bi, R.; Su, G. Dietary intake assessment of known and unknown organophosphate esters (OPEs) in foodstuffs via high-resolution mass spectrometry. Sci. Total. Environ. 2023, 854, 158452.
9. Hernandez-Castro, I.; Eckel, S. P.; Howe, C. G.; et al. Sex-specific effects of prenatal organophosphate ester (OPE) metabolite mixtures and adverse infant birth outcomes in the maternal and developmental risks from environmental and social stressors (MADRES) pregnancy cohort. Environ. Res. 2023, 226, 115703.
10. Hales, B. F.; Robaire, B. Effects of brominated and organophosphate ester flame retardants on male reproduction. Andrology 2020, 8, 915-23.
11. Li, Y.; Fu, Y.; Hu, K.; et al. Positive correlation between human exposure to organophosphate esters and gastrointestinal cancer in patients from Wuhan, China. Ecotoxicol. Environ. Saf. 2020, 196, 110548.
12. Percy, Z.; Chen, A.; Yang, W.; et al. Childhood urinary organophosphate esters and cognitive abilities in a longitudinal cohort study. Environ. Res. 2022, 215, 114265.
13. Albers, J. A.; Chand, P.; Anch, A. M. Multifactorial sleep disturbance in Parkinson’s disease. Sleep. Med. 2017, 35, 41-8.
14. Atrooz, F.; Salim, S. Sleep deprivation, oxidative stress and inflammation. Adv. Protein. Chem. Struct. Biol. , 119, 309-36.
15. Guo, P.; Jin, Z.; Bellia, G.; et al. Per- and polyfluoroalkyl substances and sleep health in U.S. adults, NHANES 2005-2014. Environ. Res. 2023, 237, 117092.
16. Tang, J.; Qin, J.; Kuerban, G.; et al. Effects of tri-n-butyl phosphate (TnBP) on neurobehavior of Caenorhabditis elegans. Environ. Sci. Pollut. Res. Int. 2023, 30, 85578-91.
17. Patisaul, H. B.; Behl, M.; Birnbaum, L. S.; et al. Beyond cholinesterase inhibition: developmental neurotoxicity of organophosphate ester flame retardants and plasticizers. Environ. Health. Perspect. 2021, 129, 105001.
18. Gao, Y.; Wang, L.; Zhang, X.; et al. Similarities and differences among the responses to three chlorinated organophosphate esters in earthworm: evidences from biomarkers, transcriptomics and metabolomics. Sci. Total. Environ. 2022, 815, 152853.
20. Bobb, J. F.; Valeri, L.; Claus, Henn. B.; et al. Bayesian kernel machine regression for estimating the health effects of multi-pollutant mixtures. Biostatistics 2015, 16, 493-508.
21. Tanner, E. M.; Bornehag, C. G.; Gennings, C. Repeated holdout validation for weighted quantile sum regression. MethodsX 2019, 6, 2855-60.
22. Jayatilaka, N. K.; Restrepo, P.; Williams, L.; Ospina, M.; Valentin-Blasini, L.; Calafat, A. M. Quantification of three chlorinated dialkyl phosphates, diphenyl phosphate, 2,3,4,5-tetrabromobenzoic acid, and four other organophosphates in human urine by solid phase extraction-high performance liquid chromatography-tandem mass spectrometry. Anal. Bioanal. Chem. 2017, 409, 1323-32.
23. Huang, Q.; Wan, J.; Nan, W.; Li, S.; He, B.; Peng, Z. Association between manganese exposure in heavy metals mixtures and the prevalence of sarcopenia in US adults from NHANES 2011-2018. J. Hazard. Mater. 2024, 464, 133005.
24. Shen, R.; Zou, T. The association between cardiovascular health and depression: Results from the 2007-2020 NHANES. Psychiatry. Res. 2024, 331, 115663.
25. Dong, L.; Xie, Y.; Zou, X. Association between sleep duration and depression in US adults: A cross-sectional study. J. Affect. Disord. 2022, 296, 183-8.
26. Taibl, K. R.; Schantz, S.; Aung, M. T.; et al. Associations of per- and polyfluoroalkyl substances (PFAS) and their mixture with oxidative stress biomarkers during pregnancy. Environ. Int. 2022, 169, 107541.
27. Prall, S. P.; Yetish, G.; Scelza, B. A.; Siegel, J. M. The influence of age- and sex-specific labor demands on sleep in Namibian agropastoralists. Sleep. Health. 2018, 4, 500-8.
28. Hokett, E.; Arunmozhi, A.; Campbell, J.; Verhaeghen, P.; Duarte, A. A systematic review and meta-analysis of individual differences in naturalistic sleep quality and episodic memory performance in young and older adults. Neurosci. Biobehav. Rev. 2021, 127, 675-88.
29. Meng, Y.; Xu, X.; Xie, G.; et al. Alkyl organophosphate flame retardants (OPFRs) induce lung inflammation and aggravate OVA-simulated asthmatic response via the NF-кB signaling pathway. Environ. Int. 2022, 163, 107209.
30. Zhang, H.; Liu, T.; Song, X.; et al. Study on the reproductive toxicity and mechanism of tri-n-butyl phosphate (TnBP) in Caenorhabditis elegans. Ecotoxicol. Environ. Saf. 2021, 227, 112896.
31. Bishir, M.; Bhat, A.; Essa, M. M.; et al. Sleep deprivation and neurological disorders. Biomed. Res. Int. 2020, 2020, 5764017.
32. Kim, H.; Rebholz, C. M.; Wong, E.; Buckley, J. P. Urinary organophosphate ester concentrations in relation to ultra-processed food consumption in the general US population. Environ. Res. 2020, 182, 109070.
33. Chupeau, Z.; Bonvallot, N.; Mercier, F.; Le, Bot. B.; Chevrier, C.; Glorennec, P. Organophosphorus flame retardants: a global review of indoor contamination and human exposure in Europe and epidemiological evidence. Int. J. Environ. Res. Public. Health. 2020, 17, 6713.
34. Jiang, X.; Yang, Y.; Liu, P.; Li, M. Transcriptomics and metabolomics reveal Ca2+ overload and osmotic imbalance-induced neurotoxicity in earthworms (Eisenia fetida) under tri-n-butyl phosphate exposure. Sci. Total. Environ. 2020, 748, 142169.
36. Ingle, M. E.; Watkins, D.; Rosario, Z.; et al. An exploratory analysis of urinary organophosphate ester metabolites and oxidative stress among pregnant women in Puerto Rico. Sci. Total. Environ. 2020, 703, 134798.
37. Louis, L. M.; Buckley, J. P.; Kuiper, J. R.; et al. Exposures to organophosphate esters and respiratory morbidity among school-aged children with asthma. Environ. Sci. Technol. 2023, 57, 6435-43.
38. Chen, J. H. Racial and ethnic trajectories of sleep disturbances: variations by age and cohort. J. Gerontol. A. Biol. Sci. Med. Sci. 2023, 78, 1897-907.
39. Leng, S.; Jin, Y.; Vitiello, M. V.; et al. The association between polluted fuel use and self-reported insomnia symptoms among middle-aged and elderly Indian adults: a cross-sectional study based on LASI, wave 1. BMC. Public. Health. 2023, 23, 1953.
40. Sattari, Z.; Weitkamp, G.; Meijering, L. What happens behind doors? J. Aging. Stud. 2023, 64, 101109.
41. Kang, X.; Li, J.; Luo, J.; Zhang, D. Associations between organophosphate esters metabolites and sleep disorder and trouble sleeping in adults: a machine-learning approach. Environ. Sci. Pollut. Res. Int. 2022, 29, 67287-300.
Cite This Article
How to Cite
Download Citation
Export Citation File:
Type of Import
Tips on Downloading Citation
Citation Manager File Format
Type of Import
Direct Import: When the Direct Import option is selected (the default state), a dialogue box will give you the option to Save or Open the downloaded citation data. Choosing Open will either launch your citation manager or give you a choice of applications with which to use the metadata. The Save option saves the file locally for later use.
Indirect Import: When the Indirect Import option is selected, the metadata is displayed and may be copied and pasted as needed.
About This Article
Copyright

Data & Comments
Data
0


Comments
Comments must be written in English. Spam, offensive content, impersonation, and private information will not be permitted. If any comment is reported and identified as inappropriate content by OAE staff, the comment will be removed without notice. If you have any queries or need any help, please contact us at [email protected].