

Impact of rainfall, snowpack and storms on contaminant levels in groundwater beneath two U.S. Superfund sites in New York
 0
0  ,
, Abstract
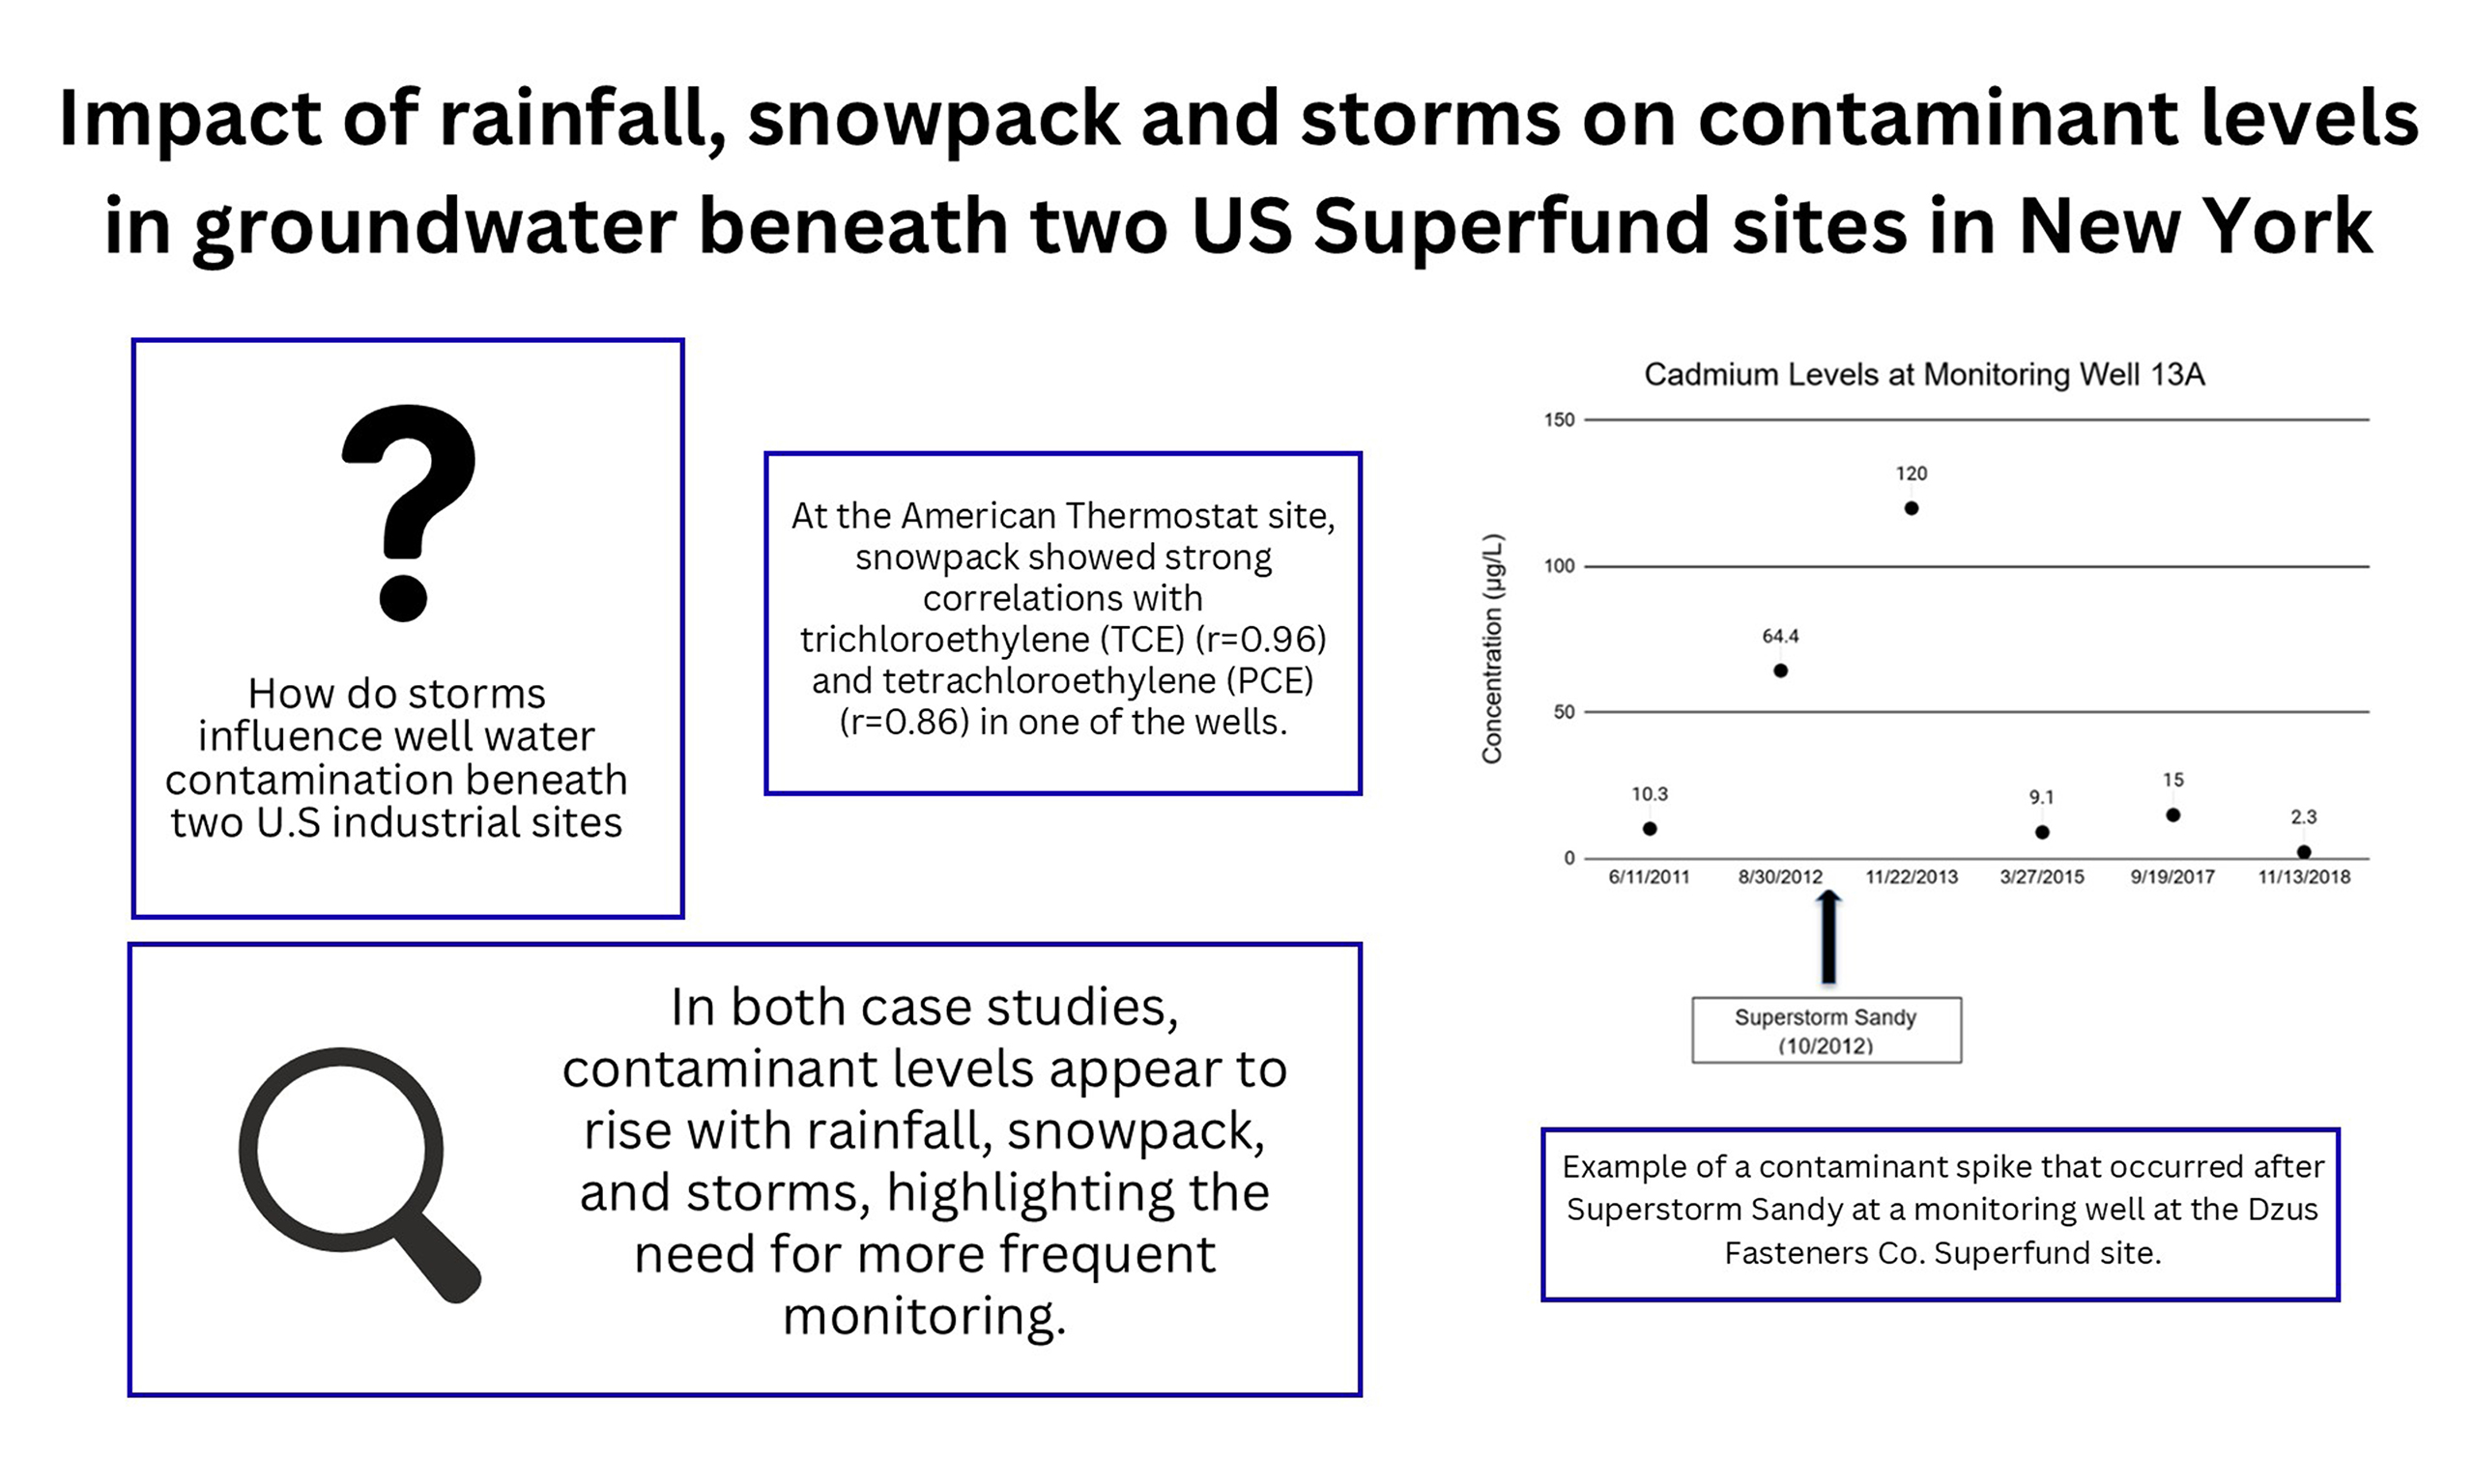
Superfund sites are polluted locations in the U.S. designated by the Environmental Protection Agency for cleanup due to hazardous waste contamination. The U.S. Government Accountability Office estimates that 50% of U.S. Superfund sites are at risk of flooding, potentially leading to mobility of contaminants into the environment. We investigate the relationships between rainfall, snowpack, and storms with levels of contaminants in well water beneath Dzus Fasteners Co. in West Islip, New York (NY, 2011-2019) and American Thermostat Co. in South Cairo, NY (2005-2011) using data shared by the New York State Department of Environmental Conservation. At Dzus, sampling was conducted approximately yearly. During Superstorm Sandy in October 2012, the water table beneath Dzus rose 1 to 2 meters due to storm surge, then receded into the Atlantic Ocean via Willetts Creek. In a Dzus monitoring well (MW), cadmium (Cd) increased from 64.4 µg/L in August 2012, to 120 µg/L in November 2013; lower levels of Cd were seen in other MWs. In April 2013, after Sandy, 14 out of 70 sediment samples collected along Willetts Creek were above 90 mg/kg Cd, with a maximum of 1,600 mg/kg; the previous maximum was
Keywords
INTRODUCTION
Recent storm events have shown that variations in rainfall, flooding, and groundwater levels can mobilize contaminants at hazardous waste sites, particularly Superfund sites, but patterns and long-term changes are not well-characterized. Superfund sites are polluted locations in the U.S. designated by the Environmental Protection Agency (EPA) for cleanup due to hazardous waste contamination[1]. In 2019, a U.S. Government Accountability Office (GAO) report was motivated by news of hazardous sediment being transported from the Gowanus Canal Superfund site to basements in Brooklyn, New York (NY), during Superstorm Sandy in 2012[2,3], and by damages to Superfund sites in Houston, Texas, during Hurricane Harvey in 2017[4]. More recently, in 2021, substantial widespread flooding occurred at the American Cyanamid Superfund site in Bridgewater, New Jersey, during Hurricane Ida[5]. In May 2021, J. Alfredo Gómez, Director, Natural Resources and Environment, GAO, testified before the Subcommittee on Environment and Climate Change, Committee on Energy and Commerce, U.S. House of Representatives and reported that 50% of Superfund sites are at risk of moderate flood hazard, 12% at risk of storm surge, and 7% at risk of sea-level rise[6]. Flooding events can influence the mobility of contaminants from hazardous waste sites, including U.S. Superfund sites[7-9].
Theoretical models suggest that dynamic rainfall and evapotranspiration can influence the migration of contaminants, including organic and radioactive contaminants[10,11]. Water-level fluctuations can influence redox conditions, which have been shown to impact contaminant mobility. For example, seasonal spring flooding can mobilize dissolved lead (Pb) in inundated areas and groundwater table fluctuations due to rainfall have been linked to the mobility of chromium (Cr)[12,13]. Saltwater intrusion also could mobilize soil contaminants[14]. Moreover, models suggest that 326 sites in the U.S. Superfund program, representing 18.1 million hectares of contaminated land, may be vulnerable to changes in groundwater depth or flow direction because of sea-level rise[14]. As an example, anticipated sea-level rise is expected to alter soil biogeochemical and hydrological conditions, potentially impacting their ability to retain arsenic (As)[15] and other metals.
Collectively, the literature suggests that contaminants can become mobilized due to greater amounts of rainfall, sea-level rise, and major flooding events, but we lack sufficient data to confirm and understand this pattern. To address this gap, the New York State Department of Environmental Conservation (NYSDEC) granted us access to monitoring data on state and federal Superfund sites to investigate whether storm intensity, rainfall, and snowpack are linked to contaminant mobility at these sites. After reviewing the data to ensure sampling was conducted at similar locations, well depths, using similar sampling protocols, and overall data completeness, we focused on data from two sites: Dzus Fasteners and American Thermostat.
EXPERIMENTAL
Site selection
Data were provided by the NYSDEC for seven contaminated sites. Since one goal was to understand temporal trends, the data were then reviewed to determine whether there were at least four repeat measurements of the same contaminant, at the same well, at the same depth, and where each sample was followed by a subsequent sample no more than a year later. Dzus Fasteners Co. and American Thermostat Co. successfully met those criteria while the rest did not; the case studies proceeded using these two sites [Figure 1].
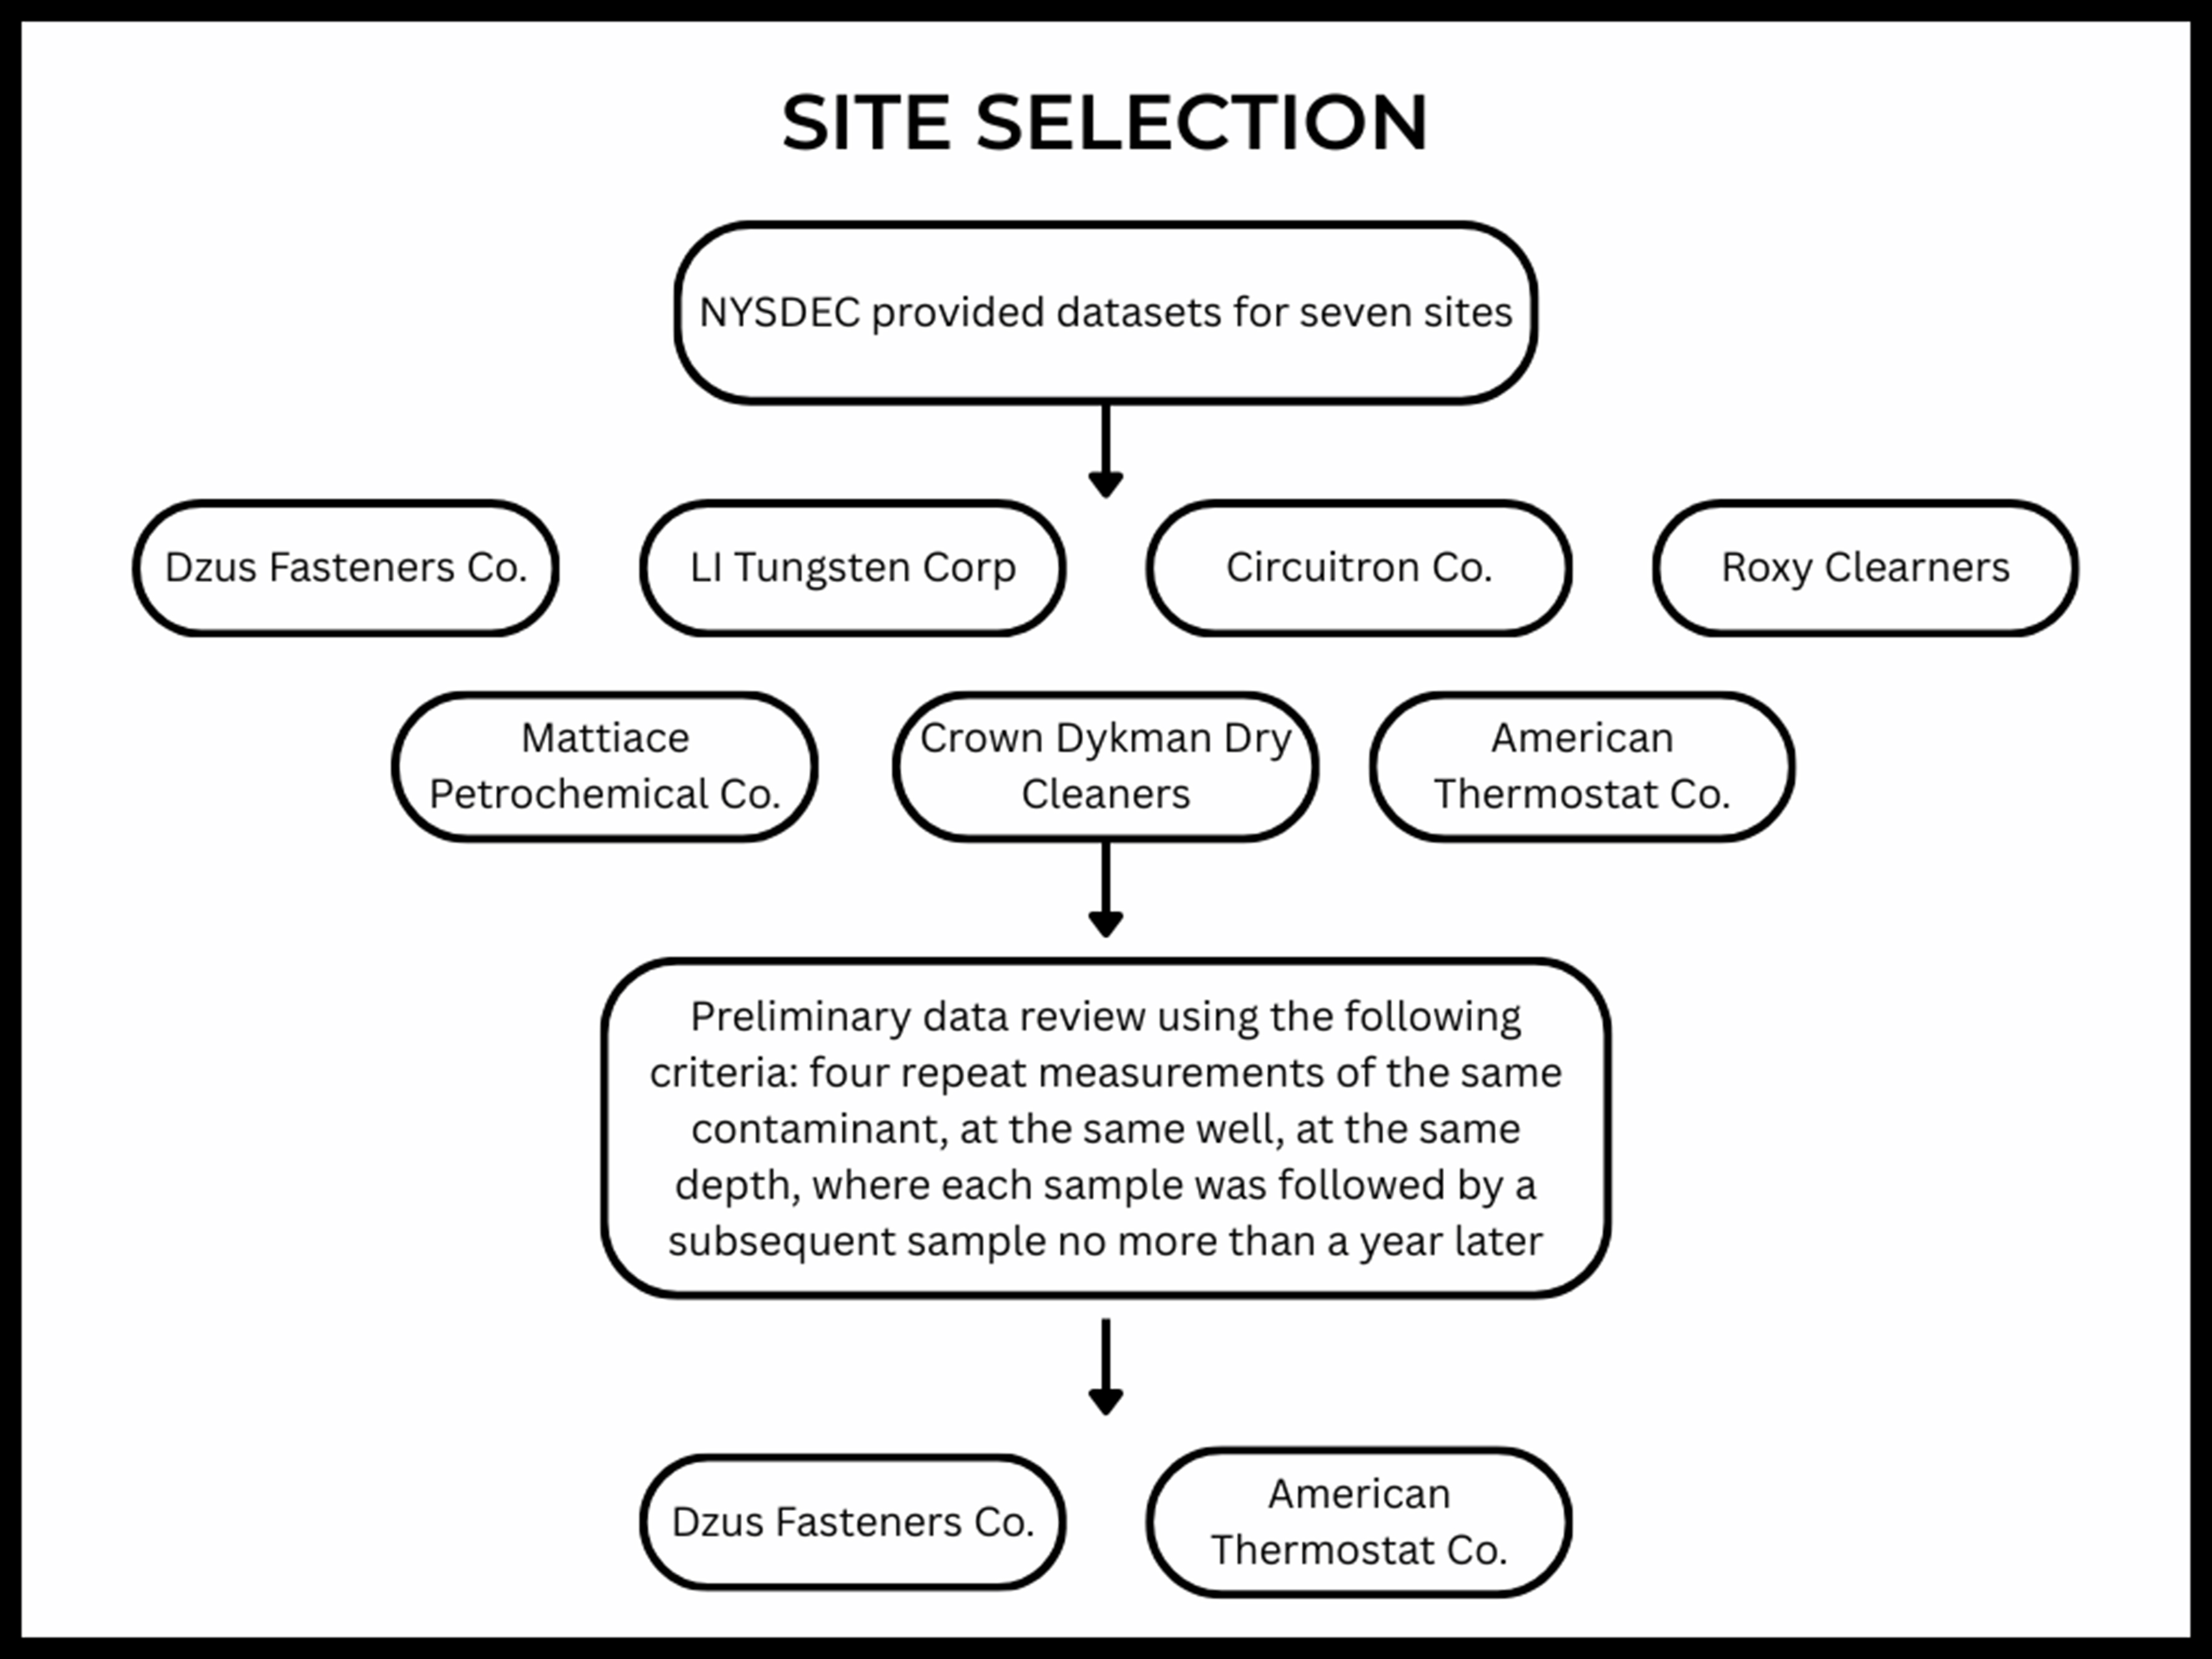
Figure 1. Flowchart illustrating the selection process for the sites that were used as case studies.
Sites
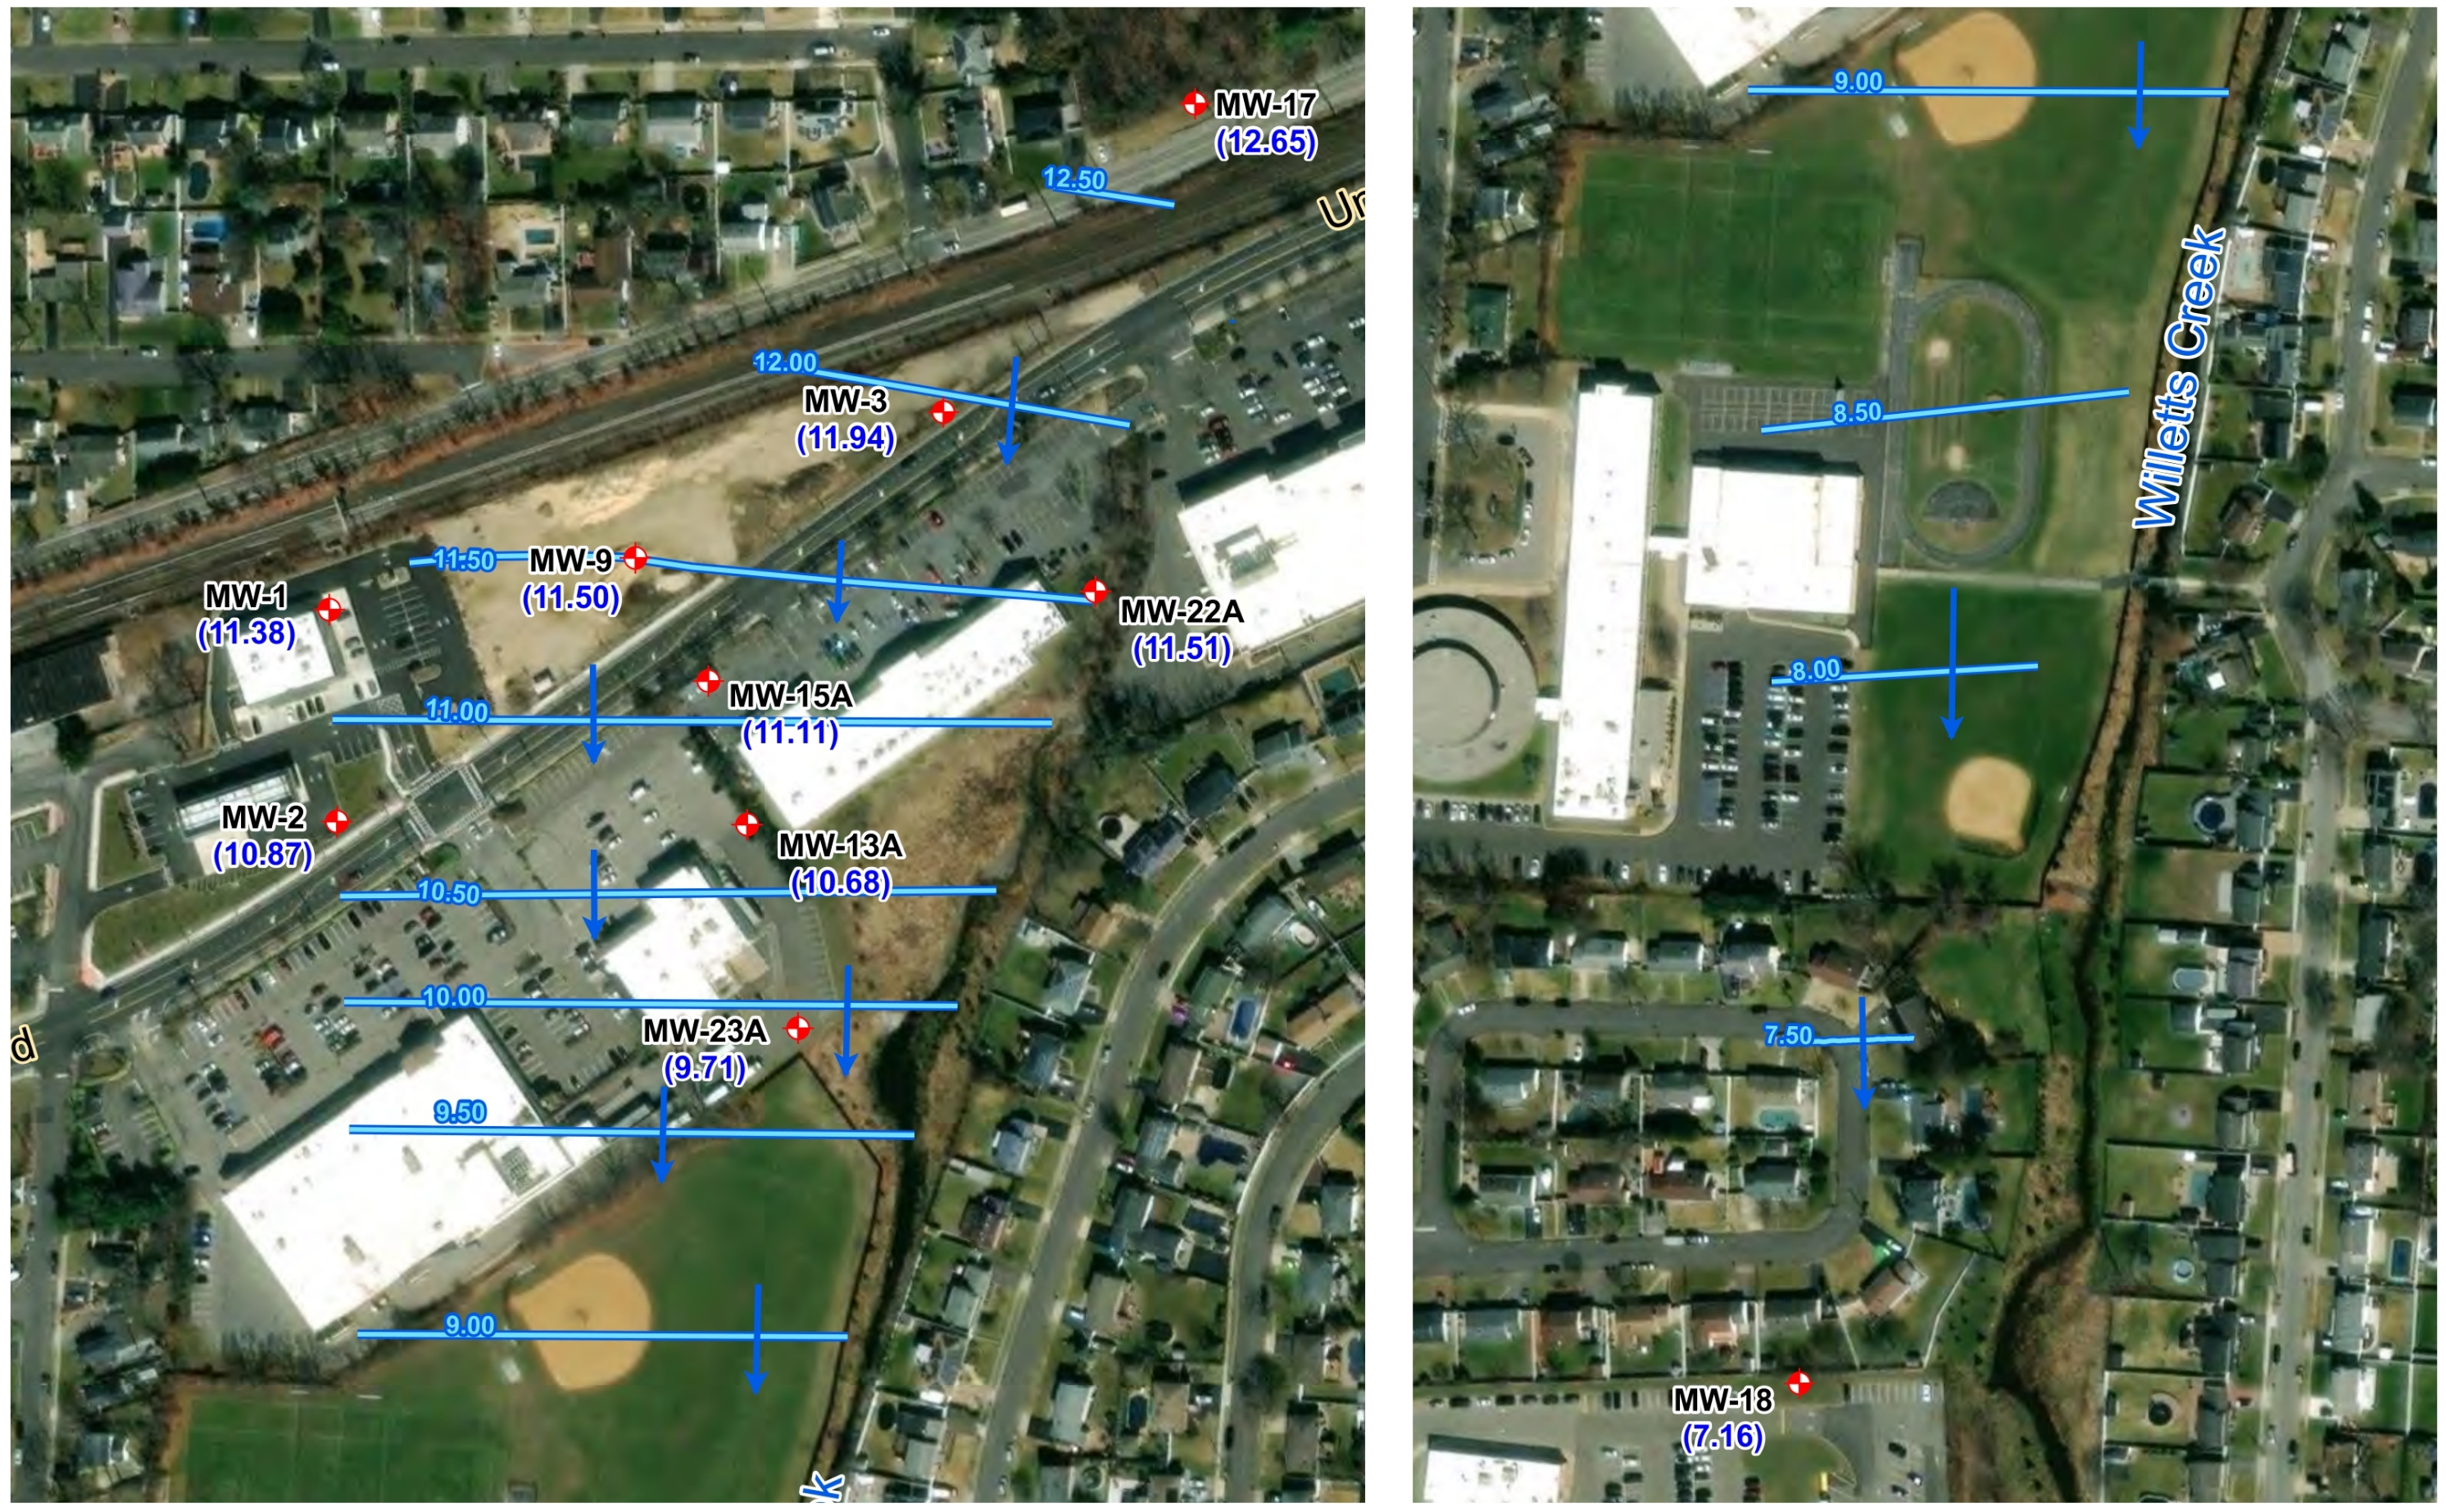
The Dzus Fasteners Co. [Figures 2-4] produced fasteners and springs at a 1-acre site in West Islip, NY, from 1937 to 2015[16]. Personnel designed and manufactured quarter-turn fasteners, quick-acting latches, and panel strips for military and aerospace applications, among others, and used steel, stainless steel, aluminum, and plastic. Wastes from metal plating, tumbling, electroplating, chromic acid, anodizing, and special finishing operations consisted of oils, heavy metals, and salts and were deposited into leaching pools on-site; these wastes leached into the underlying soil and groundwater. The site began a remedial investigation (RI) under the State Superfund Program in May 1992[17]. Since then, NYSDEC has worked to complete various projects that include collecting samples to monitor contaminant levels and to also remediate contaminants that are found to be at high concentrations. The primary contaminants of interest at Dzus as identified by the NYSDEC, are cadmium (Cd) and Cr. Per the NYSDEC, the groundwater concentrations of Cd should be no more than 5 µg/L and of Cr should be no more than 50 µg/L[18].
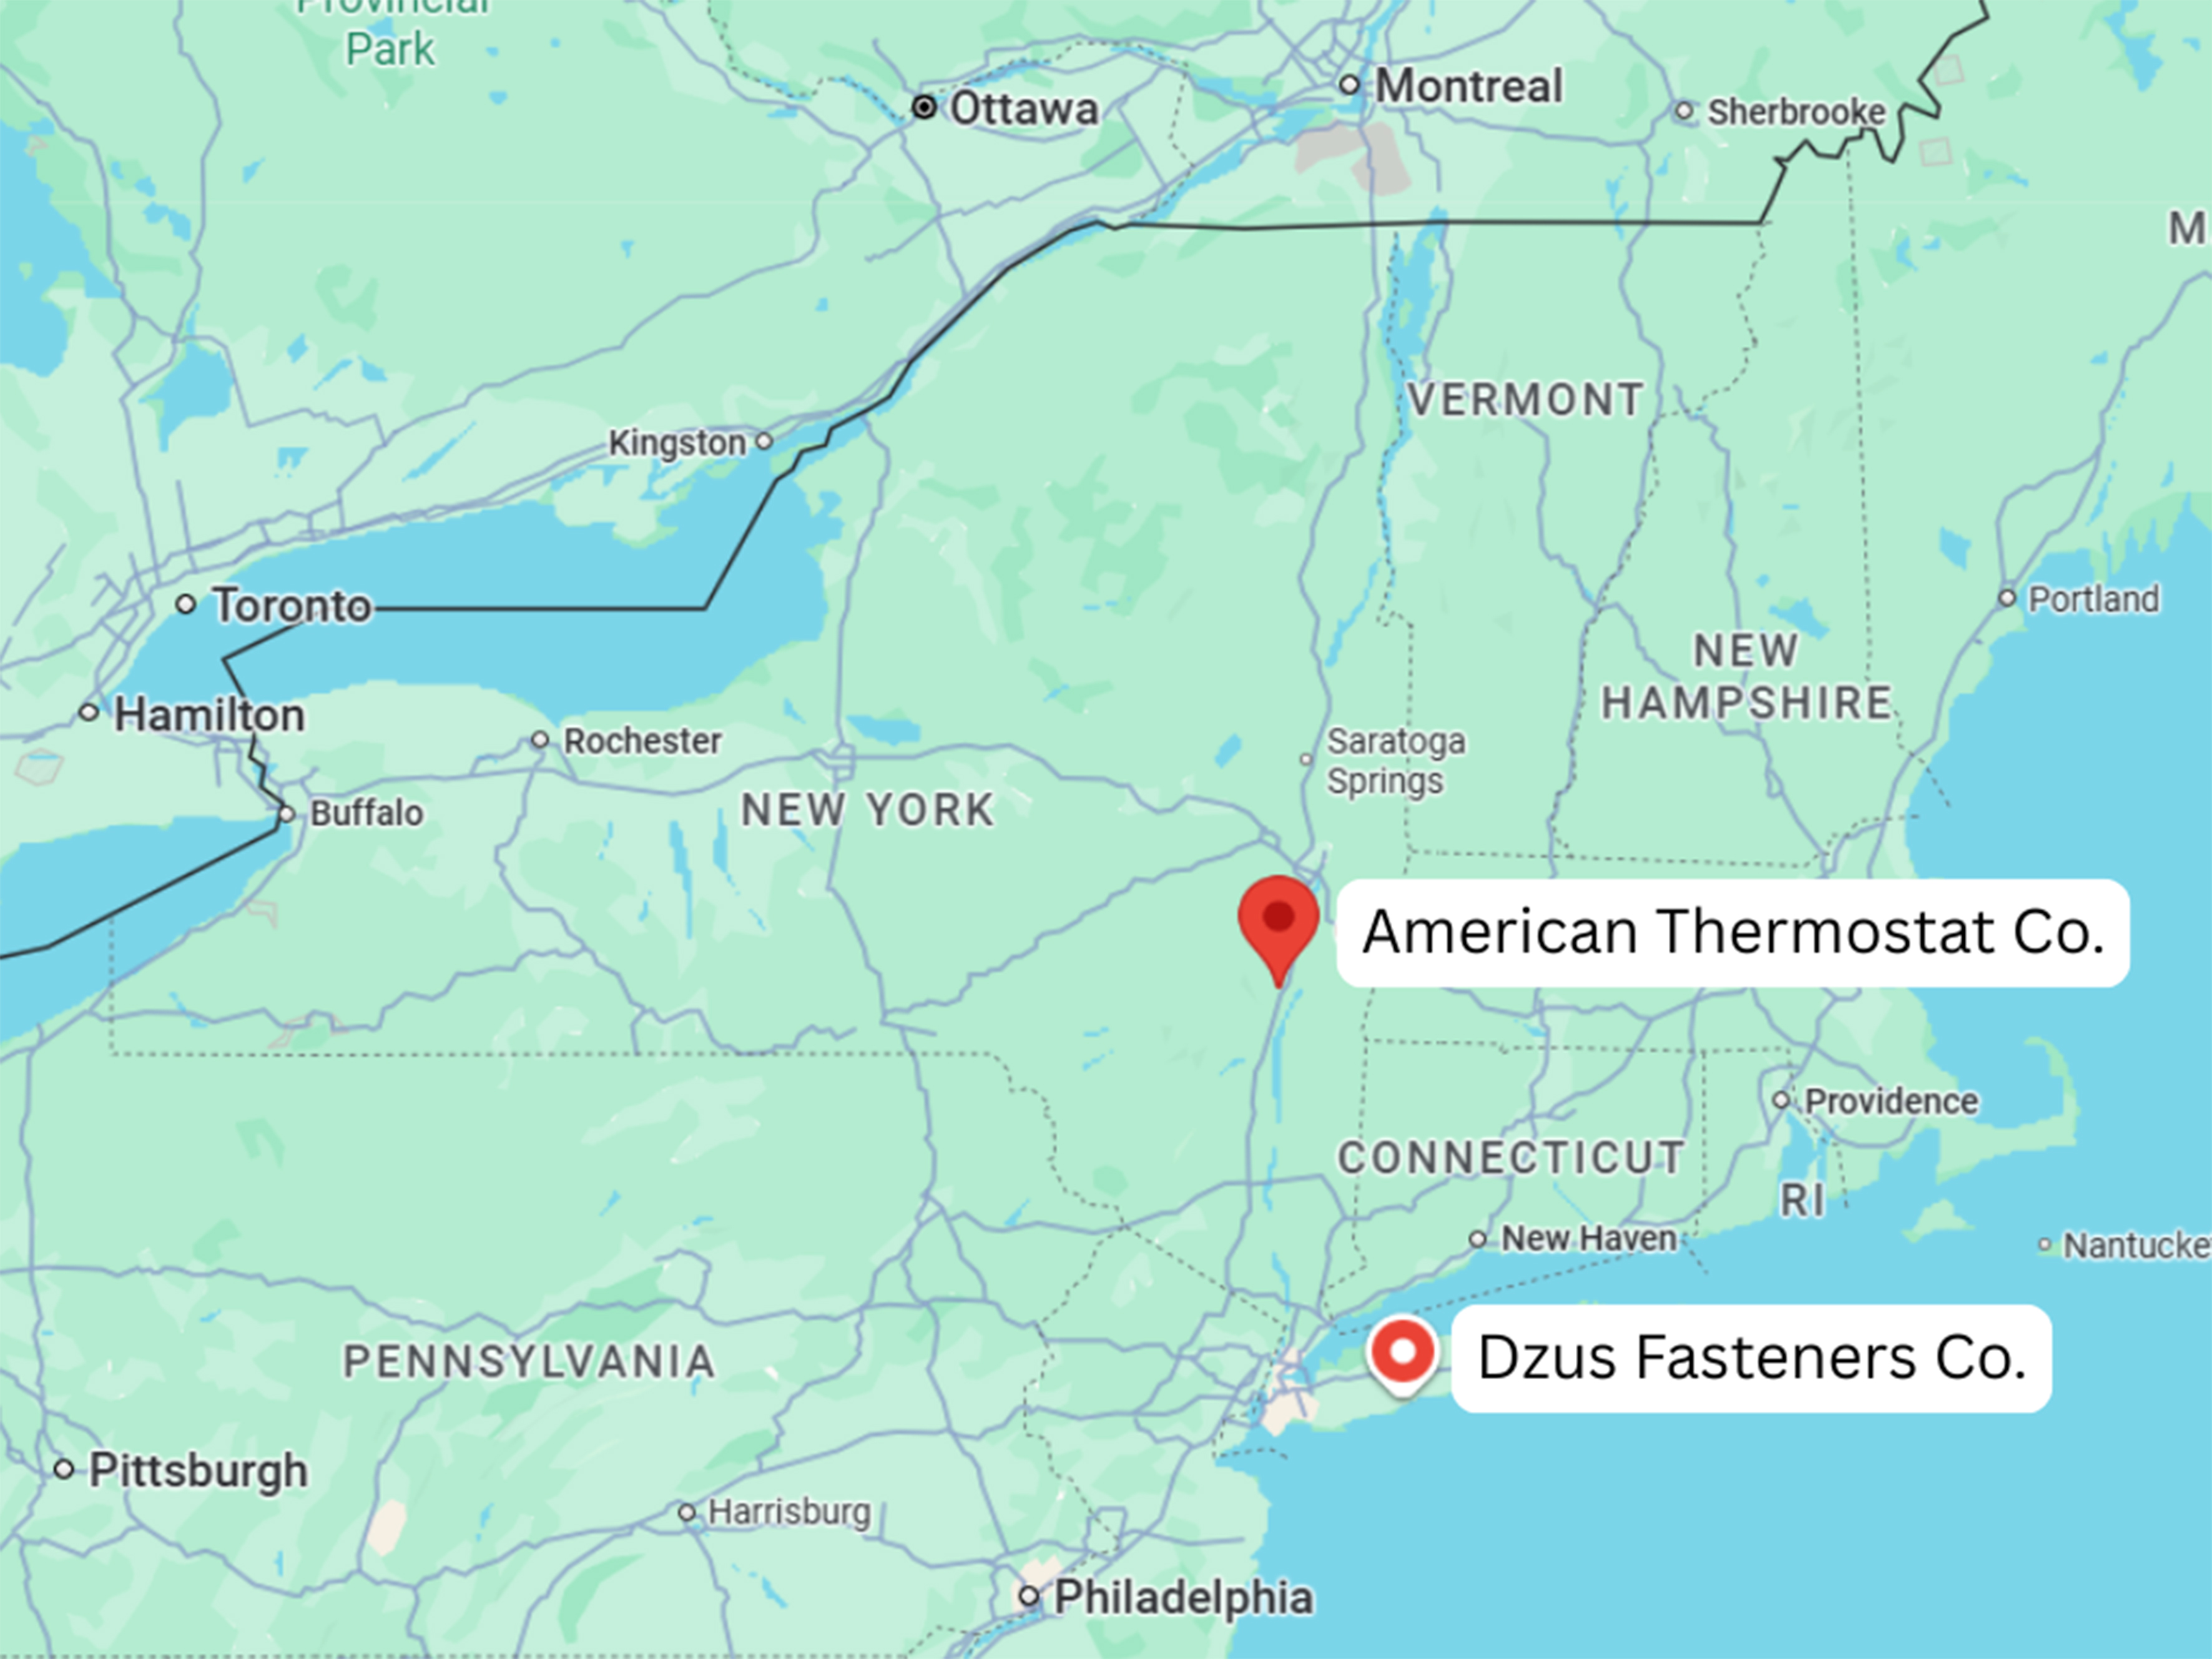
Figure 2. Map of locations of the two Superfund sites in New York created by the authors.

From 1954 to 1985, the American Thermostat Corporation [Figures 2 and 5] built thermostats for small appliances on an 8-acre site in the Catskill Creek Valley in South Cairo, NY[19]. In 1981, NYSDEC discovered that workers had been pouring waste and organic solvents down drains attached to an abandoned septic system and dumping solvents and sludges on the parking lot. The site was designated as a federal Superfund site in 1983. Since then, similarly to Dzus, the NYSDEC has worked to complete various projects that include collecting samples to monitor contaminant levels and to also remediate contaminants that are found to be at high concentrations. Trichloroethylene (TCE) and other volatile organic compounds (VOCs), including tetrachloroethylene (PCE), are the primary contaminants of interest. Per the NYSDEC, groundwater concentrations of TCE and PCE should be no more than 5 µg/L[20].
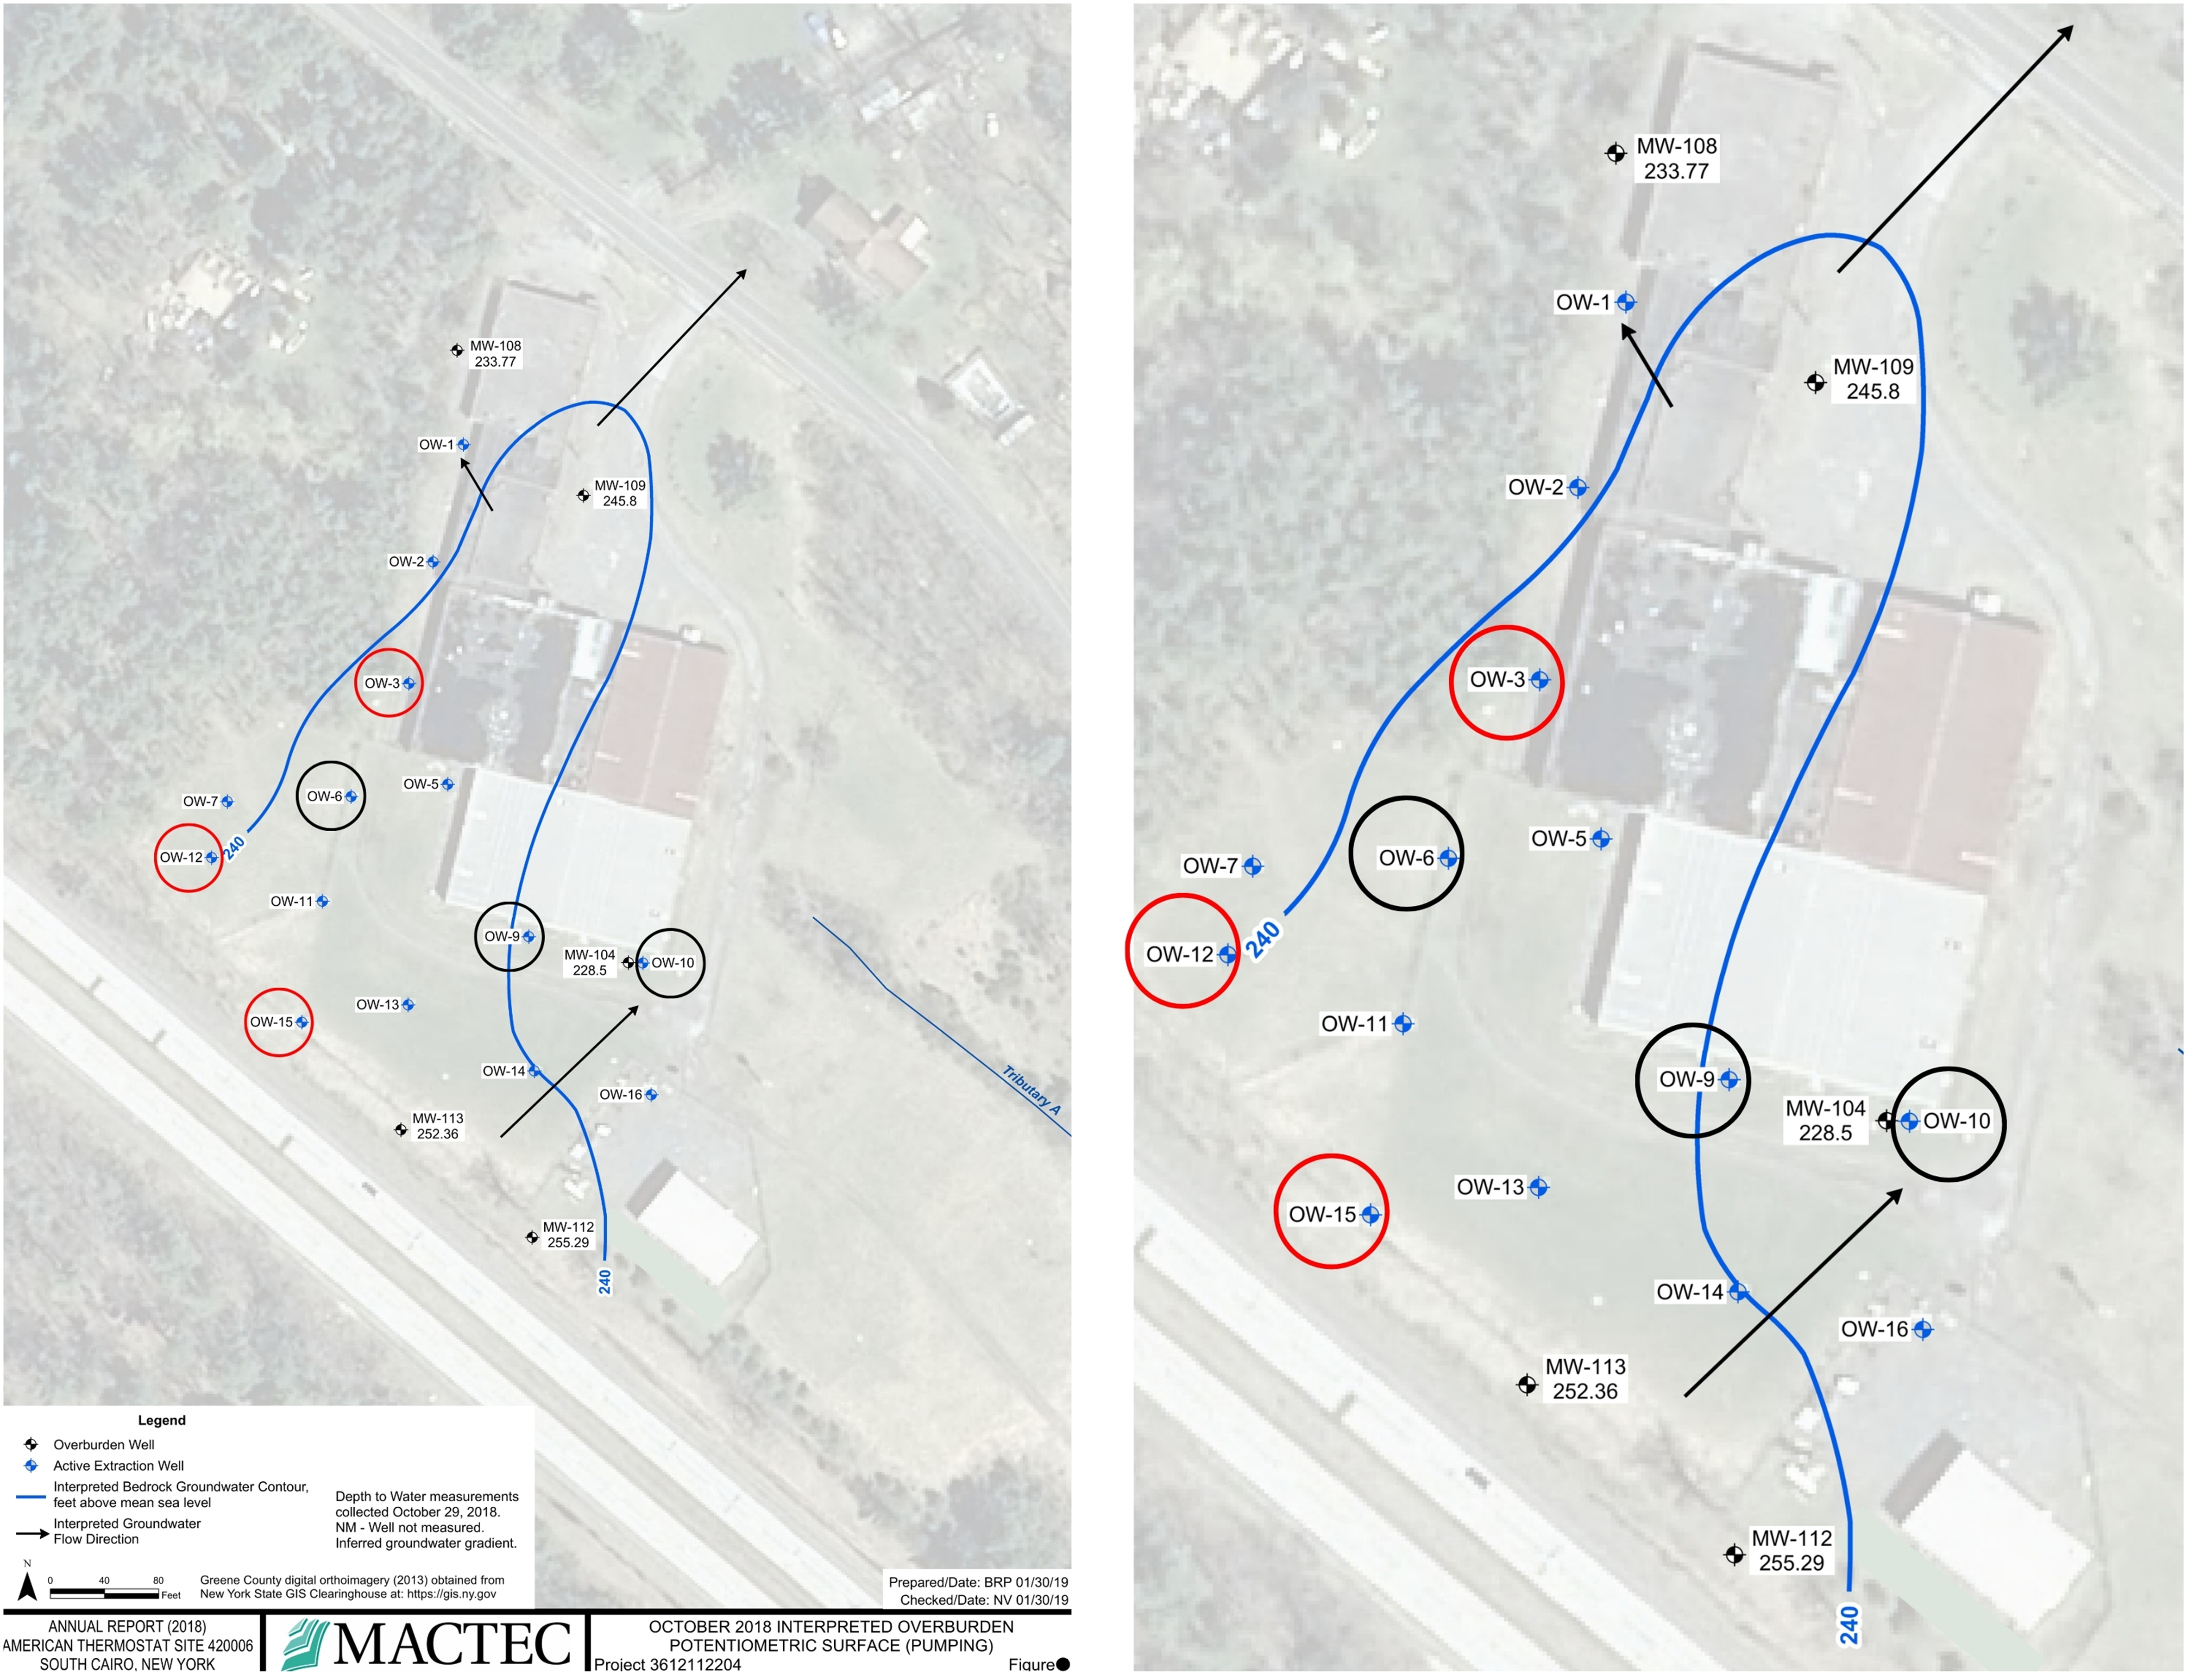
Figure 5. Map of groundwater wells and direction of groundwater flow at the American Thermostat site from page 10, including a zoomed-in version on the right panel, from the Fourth Five-Year Review Report Addendum American Thermostat Superfund Site[20]. The 3 wells depicted in Tables 1 and 2 are circled in red; the other 3 wells depicted in Supplementary Table 1 are circled in black. Figures came from publicly available government reports[20] and are not copyrighted.
Datasets
For each site, each monitoring (MW) or observation well (OW) was identified in the database. The properties of the wells were then compared to ensure that the analysis method of the sample and the depth from which the sample was obtained were the same across each of the sampling points within a well. After ensuring that each well was sampled using similar protocols over time, we compiled a dataset of repeat measures of different contaminants at each site. At Dzus, there were 12 MWs with sampling data before and after Superstorm Sandy, with 5-11 samples collected at each well (2011-2019). Data on Superstorm Sandy’s water table rise and sediment measurements at Dzus were recorded by NYSDEC. Filtered and unfiltered groundwater samples were analyzed for total and dissolved Target Analyte List Metals (including mercury) via U.S. EPA Method 6010[18]. At American Thermostat, there were 6 shallow OWs, with 5-11 samples collected at each well (2005-2011). Methods for the analysis of water samples for VOCs at American Thermostat were not provided. Precipitation data were obtained from the National Environmental Satellite, Data, and Information Service report of Record of Climatological Observations. More specifically, daily precipitation data for the Dzus site were obtained from the National Weather Service (NWS) Forecast Office in Upton, NY, and the precipitation data for the American Thermostat site were obtained from the NWS Forecast Office in Albany, NY.
Statistical analysis
At Dzus, data collection included the period before and after Superstorm Sandy (Oct 2012). We visually plotted the data at 12 groundwater MWs and along sediment transects to investigate whether metal contaminants increased after Sandy. At American Thermostat, we calculated Pearson correlation coefficients using a cloud-based RStudio Integrated Development Environment (IDE) to investigate the relationship between precipitation and VOC levels in each well. Precipitation was defined as a one-day and seven-day average (the six days preceding the sampling event plus the one day of sampling). Three different NWS categories of precipitation were considered: (1) Rain and melted snowfall; (2) snow, ice pellets, and hail; and (3) snow, ice pellets, and hail on the ground at the time of the observation (i.e., snowpack). The NWS defines “rainfall” as the amount of precipitation of any type, primarily liquid; “snow”, as precipitation in the form of ice crystals formed directly from the freezing of the water vapor in the air; “snowpack” as the total snow and ice on the ground, including both the new snow and the previous snow and ice which has not melted; “ice pellets” as pellets of ice composed of frozen or mostly frozen raindrops or refrozen partially melted snowflakes; and “hail” as shower precipitation in the form of irregular pellets or balls of ice more than 5 mm in diameter, falling from a cumulonimbus cloud[21-25].
RESULTS AND DISCUSSION
At the Dzus site, nine of the twelve MWs did not show meaningful changes in levels of metals
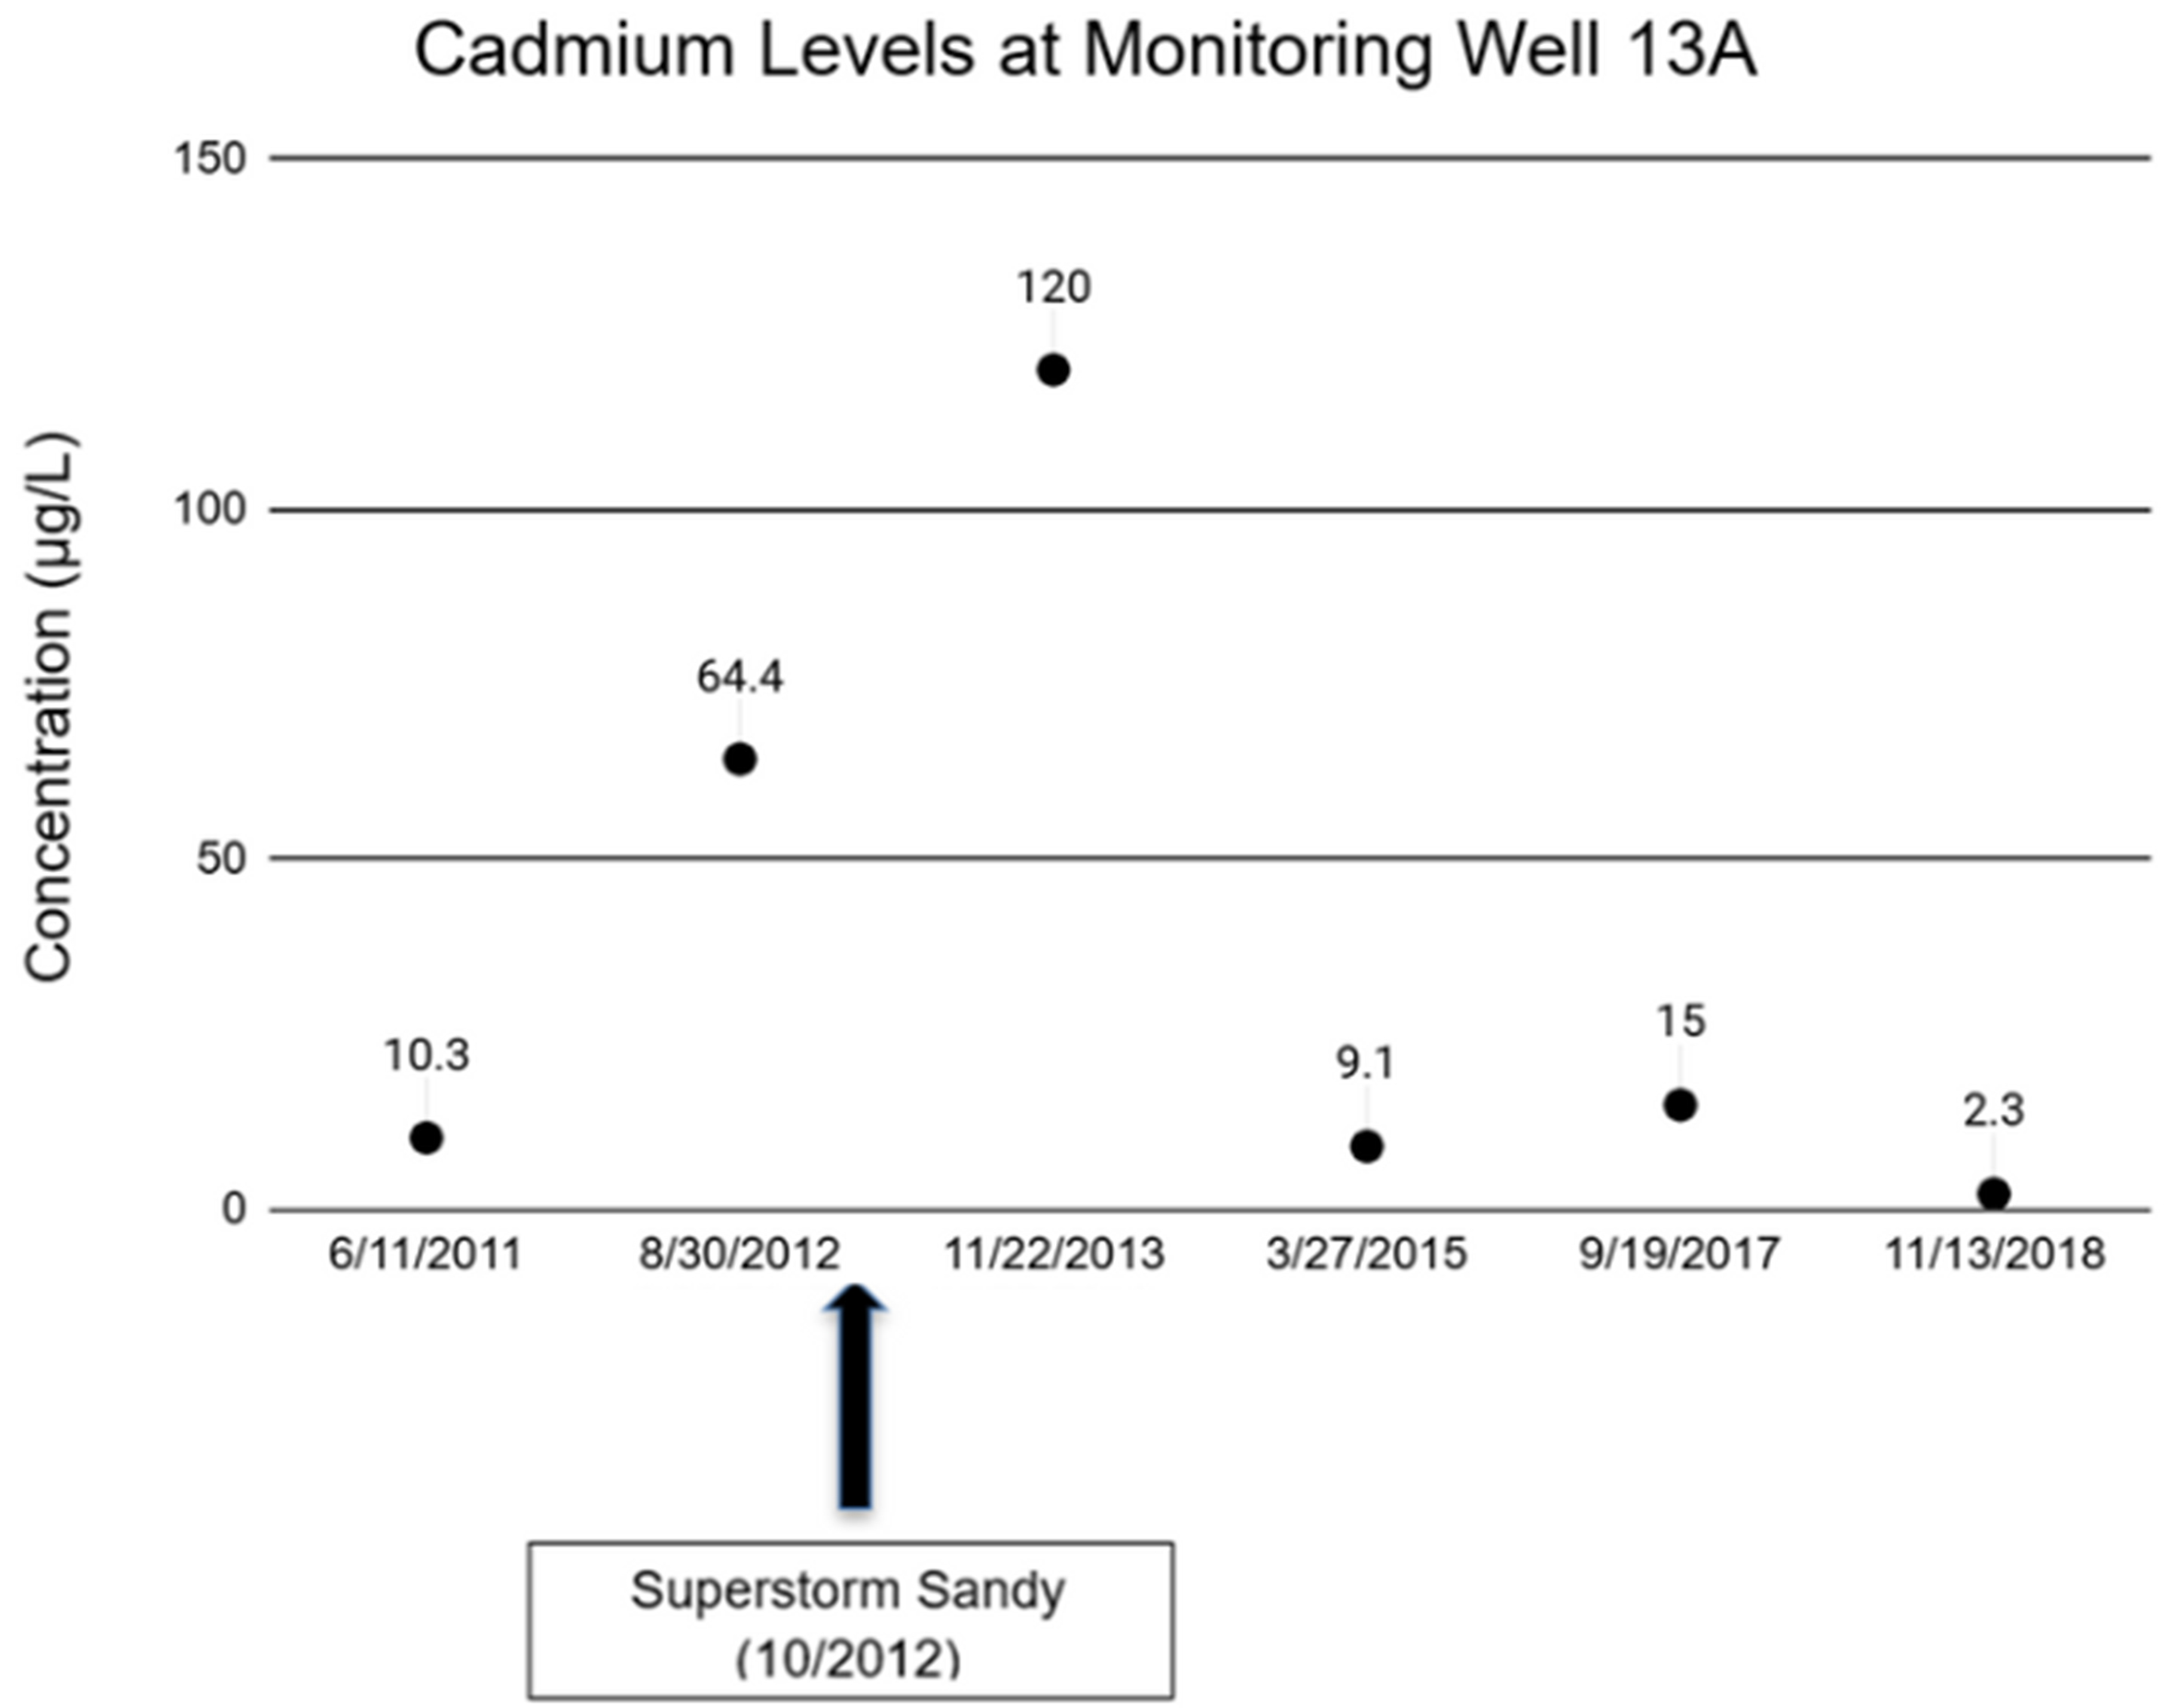
Figure 6. Cadmium concentration (µg/L) at MW-13A, Dzus site (2011-2019). MW: Monitoring well.
Of note, no other trace contaminants showed temporal trends around Superstorm Sandy at MW-13A
At American Thermostat, there were six main OWs with repeat samples. Three of these wells had lower contaminant concentrations [Supplementary Table 1] and no clear changes over time (OW-6, OW-9, and OW-10); the other three wells, OW-3, OW-15, and OW-12, are depicted in Figure 5. For these three wells, we report the Pearson correlation coefficients and P-values for contaminants in relation to same-day snow, ice, and hail on the ground (i.e., snowpack) [Table 1], and rain and melted snowfall [Table 2]. Several positive correlations were statistically significant (P-value < 0.05), indicating higher concentrations of contaminants with higher precipitation or snowpack. More contaminants showed associations with snow, ice, and hail on the ground, compared with rain and melted snowfall. In addition, since PCE and TCE were the contaminants of interest, there was longitudinal data for PCE and TCE, which we are showing at OW-12 for same-day snow, ice, and hail on the ground [Figure 7] and rain and melted snowfall [Figure 8]. Correlations with snow, ice pellets, and hail were not observed. On December 17, 2008, there was a larger amount of snow, ice, and hail on the ground (2 inches), which corresponded with higher concentrations of TCE and PCE at OW-12. On the same date, a higher amount of rain and melted snowfall was reported (0.4 inches) and was also associated with higher levels of TCE and PCE at OW-12.
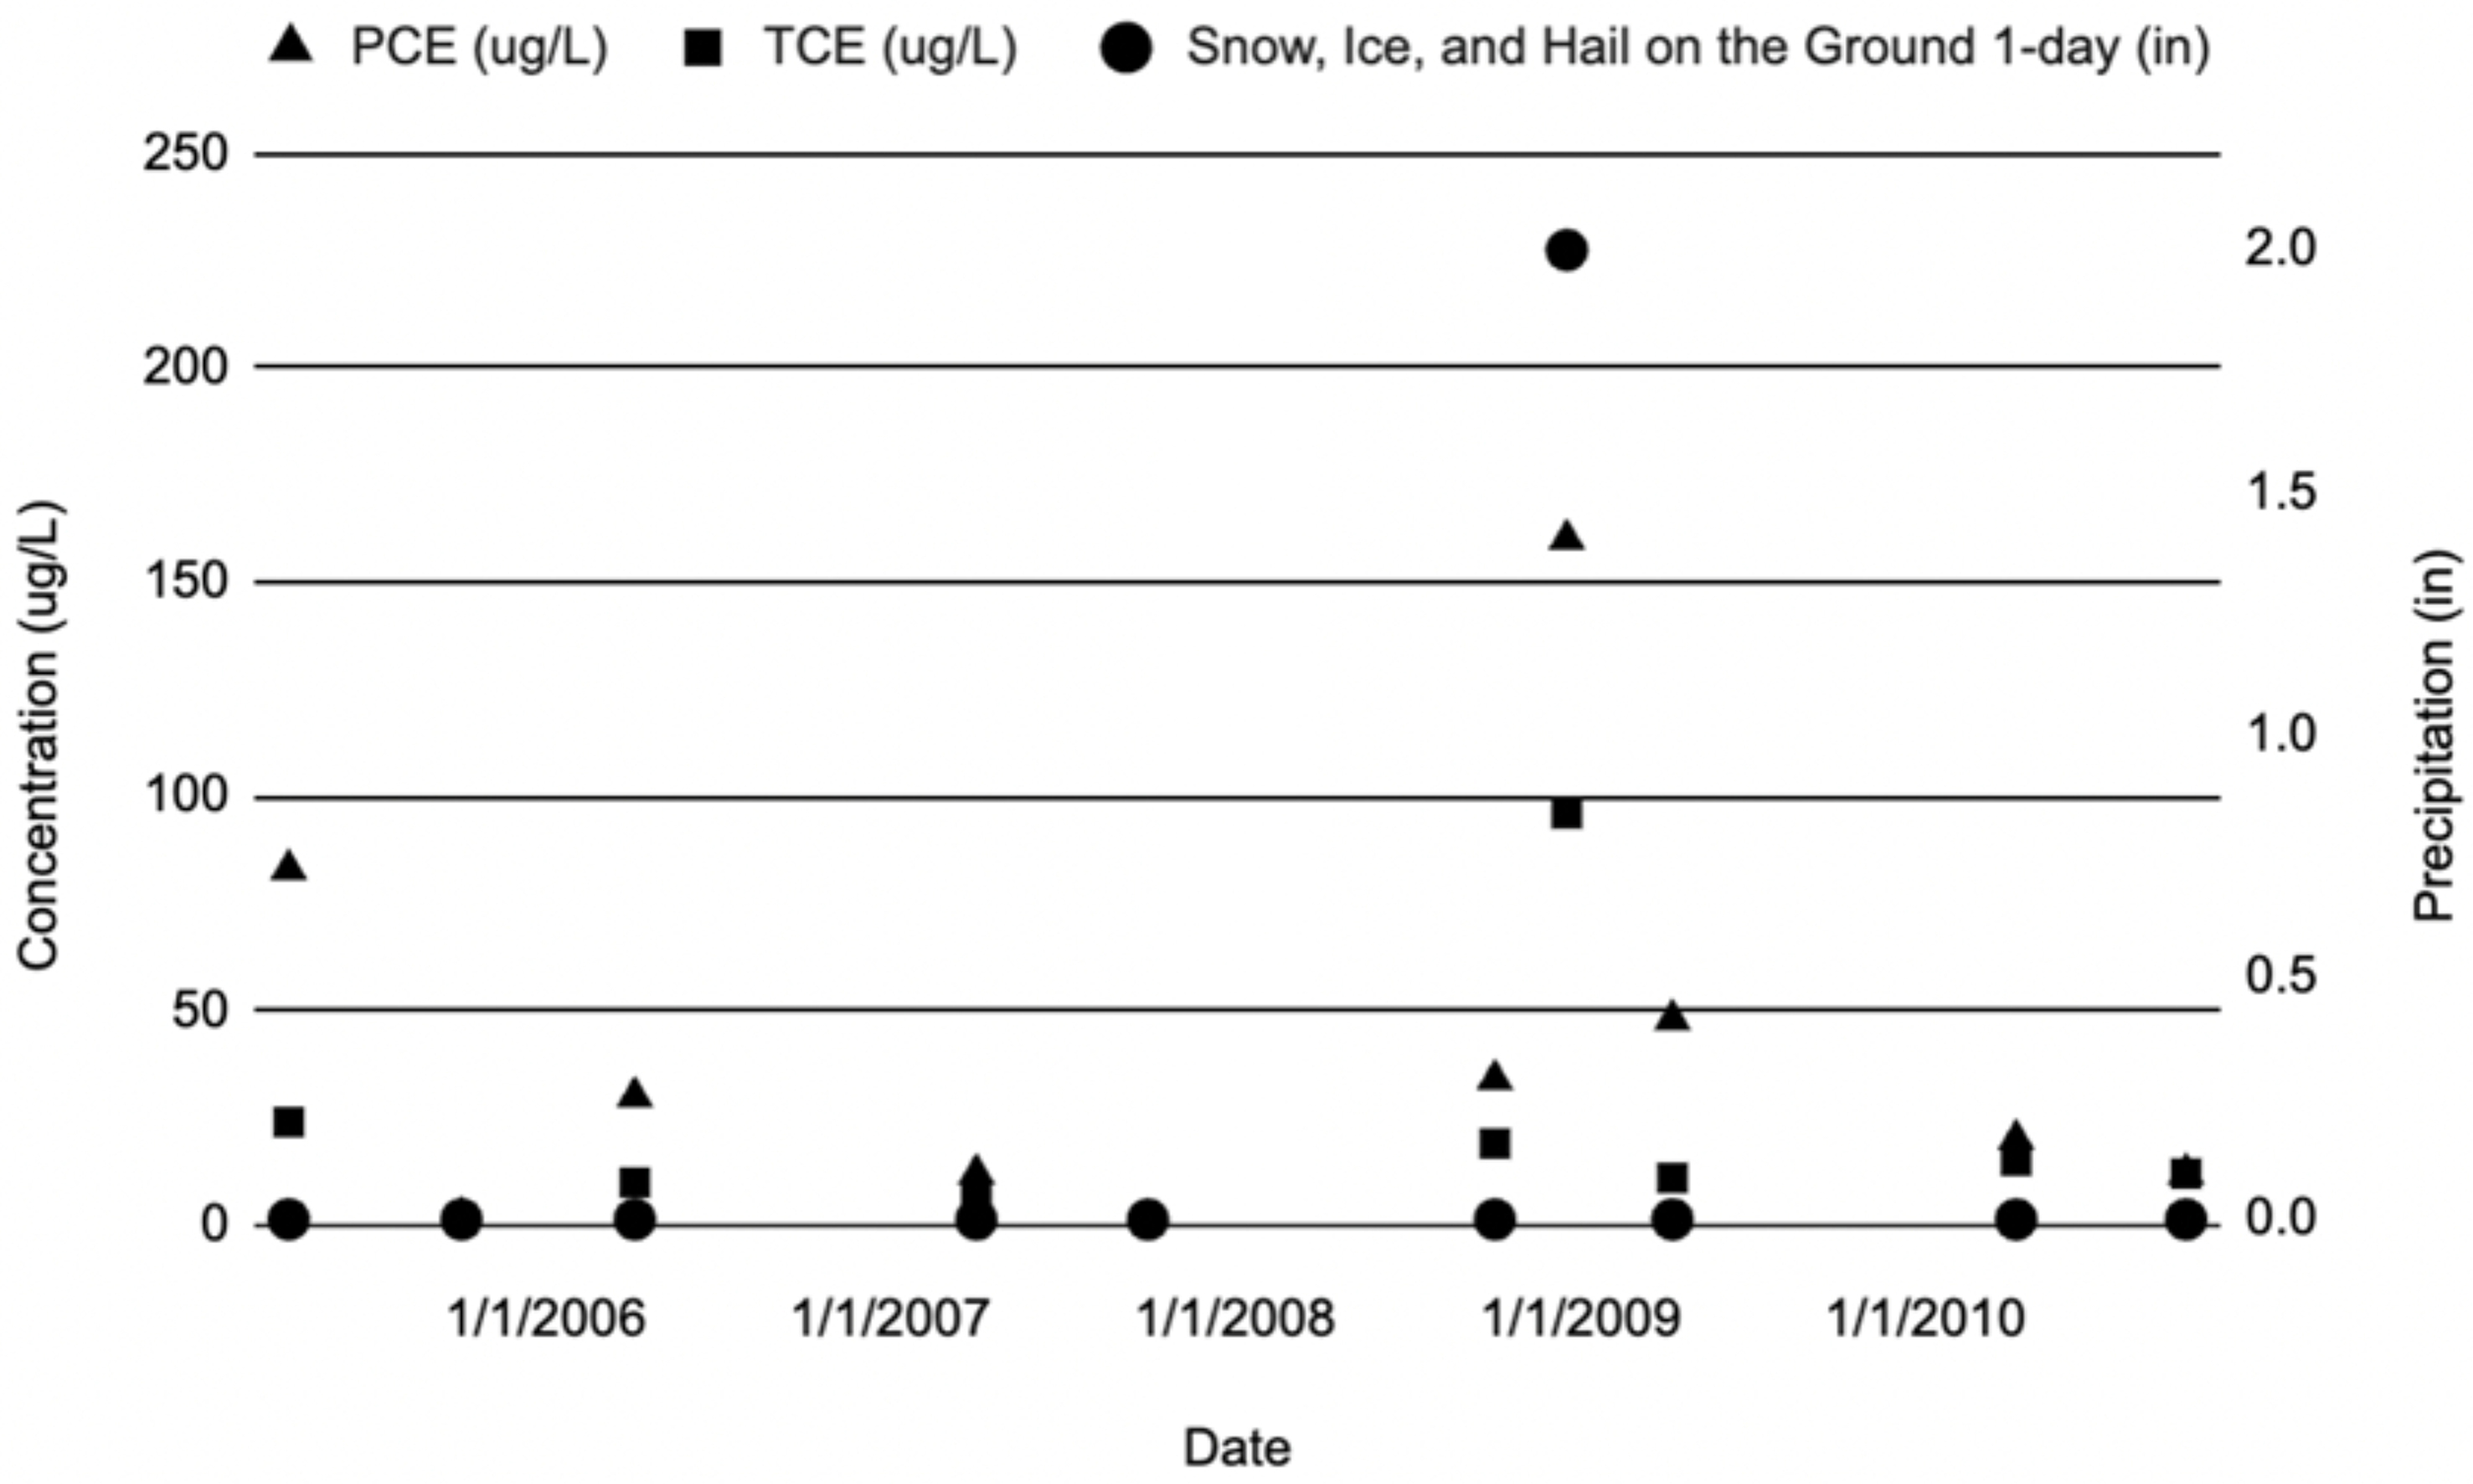
Figure 7. Scatterplot of PCE and TCE with same-day snow, ice, and hail on the ground at OW-12, American Thermostat site (2005-2011). PCE: Tetrachloroethylene; TCE: trichloroethylene; OW: observation well.
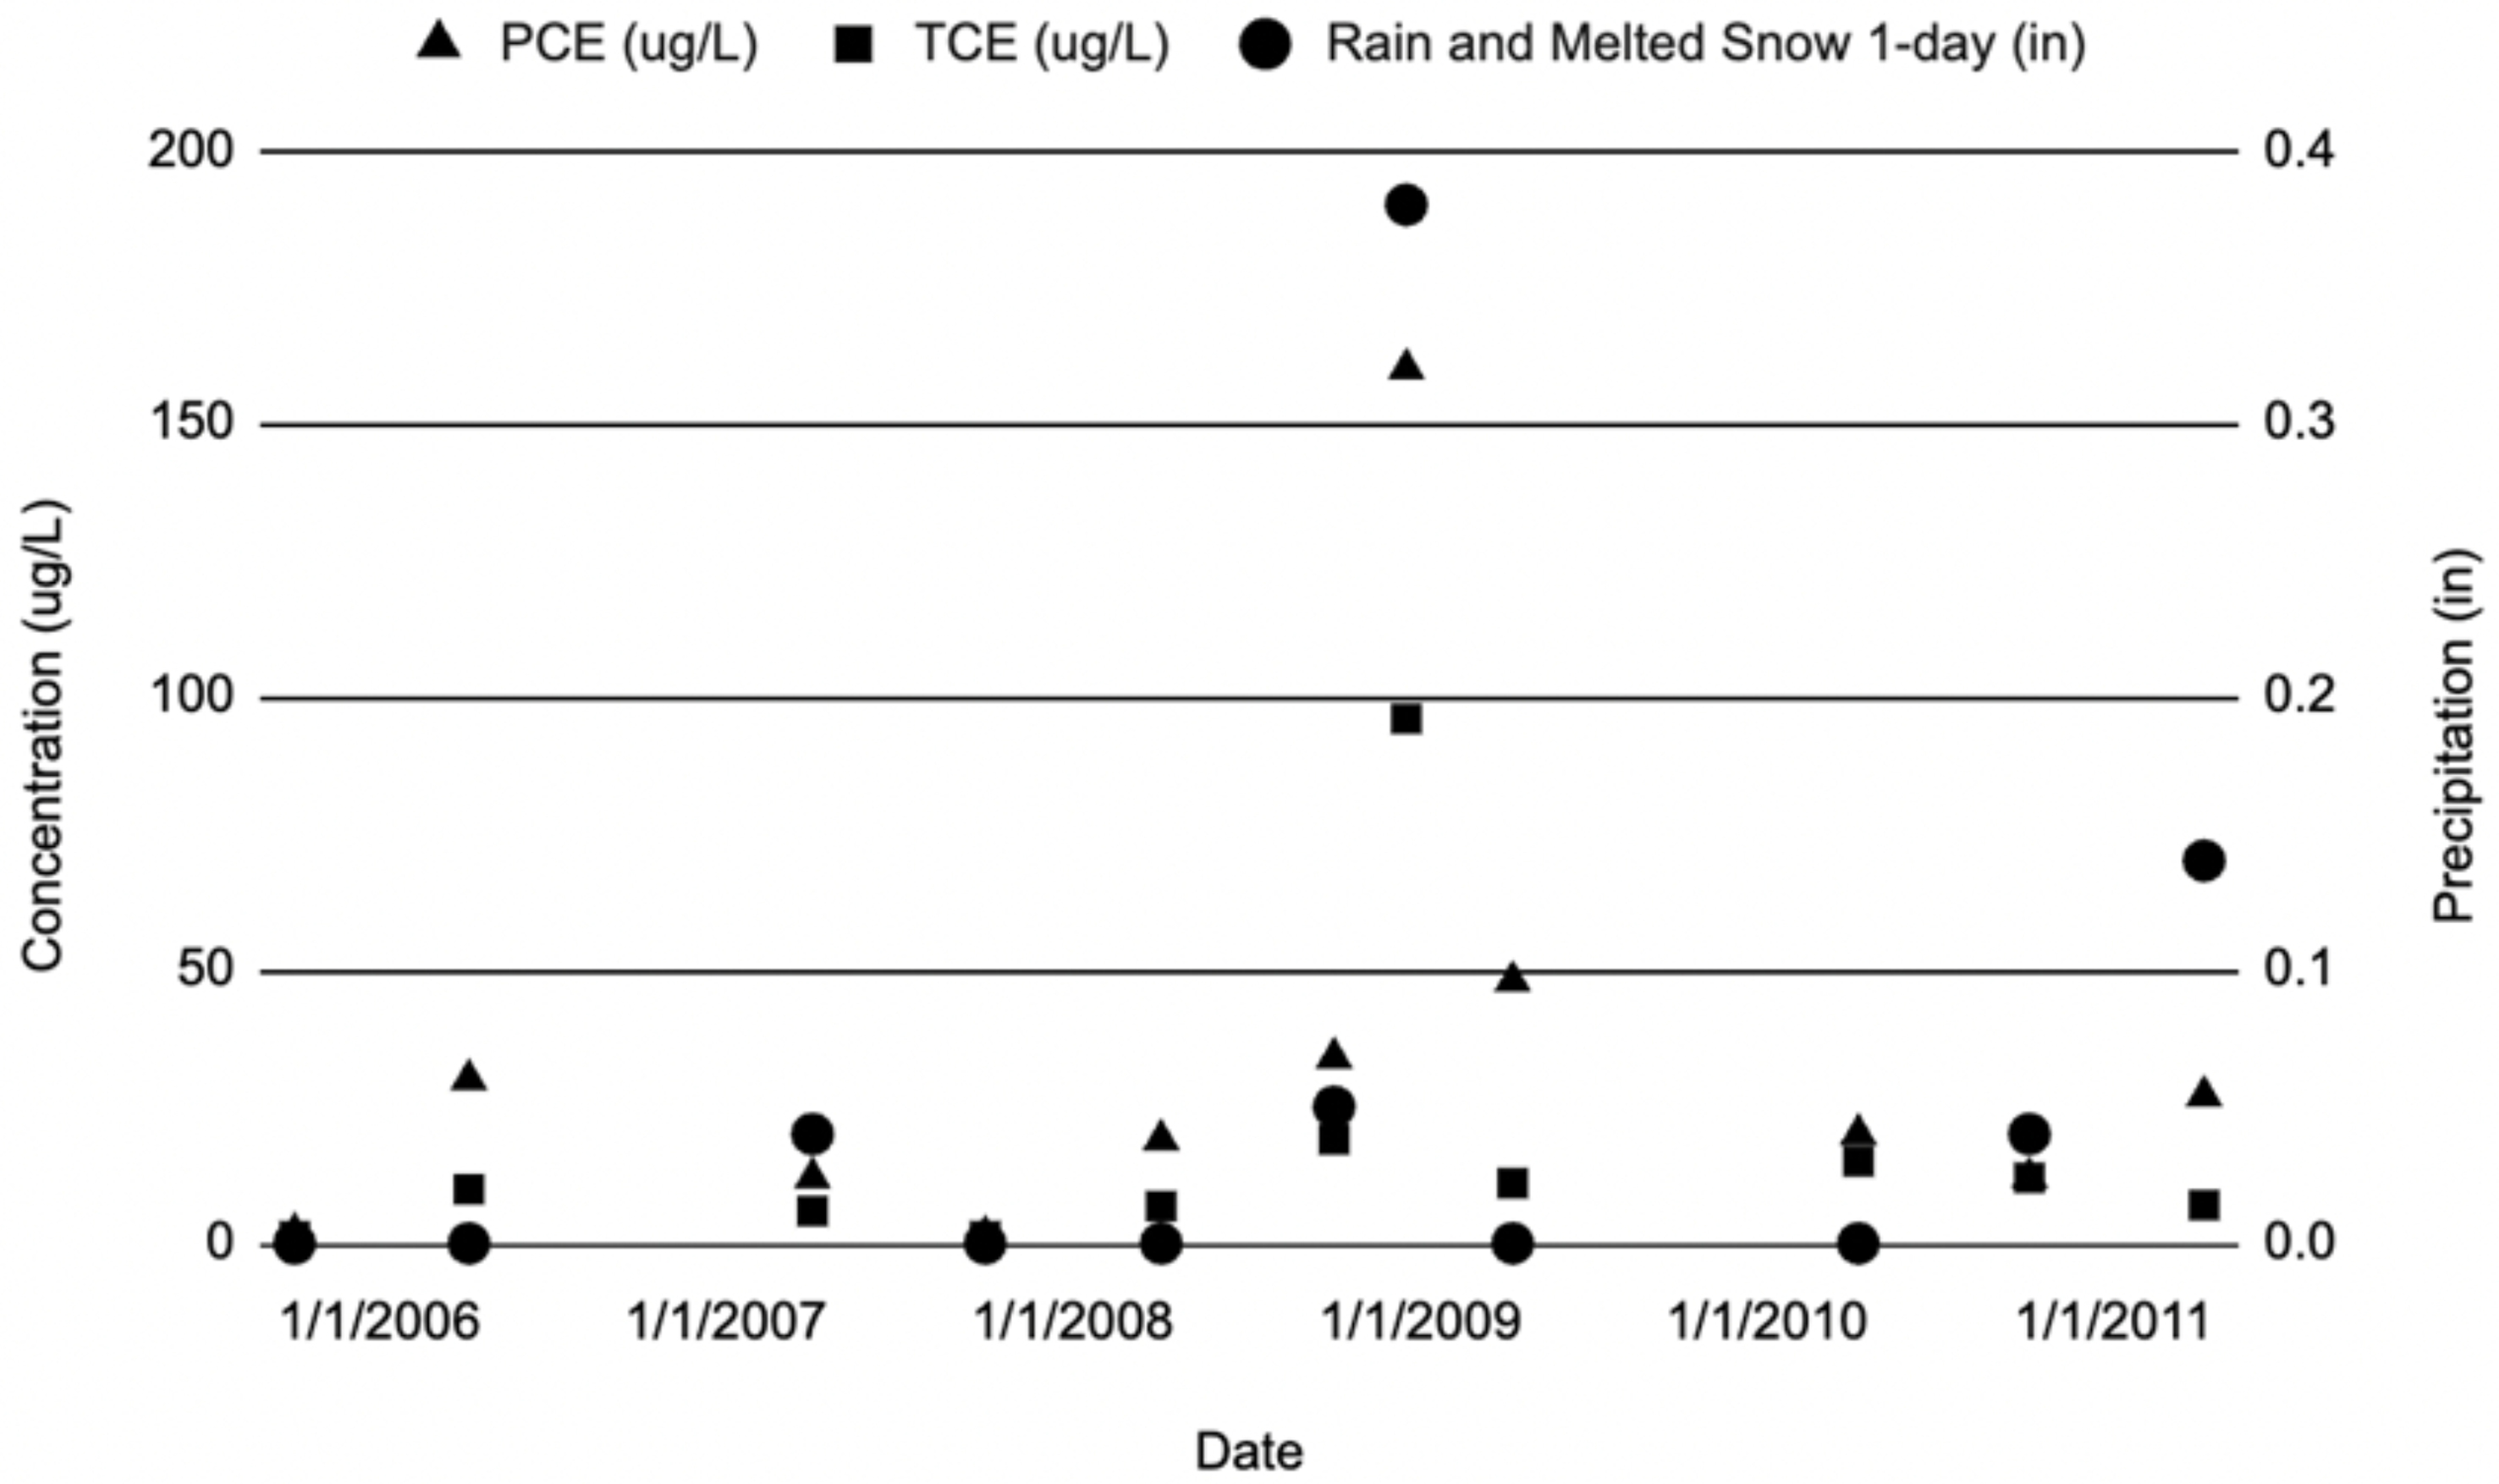
Figure 8. Scatterplot of PCE and TCE with same-day rain and melted snow precipitation at OW-12, American Thermostat site (2005-2011). PCE: Tetrachloroethylene; TCE: trichloroethylene; OW: observation well.
Pearson correlation coefficients and P-values for contaminants and same-day snow, ice, and hail on the ground at three OWs at the American Thermostat site (2005-2011)
| Contaminant | OW number | |||||
| OW-3 | OW-15 | OW-12 | ||||
| r | P-value | r | P-value | r | P-value | |
| 1,1-Dichloroethene | 0.72 | 0.04 | 0.17 | 0.69 | 0.98 | < 0.01 |
| TCA | 0.99 | < 0.01 | 0.22 | 0.68 | -0.54 | 0.27 |
| 1,1,2-Trichloroethane | 0.96 | < 0.01 | -0.41 | 0.42 | -0.63 | 0.18 |
| 1,1,2,2-Tetrachloroethane | 0.90 | 0.01 | -0.46 | 0.36 | ||
| 1,2-Dichloroethane | 0.96 | < 0.01 | -0.47 | 0.35 | -0.60 | 0.21 |
| 2-Hexanone | 0.73 | 0.02 | 0.74 | 0.01 | 0.34 | 0.29 |
| Acetone | 0.40 | 0.25 | 0.60 | 0.04 | 0.26 | 0.41 |
| Carbon disulfide | 1.00 | < 0.01 | -0.28 | 0.06 | -0.57 | 0.43 |
| Carbon tetrachloride | 0.98 | < 0.01 | 0.30 | 0.56 | ||
| Chloroform | 0.93 | < 0.01 | 0.23 | 0.67 | -0.20 | 0.70 |
| Cis-1,2-dichloroethylene | 0.85 | < 0.01 | 0.63 | 0.03 | 0.65 | 0.02 |
| Dichloroethylene | 0.87 | < 0.01 | 0.63 | 0.03 | 0.66 | 0.02 |
| Methyl chloride | 0.97 | < 0.01 | 0.14 | 0.79 | -0.20 | 0.70 |
| Methylene chloride | 0.67 | 0.07 | 0.16 | 0.73 | -0.28 | 0.60 |
| PCE | 0.64 | 0.05 | 0.32 | 0.31 | 0.86 | < 0.01 |
| Toluene | 0.89 | 0.02 | 0.39 | 0.44 | 0.27 | 0.61 |
| Trans-1,2-dichloroethene | 0.96 | < 0.01 | -0.21 | 0.59 | 0.80 | 0.01 |
| TCE | 0.81 | < 0.01 | 0.92 | < 0.01 | 0.96 | < 0.01 |
| Vinyl chloride | 0.90 | 0.01 | 0.73 | 0.01 | -0.02 | 0.95 |
Pearson correlation coefficients and P-values for contaminants and same-day rain and melted snowfall at three OWs at the American Thermostat site (2005-2011)
| Contaminant | OW number | |||||
| OW-3 | OW-15 | OW-12 | ||||
| r | P-value | r | P-value | r | P-value | |
| 1,1-Dichloroethene | -0.27 | 0.49 | 0.10 | 0.84 | 0.98 | < 0.01 |
| TCA | -0.29 | 0.58 | 0.24 | 0.64 | ||
| 1,1,2-Trichloroethane | -0.36 | 0.48 | -0.46 | 0.36 | -0.71 | 0.12 |
| 1,1,2,2-Tetrachloroethane | -0.14 | 0.76 | -0.54 | 0.27 | -0.71 | 0.12 |
| 1,2-Dichloroethane | -0.39 | 0.45 | -0.52 | 0.29 | -0.71 | 0.12 |
| 2-Hexanone | -0.29 | 0.42 | -0.27 | 0.40 | -0.26 | 0.40 |
| Acetone | -0.15 | 0.68 | -0.20 | 0.54 | -0.12 | 0.69 |
| Carbon disulfide | -0.40 | 0.43 | -0.37 | 0.47 | -0.67 | 0.33 |
| Carbon tetrachloride | -0.29 | 0.58 | 0.24 | 0.64 | ||
| Chloroform | -0.37 | 0.37 | 0.24 | 0.64 | ||
| Cis-1,2-dichloroethylene | -0.44 | 0.18 | -0.24 | 0.44 | 0.50 | 0.08 |
| Dichloroethylene | -0.43 | 0.22 | -0.24 | 0.44 | 0.46 | 0.11 |
| Methyl chloride | -0.24 | 0.65 | 0.24 | 0.64 | ||
| Methylene chloride | 0.17 | 0.72 | 0.05 | 0.93 | -0.35 | 0.50 |
| PCE | -0.44 | 0.20 | 0.31 | 0.32 | 0.90 | < 0.01 |
| Toluene | -0.06 | 0.92 | 0.35 | 0.49 | 0.26 | 0.62 |
| Trans-1,2-dichloroethene | -0.40 | 0.33 | -0.28 | 0.51 | 0.77 | 0.01 |
| TCE | -0.45 | 0.19 | -0.12 | 0.72 | 0.92 | 0.00 |
| Vinyl chloride | -0.15 | 0.75 | -0.23 | 0.47 | -0.39 | 0.19 |
These case studies provide some evidence that (1) a major storm event (Sandy) is associated with higher levels of Cd at MWs and down creek from the Dzus Superfund site; and (2) larger amounts of rainfall or snow accumulating on the ground are associated with higher concentrations of VOCs at OWs at the American Thermostat Superfund site. This pattern, however, was not universal across the MWs at the sampling sites, and there was sparse sampling at all sites.
Recent reviews have summarized evidence showing that flooding events can move large amounts of material from hazardous waste sites, including U.S. Superfund sites, and that material often contains contaminants found on those sites, including metals, organics, and radioactive contaminants[7-9]. However, there are far fewer studies on contaminant mobility when the sites do not flood. In coastal areas, sea-level rise and saltwater intrusion from storm surge, in addition to fluctuations in the water table level related to precipitation, impact the mobility of contaminants through complex biogeochemical redox mechanisms[13,15,27-29]. While these redox phenomena may explain the variability observed for Cd at the Dzus site, they do not help explain the observed variable levels of TCE and PCE at the non-coastal American Thermostat site.
At the Dzus site, Cd was not elevated across all wells following Superstorm Sandy. The differences across wells might be explained by spatial location and well depth[18]. MW-13A is the shallowest MW with a depth of 10.7 feet. The next most shallow is MW-3 with a depth of 11.3 feet. Both of these wells displayed an increase in groundwater Cd after Sandy. MW-15A is located between these two wells, at a depth of 28.8 feet, and did not display changes in Cd concentrations after Sandy. MW-23A was located further south of MW-13A, at a depth of 14.3 feet, and did not display Cd concentration changes after Sandy.
At the American Thermostat site, contaminants are only associated with snowpack at 3 of the 6 sites. We are not sure why there are these differences across wells, but one factor may be the higher concentrations of contaminants at OW-3, OW-12, and OW-15 [Supplementary Table 1]. Correlations are only seen at OW-12 when using the same-day rain or snowfall as our measure of precipitation. We do not have a good explanation as to why OW-12 and OW-15 are not associated with the same-day rain or snowfall depicted in Table 2.
The correlations between VOCs and precipitation are also not consistent across different contaminants; this may help us better understand phenomena influencing the mobility of certain VOCs. Both TCE and PCE are denser than water and can form a dense non-aqueous phase liquid (DNAPL) that can influence their detection, leading to a difference from other soluble contaminants such as acetone[30]. In addition, DNAPL can become trapped and form a pollution pool that serves as a secondary source of contamination[30]. This can lead to pollutants migrating through a process known as reverse diffusion, where solutes migrate from a zone of low permeability to a zone of high permeability[30]. This might explain why PCE and TCE were more consistently associated with measures of precipitation, compared with acetone and vinyl chloride, for example, as seen in Table 2. Future work should involve developing an experimental model and conducting laboratory experiments to better understand how precipitation might influence levels of different VOCs.
When considering the sediment data from Dzus and the observed increase in Cd, the salinity level of the storm surge might have also contributed to Cd mobility. Cd tends to form the cation Cd2+ when dissolved and it could compete with other cations in seawater, such as Mg2+[31]. This could lead to its desorption from the soil, along with possible reactions with Cl-, an anion abundantly found in seawater[31]. The cations and anions in storm surge could enhance the remobilization of Cd from sediment into the groundwater[31].
The strengths of this analysis include the multi-year dataset on contaminants in groundwater samples from wells at two U.S. Superfund sites, collated with the historic precipitation data. Our largest limitation is the temporal sparseness of the sampling occurrence. There are not enough frequent measurements within these wells to fully characterize and quantify these dynamics in the context of precipitation data. More frequent monitoring, ideally daily or weekly, is recommended across the seasons, to be able to better understand the relationship between precipitation events and changes in concentrations of contaminants in groundwater at U.S. Superfund sites. More frequent monitoring of the groundwater, along with more data about the spatial distribution of contamination (on the surface and into the earth), would also be helpful for interpreting differences between MWs.
CONCLUSIONS
This study provides data in support of the hypothesis that Superstorm Sandy increased the mobility of Cd from the Dzus Superfund site. Remediation efforts after Sandy appear to have lowered the concentration of Cd in Willetts Creek; however, further monitoring is recommended to understand the impacts of extreme weather events such as storms and any potential storm surge, and their potential changes in the future. Precipitation events at American Thermostat appear to have increased the mobility of some VOCs in some of the MWs, although additional monitoring across the seasons is recommended to better understand these dynamics.
DECLARATIONS
Acknowledgments
Access to contaminant data at the Superfund sites courtesy of Payson Long, Evelyn Hussey, Gavin Vlainich, Samantha Salotto, Michael Cruden, and William Ottaway from NYSDEC Division of Environmental Remediation.
Authors’ contributions
Data acquisition, analysis, interpretation, writing: Bakatsias, D. E.; Kaur, J.
Data acquisition, revision: Parlapall, T.
Conceptualization, interpretation, revision: Soares, L. F.; Venkatesan, A. K.
Conceptualization, analysis, interpretation, revision: Karimi, R.
Conceptualization, data acquisition, analysis, interpretation, revision: Reed, K. A.
Conceptualization, data acquisition, analysis, interpretation, writing: Meliker, J. R.
Availability of data and materials
Precipitation data are publicly available and can be found for DZUS (https://www.weather.gov/wrh/Climate?wfo=okx) and for AT (https://www.weather.gov/wrh/Climate?wfo=aly). Some contaminant data are available here (https://dec.ny.gov/environmental-protection/site-cleanup/regional-remediation-project-information/region-1/environmental-cleanup-dzus-fastener-company; https://cumulis.epa.gov/supercpad/cursites/csitinfo.cfm?id=0201350) or can be obtained from the corresponding author upon reasonable request, with approval from the NYSDEC.
Financial support and sponsorship
Financial support was provided by Stony Brook University, Office of the Provost, Pilot Award for Climate Change Research.
Conflicts of interest
All authors declared that there are no conflicts of interest.
Ethical approval and consent to participate
Not applicable.
Consent for publication
Not applicable.
Copyright
© The Author(s) 2025.
Supplementary Materials
REFERENCES
1. U.S. Environmental Protection Agency. What is Superfund? https://www.epa.gov/superfund/what-superfund. (accessed 27 Oct 2025).
2. U.S. Government Accountability Office. Superfund: EPA should take additional actions to manage risks from climate change. 2019. https://www.gao.gov/products/GAO-20-73. (accessed 27 Oct 2025).
3. Walker, H. Photos: one of America’s ‘most extensively contaminated water bodies’ is flooding. 2012. https://observer.com/2012/10/gowanus-canal-flooding/. (accessed 27 Oct 2025).
4. ABC News. Houston Superfund site leaked toxic chemicals after Harvey: EPA. 2017. https://abcnews.go.com/US/houston-superfund-site-leaked-toxic-chemicals-harvey-epa/story?id=50181549. (accessed 27 Oct 2025).
5. Salant, J. D. N.J. weather: widespread flooding found at Superfund site after Ida storms hit. 2021. https://www.nj.com/weather/2021/09/nj-weather-widespread-flooding-found-at-nj-superfund-site-after-ida-storms-hit.html. (accessed 27 Oct 2025).
6. U.S. Government Accountability Office. Superfund: EPA should take additional actions to manage risks from climate change effects. 2021. https://www.gao.gov/products/GAO-21-555T. (accessed 27 Oct 2025).
7. Crawford, S. E.; Brinkmann, M.; Ouellet, J. D.; et al. Remobilization of pollutants during extreme flood events poses severe risks to human and environmental health. J. Hazard. Mater. 2022, 421, 126691.
8. Förstner, U.; Hollert, H.; Brinkmann, M.; Eichbaum, K.; Weber, R.; Salomons, W. Dioxin in the Elbe river basin: policy and science under the water framework directive 2000-2015 and toward 2021. Environ. Sci. Eur. 2016, 28, 9.
9. Ponting, J.; Kelly, T. J.; Verhoef, A.; Watts, M. J.; Sizmur, T. The impact of increased flooding occurrence on the mobility of potentially toxic elements in floodplain soil - a review. Sci. Total. Environ. 2021, 754, 142040.
10. Grifoll, J.; Cohen, Y. Contaminant migration in the unsaturated soil zone: the effect of rainfall and evapotranspiration. J. Contam. Hydrol. 1996, 23, 185-211.
11. Libera, A.; de Barros, F. P. J.; Faybishenko, B.; et al. Climate change impact on residual contaminants under sustainable remediation. J. Contam. Hydrol. 2019, 226, 103518.
12. Wade, A. M.; Eckley, C. S.; Noerpol, M.; et al. Mobilization of porewater Pb and Zn in response to seasonal wetting and drying within contaminated floodplains. Sci. Total. Environ. 2025, 958, 178053.
13. Wei, Y.; Xu, X.; Zhao, L.; et al. Migration and transformations of chromium in unsaturated soil during groundwater table fluctuations induced by rainfall. J. Hazard. Mater. 2021, 416, 126229.
14. Hill, K.; Hirschfield, D.; Lindquist, C.; Cook, F.; Warner, S. Risking coastal groundwater as a result of sea-level rise will influence contaminated coastal sites and underground infrastructure. Earth’s. Future. 2023, 11, e2023F003825.
15. Izaditame, F.; LeMonte, J. J.; Siebecker, M. G.; et al. Sea-level rise and arsenic-rich soils: a toxic relationship. J. Hazard. Mater. 2024, 472, 134528.
16. Department of Environmental Conservation. Region 1 - Environmental Remediation Project Information. https://dec.ny.gov/environmental-protection/site-cleanup/regional-remediation-project-information/region-1/environmental-cleanup-dzus-fastener-company. (accessed 27 Oct 2025).
17. Former Dzus Fastener Company Site Remediation - Willetts Creek and Lake Capri - Community Liaison Plan. 2019. https://extapps.dec.ny.gov/docs/remediation_hudson_pdf/152033clp.pdf. (accessed 27 Oct 2025).
18. Dzus Fastener Company quarter 2 2024 sampling data summary report. 2024. https://dec.ny.gov/sites/default/files/2024-10/dzussammplingreport.pdf. (accessed 27 Oct 2025).
19. United States Environmental Protection Agency. Superfund Site: American Thermostat Co. South Cairo, NY. https://cumulis.epa.gov/supercpad/cursites/csitinfo.cfm?id=0201350. (accessed 27 Oct 2025).
20. Fourth five-year review report addendum American Thermostat Superfund Site, Town of Catskill, Greene County. 2021. https://semspub.epa.gov/work/02/609897.pdf. (accessed 27 Oct 2025).
21. NOAA’s National Weather Service - Glossary. https://forecast.weather.gov/glossary.php?word=RAINFALL#:~:text=direct%20surface%20flow.-,Rainfall,-The%20amount%20of. (accessed 27 Oct 2025).
22. NOAA’s National Weather Service - Glossary. https://forecast.weather.gov/glossary.php?word=snow#:~:text=5%20percent%20error.-,Snow,-Precipitation%20in%20the. (accessed 27 Oct 2025).
23. NOAA’s National Weather Service - Glossary. https://forecast.weather.gov/glossary.php?word=snowpack#:~:text=Snowpack,-The%20total%20snow. (accessed 27 Oct 2025).
24. NOAA’s National Weather Service - Glossary. https://forecast.weather.gov/glossary.php?word=ice+pellets#:~:text=Ice%20Pellets,-(abbrev.%20IP)%20Same. (accessed 27 Oct 2025).
25. NOAA’s National Weather Service - Glossary. https://forecast.weather.gov/glossary.php?word=hail#:~:text=Hail,-Showery%20precipitation%20in. (accessed 27 Oct 2025).
26. Kubier, A.; Wilkin, R. T.; Pichler, T. Cadmium in soils and groundwater: a review. Appl. Geochem. 2019, 108, 104388.
27. Meliker, J. R.; Slotnick, M. J.; Avruskin, G. A.; Haack, S. K.; Nriagu, J. O. Influence of groundwater recharge and well characteristics on dissolved arsenic concentrations in southeastern Michigan groundwater. Environ. Geochem. Health. 2009, 31, 147-57.
28. Sedlazeck, K. P.; Höllen, D.; Müller, P.; Mischitz, R.; Gieré, R. Mineralogical and geochemical characterization of a chromium contamination in an aquifer - a combined analytical and modeling approach. Appl. Geochem. 2017, 87, 44-56.
29. Zhang, W. J.; Lin, M. F. Influence of redox potential on leaching behavior of a solidified chromium contaminated soil. Sci. Total. Environ. 2020, 733, 139410.
30. Shi, J.; Chen, X.; Ye, B.; et al. A comparative study of DNAPL migration and transformation in confined and unconfined groundwater systems. Water. Res. 2023, 245, 120649.
Cite This Article
How to Cite
Download Citation
Export Citation File:
Type of Import
Tips on Downloading Citation
Citation Manager File Format
Type of Import
Direct Import: When the Direct Import option is selected (the default state), a dialogue box will give you the option to Save or Open the downloaded citation data. Choosing Open will either launch your citation manager or give you a choice of applications with which to use the metadata. The Save option saves the file locally for later use.
Indirect Import: When the Indirect Import option is selected, the metadata is displayed and may be copied and pasted as needed.
About This Article
Special Topic
Copyright

Data & Comments
Data
0


Comments
Comments must be written in English. Spam, offensive content, impersonation, and private information will not be permitted. If any comment is reported and identified as inappropriate content by OAE staff, the comment will be removed without notice. If you have any queries or need any help, please contact us at [email protected].