


fig3
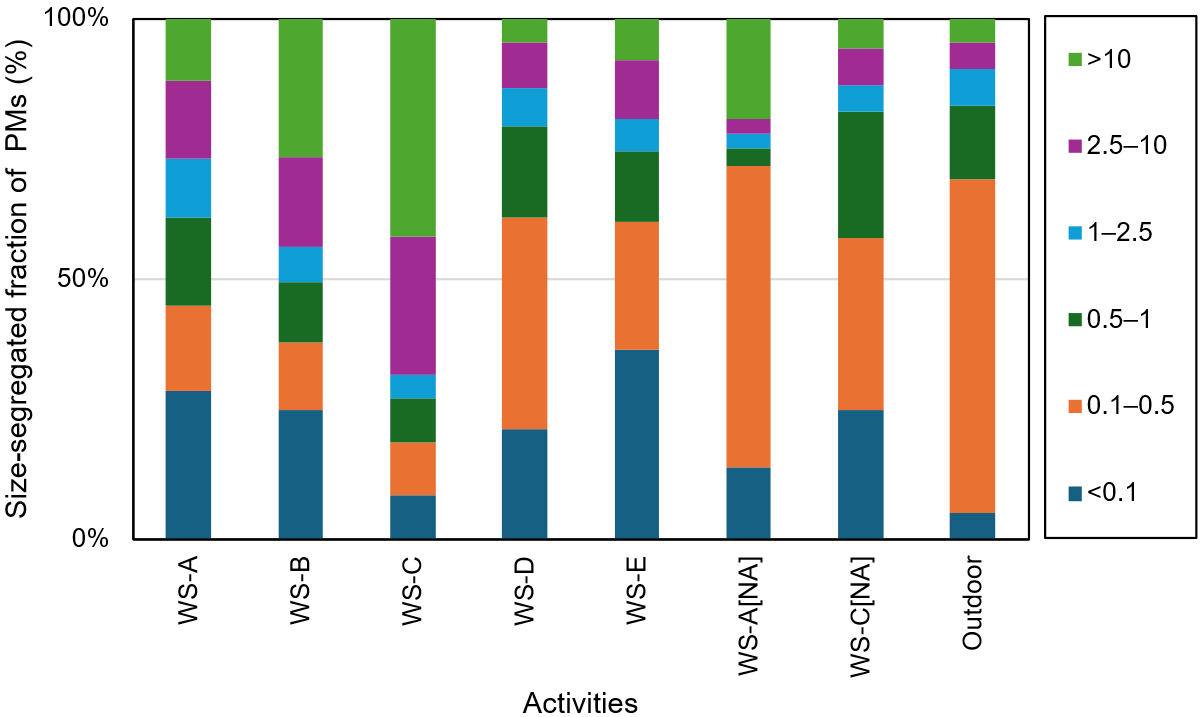
Figure 3. Stacked bar chart showing the distribution of PM size fractions across different blacksmith WS locations. The PM size categories include < 0.1 µm, 0.1-0.5 µm, 0.5-1.0 µm, 1.0-2.5 µm, 2.5-10 µm, and > 10 µm. Each bar represents the contribution of different PM size ranges to the total PM concentration at each location. Variations in particle size distribution indicate differences in emission sources and WS activities. WS-A[NA] and WS-C[NA] represent periods with no activities in the respective WSs, providing a comparison of PM concentrations during operational and non-operational conditions. PM: Particulate matter; WS: workshop.


