

Exposure to a mixture of four metals and associations with urinary oxidative stress biomarkers in Uruguayan adolescents
 0
0 Abstract
The effects of low-level exposure to metal mixtures on oxidative stress (OS) in adolescents are poorly understood. We examined the associations of blood concentrations of arsenic (As), cadmium (Cd), lead (Pb), and mercury (Hg) with urinary levels of F2-isoprostane (F2-IsoP) and 8-hydroxy-2’-deoxyguanosine (8-OHdG). Data for this cross-sectional study were drawn from the Salud Ambiental Montevideo cohort, which originally enrolled children at ages 6-8 years. In 2021-2023, participants - now aged 12.1 2.1 years - provided venous blood and spot urine samples. Metals were quantified in blood via Inductively Coupled Plasma-Tandem Mass Spectrometry (ICP-MS/MS), while urinary OS markers were measured using competitive enzyme immunoassay (F2-IsoP) and LC-MS (8-OHdG). Associations between metals, considered individually and as a mixture, and each OS marker were evaluated using multivariable linear regression and Bayesian Kernel Machine Regression, respectively. Of the 430 adolescents (49.3% male) who attended a study visit, 361 were included in the complete-case sample. Median blood concentrations were As 0.30 µg/L, Cd 0.06 µg/L, Hg 0.22 µg/L, and Pb 1.17 µg/dL. Correlations among metals were generally low. We observed no associations between individual metals and OS biomarkers, and no evidence of interactions among metals when modeled as a mixture. F2-IsoP concentrations decreased slightly with increasing quantiles of the metal mixture, but the effect size was minimal. The metal mixture was unrelated to
Keywords
INTRODUCTION
Children and adolescents are exposed to numerous environmental chemicals that can adversely affect their growth, health, and development[1,2]. Their vulnerability to pollutants arises from ongoing development, higher exposure relative to body weight, and immature detoxification systems[3,4]. Growing evidence shows that exposure to heavy metals is associated with detrimental health effects in children[5-8], and there is increasing focus on mixtures of metals, which better represent real-world exposures[9,10]. Chronic exposure to heavy metals such as arsenic (As), cadmium (Cd), lead (Pb), and mercury (Hg) can disrupt biological systems, affecting cell proliferation and repair, apoptosis, and genomic stability[11-13]. The potential harms posed by these metals throughout the lifecycle are reflected in their ranking on the U.S. Agency for Toxic Substances and Disease Registry’s National Priorities List: As (1st), Pb (2nd), Hg (3rd), and Cd (7th)[14].
Observational studies suggest that metals contribute to oxidative stress (OS) in children[15-21]. Heavy metals can induce OS through multiple mechanisms. For example, Pb, Cd, As, and Cr can generate reactive oxygen species (ROS), impair antioxidant defenses, and deactivate enzymes such as Glutathione Peroxidase - which converts hydrogen peroxide to water - and Catalase or Superoxide Dismutase - which convert hydrogen peroxide to water and oxygen[13,22-25]. Under normal physiological conditions, a balance exists between ROS generation and antioxidant activity[26]. When this equilibrium shifts toward pro-oxidants, normal cellular redox signaling is disrupted, causing molecular damage and OS. ROS can damage cellular structures through lipid peroxidation[27]. F2-isoprostanes (F2-isoPs), prostaglandin-like compounds formed by non-enzymatic peroxidation of arachidonic acid, serve as biomarkers of OS[28]. Elevated OS can also damage DNA and alter cellular mechanisms controlling the cell cycle, with 8-hydroxy-2’-deoxyguanosine (8-OHdG) serving as a biomarker of oxidative DNA damage[29,30]. OS has been implicated in cancer, cardiovascular disease, diabetes, neurodegenerative disorders, and inflammatory diseases[31-35], and evidence suggests that elevated OS levels, linked to metals, contribute to chronic disease development even before clinical symptoms appear[34,36-38].
Adolescence is a period of rapid physiological maturation and the emergence of risk factors for chronic disease. Despite this, surprisingly little research has investigated the effects of metals on adolescent health. In particular, the role of metals in generating OS during this critical life stage remains understudied[39]. Few epidemiological studies have examined the effects of low-level metal mixtures on OS biomarkers in adolescents. One study measured urinary heavy metals in adolescents aged 12-14 years living in a heavily contaminated area of Sicily and compared them with age-matched controls from less contaminated areas. Urinary Cd and Cr concentrations in adolescents from the contaminated area exceeded European reference values (geometric mean for Cd: 0.46 g/L, twice the RV; for Cr: 1.52 g/L, three times the RV). Exposed adolescents also had higher urinary 8-OHdG levels, which positively correlated with urinary Cd, As, and a composite exposure index[18]. Given the diseases associated with OS, the non-isolated nature of chemical exposures, the delayed onset of some OS-related diseases, and emerging evidence that pollutant toxicity is influenced by interactions among chemicals, it is critical to investigate how metal mixture exposure during adolescence relates to OS over the life course[40,41].
Accordingly, the objective of this cross-sectional study was to examine the association of blood As, Cd, Hg, and Pb - both individually and as a mixture - with urinary F2-isoP and 8-OHdG levels in adolescents from Montevideo, Uruguay, who experience relatively low metal exposure. F2-isoP and 8-OHdG were selected as they are commonly measured OS biomarkers in clinical and population studies[42] and reliably reflect systemic OS[39]. We hypothesized that, even in this low-exposure context, adolescents with higher blood levels of metal mixtures would exhibit higher urinary OS marker levels.
EXPERIMENTAL
Study setting
This study utilizes cross-sectional data from the Complex Mixtures, OS, and Cognition (MOX) Study, conducted within the Salud Ambiental Montevideo (SAM) cohort. The primary objective of MOX was to investigate the link between childhood exposure to chemical mixtures, OS, and cognitive performance. The SAM cohort initially enrolled and began longitudinal follow-up of elementary school children (approximately 7 years old) in 2011-2019, focusing on low-to-average-income communities in Montevideo, the capital and the largest city of Uruguay. These communities were considered at risk for metal exposure based on previous epidemiological research and/or information regarding the pediatric populations served by the Clinic for Environmental Contaminants at Pereira Rossell Hospital between 2004 and 2016[43].
Recruitment of participants
Eligibility criteria for participation in the SAM cohort were: (1) regular attendance in the first grade of elementary school; and (2) no prior diagnosis of Pb poisoning. Additional details on recruitment are provided elsewhere[43]. Previously enrolled SAM cohort participants were re-invited to join the MOX study in 2021-2022. Initial contact was made by telephone to inform families about the new study and assess interest in participation. Non-responders received a study flyer at their last known address. For participants who were difficult to reach, the SAM cohort staff conducted home visits to provide study information. Once a study visit was scheduled, caregivers were contacted twice by phone: one week before and on the day preceding the appointment. For participants under 18 years of age, caregivers provided written informed consent, while participants aged 18 years or older signed their own consent forms. The MOX study was approved by the Institutional Review Board at the University at Buffalo (STUDY00004845).
Study sample
Of the 682 participants originally enrolled in the SAM cohort, 421 returned between July 2021 and September 2022 for their first set of MOX evaluations. In 2022-2023, an additional 9 participants completed their first evaluations. These 430 participants with unique “first visit” evaluations represent a 63% follow-up response rate [Supplementary Figure 1]. Participants who returned did not differ from those who did not respond to the MOX invitation in key baseline characteristics, including child age, sex, socioeconomic status, maternal education, and employment.
MOX study procedure and measures
Participants attended a study visit at the Catholic University of Uruguay. A questionnaire was administered to accompanying caregivers to assess possible factors that could impact OS or metal exposure, including: (1) parental education (years), employment (days and hours), household assets, and housing conditions; (2) the presence of smokers in the household; and (3) the child’s recent health status. Questions on parental education, employment, household assets, and housing conditions were modeled after those used in Uruguay’s Population Census and have been included in regular cohort assessments since inception. Children’s Physical activity (PA) levels were also queried: children aged > 12 years answered for themselves, whereas caregivers responded for children younger than 12 years.
Secondhand smoke (SHS) exposure was estimated by inquiring about household smoking behaviors, including the number of smokers, the type of substances or devices used (cigarettes, cigars, e-cigarettes), whether smoking occurred indoors, and the number and frequency of people smoking indoors. Only one father and no mothers reported e-cigarette use in the overall cohort; therefore, SHS exposure at home was assumed to result from cigarette smoking. SHS exposure was quantified by counting the number of individuals who smoked indoors and assessing the typical duration of exposure on weekdays and weekends (never; < 1 h/day; 1-2 h/day; 3-5 h/day; >5 h/day). Responses were assigned numerical values and summed (range 0-8 points), with exposure classified as none, low (1-2 points), or higher (≥ 3 points) based on the distribution of responses.
PA levels were measured using the Physical Activity Questionnaire for Older Children (PAQ-C)[44], adapted for use in Uruguay. Scoring followed standard PAQ-C procedures, assigning values from 1 (no or low activity) to 5 (high activity) for participant responses (see Supplementary Table 1 for details). Question 1 assessed participation in specific sports and was adapted to exclude activities uncommon in this population, such as Ice hockey, Cross-country skiing, Floor hockey, Street hockey, Skateboarding, Badminton, (American) Football, Baseball, Tag, and Rowing, while including Horse riding. The mean score of all activities listed in Question 1 was computed. Questions 2-5 queried PA across various times and settings, including afternoons, immediately after school, and weekends. A summary PA score was calculated by averaging individual question scores, with higher scores indicating greater activity levels.
Recent colds or infections were assessed using a checklist of common symptoms, including cough, sore throat, difficulty swallowing, nasal congestion or runny nose, fever, chills and/or shivering, increased sweating, diarrhea, stomachache, vomiting, red or swollen eyes/eye infection, muscle aches, and fatigue. These questions were adapted from the Avon Longitudinal Study of Parents and Children, administered to parents of children from preschool age[45] to adolescence. A count variable representing the number of reported symptoms was created and categorized as 0, 1-2, or ≥ 3 symptoms.
Family SES was assessed via caregiver reports on household assets and possessions (e.g., TV, computer, automobile, video player, smartphone). Asset-based SES measures are commonly used in the literature as a “wealth index”, reflecting longer-term SES rather than short-term income or consumption, since assets accumulate over time[46]. In this study, responses were subjected to principal component analysis (PCA) to generate an asset score. As described elsewhere[47], the score had a mean of 0.0 ± 1.0 and was most strongly influenced by access to a fixed phone line, home internet, and personal automobiles. Higher scores indicated a greater number of possessions.
Anthropometry and blood pressure
Anthropometric and blood pressure measurements were obtained during a study visit by an experienced nutritionist. Children’s weight was measured in triplicate using a digital scale (Toledo model 2096, Negri, Quartino & Ferrari, Montevideo, Uruguay) while they wore light clothing. Height was measured in triplicate using a portable stadiometer (Seca 214, Shorr Productions, Columbia, MD). Final weight was calculated as the average of the three measurements minus the standard weight of children’s apparel. Body Mass Index (BMI) was calculated as weight (kg)/height squared (m2).
Blood pressure was measured after participants had been seated for 5 min, with the right arm supported at heart level on a table. After placing an appropriately sized cuff around the upper arm, 2 cm above the antecubital fossa, blood pressure was recorded using a digital sphygmomanometer (Hem 7211 LA, Omron Healthcare Co.). Systolic and diastolic blood pressure, as well as pulse rate, were documented.
Biochemical assessments
At the same visit, fasting blood samples were collected. Approximately 3 mL of blood was drawn into EDTA Vacutainer tubes (lavender top), which had been pre-certified by the analyzing laboratory for the detection of the specific low-level trace elements relevant to this study. Samples were stored at 4 °C until shipment to the analyzing laboratory on ice packs. Shipments occurred monthly via an international courier, accompanied by ice packs. Upon receipt, samples were transferred into pre-screened polypropylene tubes and stored at -80 °C until further processing and analysis.
Prior to the visit, participants were instructed to collect a first-morning urine sample in a sterile polyethylene cup provided to them. If collection on the morning of the visit was not possible, they were advised to provide a later sample rather than not at all. At the study center, a drop of urine was tested for specific gravity using a portable refractometer (PAL 10S, Atago Inc., USA). The remaining urine was mixed with 0.25 mL of 10% BHT (butylated hydroxytoluene) as a preservative, aliquoted, and stored at -80 °C. For analysis, urine samples were shipped on dry ice through a specialized courier.
Blood metals
Blood samples were analyzed for biomarkers of exposure by the Trace Elements Section, Laboratory of Inorganic and Nuclear Chemistry, Wadsworth Center, New York State Department of Health. Analyses were conducted using Inductively Coupled Plasma Tandem Mass Spectrometry (ICP-MS/MS; Thermo ScientificTM iCAPTM TQ), optimized for human biomonitoring studies[48]. Details of quality control procedures and calculation of limit of detection (LOD) are provided in the Supplementary Materials and Supplementary Tables 2-5. Although the method quantified 20 trace elements, only As, Cd, Hg, and Pb were included in the present study, as these elements represent the greatest concern for children’s health. The method LOD across two batches was: As, 0.045-0.088 µg/L; Cd, 0.058-0.072 µg/L; Hg, 0.11-0.14 µg/L; Pb, 0.04-0.065 µg/dL. For As and Pb, no values were < LOD, whereas 34% of Hg and 64% of Cd values were < LOD. For statistical analyses, all instrument-generated values were retained.
Urinary OS biomarkers
Urinary F2-IsoP levels were measured at the University at Buffalo. After solid-phase extraction, samples were analyzed in duplicate using a commercially available competitive enzyme immunoassay (EIA) kit (Cayman Chemical, Ann Arbor, MI). The average coefficient of variation (CV) was 12%. The urinary biomarker 8-OHdG was analyzed in triplicate by LC-MS (AB SCIEX API 4000 tandem MS coupled with a Waters Acquity UPLC) at Creative Proteomics, Inc. (Shirley, NY, USA), without prior solid-phase extraction. The average CV was 3.55%. Further details of the analytical methods are provided in the Supplementary Materials.
F2-IsoP and 8-OHdG levels were adjusted to the median specific gravity (1.025) to account for variation in fluid intake using the following equation:
Statistical analysis
All statistical analyses were performed using Stata 18 (StataCorp, College Station, TX, USA) and R 4.3.0 (R Foundation for Statistical Computing, Vienna, Austria). A two-sided P-value < 0.05 was considered statistically significant. Data were first checked for missing values and errors. Urinary 8-OHdG and F2-IsoP, corrected for specific gravity, were log-transformed and analyzed in separate regression models as continuous dependent variables. Predictor variables (blood metals) were also log-transformed and modeled as continuous variables.
Complete-case sample definition
Between 2021 and 2023, 430 participants provided follow-up samples and questionnaire data, representing a 63% response rate from the original cohort. Of these, 369 had valid observations for blood metals and urinary OS markers. An additional 8 participants were excluded due to incomplete covariate data, resulting in a final analytical sample of 361 [Supplementary Figure 1].
Descriptive statistics
Descriptive statistics were used to characterize the data. Continuous variables were summarized as mean ± SD or median [Interquartile Range], depending on distribution, and categorical variables as frequencies. Histograms were used to examine distributions of continuous variables. Log10 transformation was applied to exposure and outcome variables that were non-normally distributed. Scatterplots were generated to assess linearity between predictors and outcomes, and a Pearson correlation matrix was used to examine pairwise correlations among the four metals and two OS biomarkers.
Covariate selection
Covariates were identified through a literature review of potential confounders. A directed acyclic graph (DAG) was constructed using variables available in the study to identify those meeting the definition of confounders. The DAG assumed that exposures to different metals arise from correlated sources. Final covariates included age, sex, BMI, SES, illness symptoms, PA, and SHS. The DAG was created in DAGitty[50] [Supplementary Figure 2].
Linear regression analyses
Ordinary least squares regression was used to estimate associations between each metal (continuous, log-transformed) and each OS biomarker (continuous, log-transformed). Three models were run:
Model A: unadjusted;
Model B: adjusted for biological variables (age, sex, BMI);
Model C: further adjusted for SES, illness symptoms, PA, and SHS.
Bayesian Kernel Machine Regression analyses
Bayesian Kernel Machine Regression (BKMR) was used to estimate associations between metal mixtures and OS biomarkers, including potential higher-order interactions and joint effects[51].
A separate model was fitted for each OS biomarker:
OSi = h (Metal 1i, Metal 2i, Metal 3i, Metal 4i) + B1-n*
Selected covariatesi + ei
where h denotes the exposure-response function accounting for nonlinearity and interactions among mixture components, and ei represents random error. BKMR was run with default non-informative priors and 10,000 iterations, as presented in the original methods paper[51]. All models were adjusted for the selected covariates (age, sex, BMI, SES, illness symptoms, PA, and SHS).
RESULTS AND DISCUSSION
Sample characteristics
The mean age of participants reflects an early adolescent sample with a balanced distribution of boys and girls. The average BMI was 20.9 ± 4.7 kg/m2; however, 47% of adolescents had a BMI 85th percentile, indicating a high prevalence of overweight and obesity. On average, participants had blood pressure values within the healthy range, but 11.9% had systolic blood pressure 120, and 5.5% had diastolic blood pressure 80 mmHg. Participant characteristics did not differ meaningfully between the analytical sample and those excluded due to sibling status or missing data [Table 1].
Individual and family characteristics of Uruguayan adolescents participating in a study on metals and oxidative stress (n = 361), compared to individuals excluded due to missing observations
| Characteristics | Analytical sample [Mean ± SD, % or median (IQR)] | N | Individuals excluded from analysis [Mean ± SD, % or median (IQR)] |
| Adolescent characteristics | |||
| Age, years | 12.1 ± 2.2 | 69 | 12.4 ± 3.2 |
| Males | 49.3% | 60 | 43.5% |
| BMI, kg/m2 | 20.9 ± 4.7 | 69 | 21.0 ± 4.7 |
| Physical activity score | 1.7 (1.0, 2.2) | 84 | 1.5 (0.9, 2.1) |
| Secondhand smoke exposure None Low Higher | 38.2 41.8 19.9 | 68 | 38.2 47.1 14.7 |
| Illness symptoms in the previous week None 1-2 ≥ 3 | 37.4 42.4 20.2 | 65 | 42.2 35.9 21.8 |
| Systolic blood pressure, mmHg | 107.4 ± 11.4 | 69 | 105.3 ± 11.7 |
| Diastolic blood pressure, mmHg | 66.8 ± 8.6 | 69 | 67.9 ± 8.4 |
| Household characteristics | |||
| Household assets score | -0.006 ± 0.98 | 66 | 0.08 ± 1.02 |
| Maternal age, years | 38.3 ± 7.8 | 69 | 38.8 ± 6.3 |
| Maternal education, years | 8.7 ± 2.6 | 69 | 9.0 ± 3.4 |
| Exposure and endpoint measures | |||
| As, µg/L | 0.39 (0.32, 0.49) | 61 | 0.36 (0.31, 0.46) |
| Cd, µg/L | 0.06 (0.05, 0.08) | 61 | 0.06 (0.04, 0.08) |
| Hg, µg/L | 0.22 (0.09, 0.45) | 61 | 0.25 (0.12, 0.44) |
| Pb, µg/dL | 1.17 (0.86, 1.71) | 61 | 1.14 (0.78, 1.49) |
| 8-OHdG1, pg/mL | 232.5 (170.0, 309.7) | 60 | 225.0 (175.4, 358.4) |
| F2-IsoP1, pg/mL | 1,760.7 (1,370.7, 2,525.7) | 57 | 1,820.0 (1,378.3, 2,604.0) |
The median (IQR) blood concentrations of As, Cd, Hg, and Pb are shown in Table 1. Median values for three of these metals (Cd, Hg, Pb) are compared with those measured in 10-14-year-olds participating in the U.S. National Health and Nutrition Examination Survey (NHANES) in Supplementary Figure 3. As previously reported, blood As levels in this population are consistent with background exposure[47]. Blood metal concentrations were generally uncorrelated, except for As and Hg, which showed a modest correlation (r2 = 0.34; Supplementary Figure 4). Overall, exposure levels in this cohort were low, especially compared to populations living near industrial complexes. Blood Pb concentrations in our study were approximately three times higher than those observed in U.S. adolescents [Supplementary Figure 3], whereas Cd and Hg levels were comparable. The exposure range was also narrower than in other published studies. Direct comparisons of exposure metrics between SAM adolescents (this study) and SAM children at earlier ages are not possible, because current measures were obtained from blood, while earlier assessments were based on urinary biomarkers. Nonetheless, exposures during early childhood appear to have been somewhat higher. Several other studies have also used urinary metal concentrations, further limiting direct comparability.
Supplementary Table 6 summarizes methods for determining F2-IsoP and 8-OHdG, along with concentration levels reported in recent studies of metal mixtures and OS markers in children and pregnant women. In this cohort, urinary F2-Isop levels were similar to those measured when participants were approximately seven years old, while 8-OHdG levels were nearly five times higher[21]. By contrast, 8-OHdG levels in Uruguayan adolescents were lower than those reported for preschool children in Mainland China[20], school-aged children in Taiwan[15], and adolescents in Italy[18], all of whom lived in contaminated areas. These cross-study comparisons, however, should be interpreted cautiously due to methodological differences.
Substantial variability exists across studies in how urinary samples are stored, collected, processed, and analyzed to measure OS markers. We recently reported a strong correlation and substantial agreement (Kappa statistics) between OS markers measured in paired samples stored at -20 and -80 °C[52]. However, other methodological factors may influence results, including pre-processing procedures such as solid-phase extraction, the choice of analytical technique (e.g., high-performance liquid chromatography, considered the gold standard, vs. immunoassays), measurement precision (expressed as the CV), and adjustments for urinary dilution. In addition, differences in the timing of sample collection - both within the same day and across seasons - can introduce variability that may attenuate associations, particularly in studies with smaller sample sizes. There may also be diurnal and longer-term fluctuations in OS marker levels. For example, Li et al. measured diurnal and day-to-day variation in urinary 8-OHdG in adults over a one-month period[53]. Although each individual exhibited relatively stable 8-OHdG levels during the day, within-person variation across the month reached up to 27%. Similarly, a study of adolescents found considerable variability in median F2-IsoP levels across six sampling occasions[54].
Linear regression analyses
Supplementary Figure 5 illustrates the linear, though modest, relationships between blood metal concentrations and urinary OS biomarker levels, along with smoothed LOESS curves. Table 2 summarizes the associations of individual blood metals with urinary 8-OHdG and F2-IsoP levels in Uruguayan adolescents. No significant associations were observed between individual blood metals and 8-OHdG in any of the models. Similarly, no associations were detected between As, Cd, Hg or Pb and F2-IsoP.
Associations between individual blood metals and urinary 8-OHdG and F2-Isoprostane levels among Uruguayan adolescents (n = 361)
| Metal in blood1 | Model A2 | Model B3 | Model C4 |
| β (95%CI) | |||
| 8-OHdG5 | |||
| As | 0.04 (-0.07, 0.15) | 0.03 (-0.08, 0.14) | 0.04 (-0.07, 0.15) |
| Cd | 0.05 (-0.04, 0.14) | 0.03 (-0.05, 0.12) | 0.04 (-0.05, 0.13) |
| Hg | 0.001 (-0.04, 0.04) | -0.004 (-0.04, 0.03) | -0.002 (-0.04, 0.04) |
| Pb | -0.02 (-0.10, 0.07) | 0.01 (-0.08, 0.10) | -0.001 (-0.09, 0.09) |
| F2-Isoprostanes5 | |||
| As | 0.08 (-0.04, 0.20) | 0.04 (-0.07, 0.16) | 0.04 (-0.08, 0.16) |
| Cd | -0.03 (-0.12, 0.07) | -0.06 (-0.16, 0.03) | -0.06 (-0.15, 0.03) |
| Hg | -0.02 (-0.07, 0.01) | -0.04 (-0.08, 0.001) | -0.04 (-0.08, 0.003) |
| Pb | -0.01 (-0.11, 0.08) | 0.01 (-0.08, 0.11) | 0.01 (-0.09, 0.11) |
BKMR analyses
Supplementary Figure 6 displays the trace plots for the two BKMR models (A: 8-OHdG and B: F2-IsoPs). The univariate exposure-response plots [Supplementary Figure 7] are generally consistent with the linear regression results, showing only modest associations. For 8-OHdG, the 95% credible intervals (CrIs) were wide, indicating low precision. The bivariate exposure-response plots [Supplementary Figures 8 and 9] provide little evidence of interactions among metals.
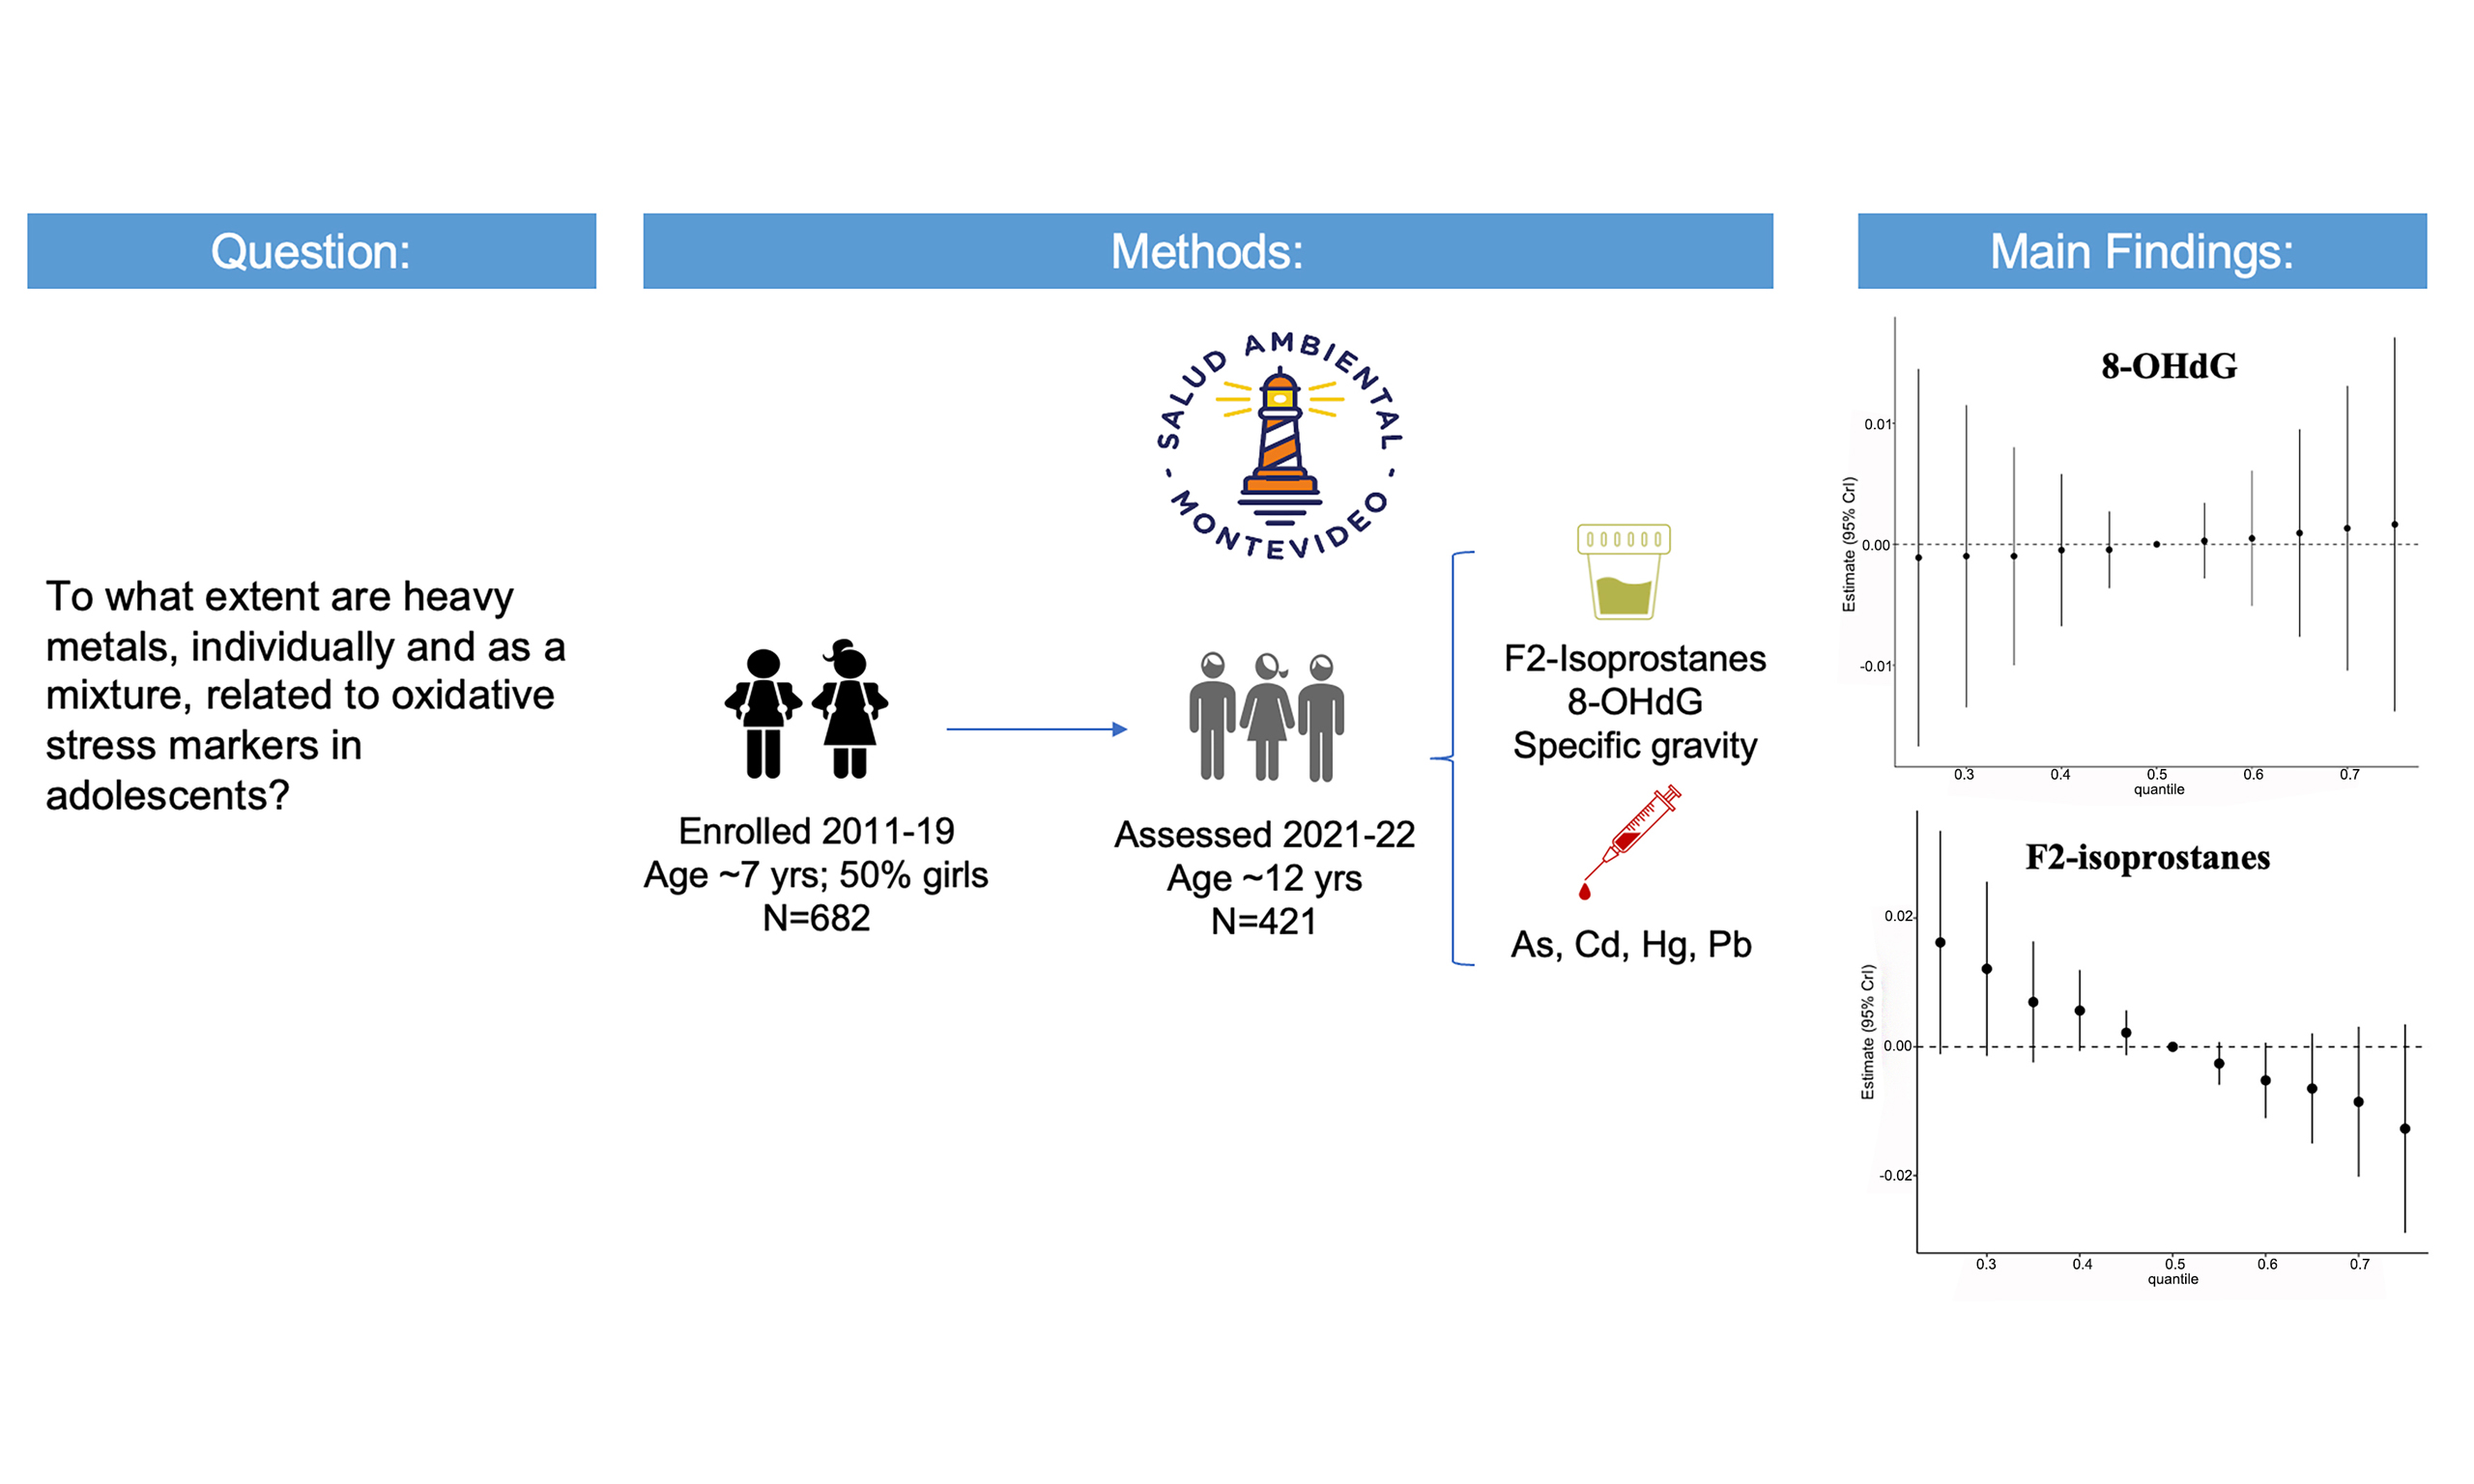
The combined effects of the four metals are shown in Figure 1 and Supplementary Table 7. Increasing percentiles of the mixture were not associated with urinary 8-OHdG. For urinary F2-IsoP, higher quantiles of the metal mixture were associated with slightly lower biomarker concentrations. However, the estimated associations were very small, and the wide confidence intervals for both OS biomarkers limit the ability to draw definitive conclusions about joint effects. As reported in Supplementary Table 8, the posterior inclusion probabilities (PIPs) from both models were very low. Among the four metals, blood Hg showed somewhat greater influence on the mixture effect than the others.
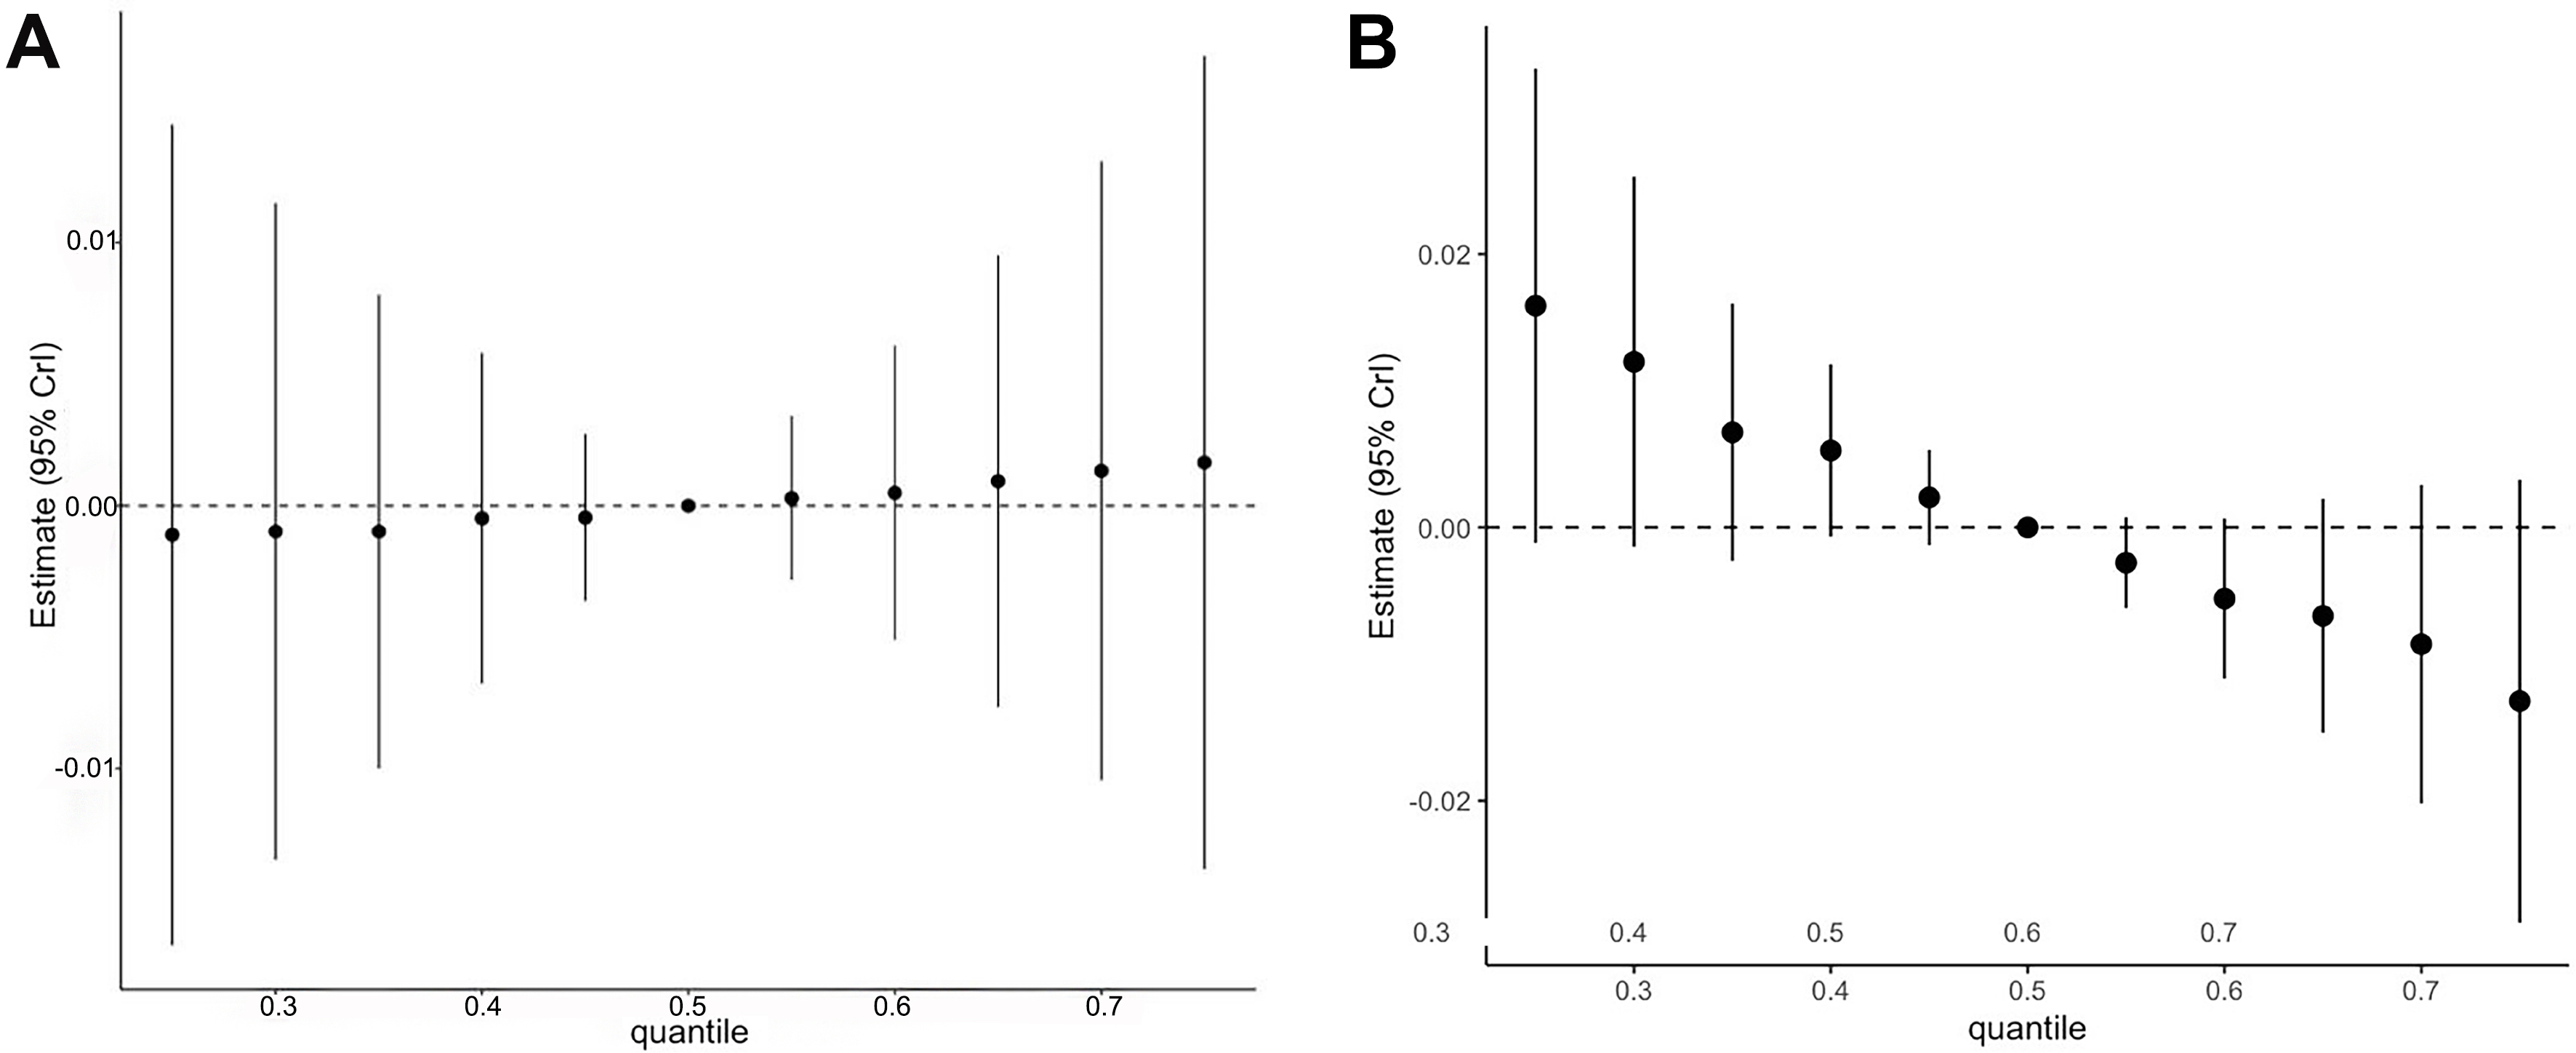
Figure 1. Overall association between the mixture of heavy metals (blood arsenic, cadmium, mercury, and lead) and urinary oxidative stress biomarkers in Uruguayan adolescents (n = 361)1. (A) 8-OhdG; (B) F2-isoprostanes. 1The metals in the mixture were log10-transformed and standardized. The mixture was modeled as increasing from the 25th to the 75th percentile in 5% increments. Models were adjusted for age, sex, BMI, SES, illness symptoms, physical activity score, and secondhand smoke exposure. 8-OHdG: 8-Hydroxy-2’-deoxyguanosine; BMI: body mass index; SES: socioeconomic status.
The literature on the effects of metal mixtures on OS in children is growing, but remains limited for adolescents. Most studies to date have been conducted in younger age groups. For example, when children in the SAM cohort were approximately 7 years old, we used weighted quantile sum regression to investigate associations between urinary As (median 9.6 μg/L) and Cd (median 0.06 μg/L), blood Pb (median
Looking more broadly across general population groups, studies among pregnant women show limited evidence of associations between metal exposure and OS. Pregnancy is a distinct physiological state characterized by elevated OS, and OS levels also increase with age[34]. For this reason, we do not directly compare these findings with our own but consider them informative for illustrating results in another population. For example, in Puerto Rico, pregnant women had mean urinary concentrations of Pb
It is important to consider how the selection of exposure biomarkers may influence the interpretation of our findings. Many pediatric studies use urine rather than blood to measure metal concentrations because urine collection is relatively simple, especially in children. However, the choice of biological matrix affects both the detection of metals and the reference period of exposure (hours, weeks, years), and it is also influenced by each metal’s metabolism in the body. For example, inorganic As is cleared from the blood within hours of ingestion, and its urinary excretion is facilitated by methylation[58]. Thus, blood As reflects exposure over approximately 6 h, whereas urinary As is generally thought to represent exposure within the past 4 days[59,60], although some reports extend this window to up to 1 month[58]. We recently examined the utility of blood As as a marker of exposure[47]. Based on robust correlations reported between blood and urinary As in adults, we concluded that blood As is a reliable biomarker for short-term exposure. Blood Cd, Hg, and Pb are generally considered indicators of “recent” exposure, though the time periods they reflect differ across metals[58]. The half-life of Cd in blood is around 100 days, but circulating Cd may also reflect existing body burdens. Blood Pb represents an exposure period of several months, but levels are influenced by Pb stored in bone. Blood Hg reflects exposure to all forms of Hg within the preceding 50 days[58]. In contrast, urinary Cd reflects exposure over years, while urinary Pb is not considered a reliable biomarker of exposure[58]. Given this wide range of half-lives (from 6 h to a few months), findings for individual metals and their mixtures based on these four biomarkers should be interpreted cautiously, unless there is clear evidence that exposures to all metals are chronic and stable in magnitude. Furthermore, because biomarkers differ in their interpretability and utility across studies, direct comparisons of results may not always be appropriate.
Beyond these considerations for exposure biomarkers, variability in the measurement and stability of OS biomarkers may also explain our null results and the discrepancies between our findings and those of other studies. As noted earlier, OS biomarkers may remain relatively stable within a day but show substantial variability over longer periods. This raises questions about how to interpret statistically significant or null associations in cross-sectional studies. For example, in our previous work, we found only a modest correlation (r2 = 0.25) in blood As measured in adolescents one year apart[47], suggesting that a single measurement may not capture “typical” exposure. Combined with the day-to-day variability of OS biomarkers, this makes a single cross-sectional snapshot of the exposure-outcome relationship potentially unreliable.
Differences in covariate adjustment across studies may also contribute. Our models accounted for several key factors known to influence OS, including PA and exposure to SHS. In contrast, among the pediatric studies cited above, one did not perform any covariate adjustment[18], another used highly parsimonious models[20], and a third adjusted for smoking, antioxidant intake, and other factors[15]. Nevertheless, residual confounding may partly explain our null results. For instance, dietary habits are strongly associated with OS[61,62], yet we did not collect dietary data from participants. Previous studies have shown that diets high in antioxidant-rich foods such as fruits and vegetables and low in pro-oxidant foods such as meat are associated with reduced levels of both 8-OHdG and F2-IsoP[63,64]. Thus, if adolescents were simultaneously exposed to heavy metals and dietary antioxidants, we may have been unable to disentangle their respective effects.
This study should be interpreted in light of its limitations. First, its cross-sectional design hinders our ability to infer causality. Second, despite rigorous quality control for all biomarkers, variation in the timing and handling of samples by participants before delivery to the study center may have introduced measurement error, adding noise to the observed associations. To address some of this variability, we adjusted urinary OS biomarkers for specific gravity to account for differences in urine dilution throughout the day. However, OS biomarkers were measured in only a single spot urine sample. Few studies have assessed how well a single measurement reflects OS levels over the course of a day or across longer periods, but available evidence suggests considerable variability[53,54], as discussed above.
Another consideration is the reduction in sample size due to missing data and the exclusion of siblings from the study. Although, as noted above, excluded participants did not differ from those in the analytical sample, these exclusions may have reduced the statistical power of the analyses. The final sample size was modest, with approximately 360 participants. Nevertheless, the study retained more than 90% power at an alpha of 0.05 to detect associations in linear models between individual blood metal concentrations and individual urinary OS biomarkers. To further evaluate statistical power, we estimated power for models testing pairwise interactions between metals, taking into account sample size, actual exposure and endpoint distributions, and observed associations in interaction models. Generally, the power to detect interactions exceeded 80%, except for those involving Hg with other metals. This is likely explained by the high proportion of values below the LOD. Our sample size is also comparable to other studies that used BKMR to assess associations between health endpoints and metal mixtures in children[56,65]. However, it is worth noting that the beta coefficients for the joint associations between the metal mixture and each endpoint were very small [Figure 1]. Even when statistically significant, the clinical significance of such small effect sizes remains uncertain.
In addition to the inability to adjust for dietary intake, the lack of adjustment for alcohol consumption warrants consideration. Alcohol is a well-recognized contributor to OS[66]. Alcohol consumption is not uncommon in Latin America and the Caribbean[67], although rates have been decreasing[68]. The average age of first alcohol consumption among Uruguayan students is around 13 years, with 45.3% beginning before age 15[69]. In our study, however, 57.4% of participants were < 12 years of age, and only 12.3% were > 15 years, suggesting that alcohol consumption was unlikely to play a major role in this cohort. Another limitation is the absence of data on early-life exposures, including the prenatal period. Certain metals, such as Pb, can accumulate in tissues and be gradually released into the bloodstream[58]. While we evaluated multiple metal exposures in the SAM cohort at school entry, these measures were available only for a subsample of children. Adjusting for prior exposures would have further reduced the sample size and was therefore not attempted. Finally, other potential contributors to OS, such as organic pollutants, were not measured or available in this study.
Despite these limitations, the study has several important strengths. First, few studies to date have explored the relationship between multiple metals and OS during adolescence, a critical developmental phase marked by growth and maturation of numerous physiological systems. Second, we employed two well-validated OS biomarkers to evaluate oxidative damage to lipids and DNA. Third, rigorous quality control procedures were implemented for both OS and metal biomarkers. F2-IsoP measurements were carried out in duplicate, while 8-OHdG was measured in triplicate, with all %CVs within acceptable ranges. Blood metals were analyzed at an NIH-supported Human Health Exposure Analysis Resource (HHEAR) laboratory specializing in trace element analysis in biological tissues and fluids. The Wadsworth HHEAR laboratory is fully accredited under the Clinical Laboratory Improvement Amendments (CLIA) in the United States and follows rigorous quality protocols. Blood collection tubes were pre-screened for trace element analysis, and all measurements were traceable to international standards. Fourth, the use of BKMR enabled the assessment of joint effects of multiple exposures and the estimation of nonlinear multivariable exposure-response functions. Finally, we collected data on covariates with biologically plausible roles in influencing OS, such as SHS exposure and PA levels.
CONCLUSIONS
Our investigation of the relationships between a mixture of blood metals and OS biomarkers among adolescents exposed to lower levels of metals revealed no evidence of associations. These findings, which do not support our original hypothesis, contrast with many previously published studies on metal mixtures. The discrepancy may reflect differences in exposure levels and patterns among adolescents, as well as the limitations of measuring urinary OS biomarkers at a single time point. Future studies should consider more complex mixtures, including non-metal exposures, and the effects of longer-term exposures on a broader range of OS and antioxidant defense biomarkers over time. Incorporating repeated OS measurements, larger sample sizes, and dietary data would further strengthen future studies.
DECLARATIONS
Acknowledgments
The authors acknowledge Gabriela Martínez for the preparation of chemicals and preservatives; nurse Delma Ribeiro for conducting the blood draws and sample processing; Ignacio Lima for sample preparation, storage, and shipment; Pedro Ares for activities related to participant recruitment/retention and for providing transportation to participants; and Federica Rodríguez for office and research administration. The authors would also like to acknowledge Ms. Charelle Trim, and members of the Wadsworth Clinical Trace Elements Lab for their technical assistance with blood analyses.
Authors’ contributions
Conception and design of the study: Kordas, K.; Quattrin, T.; Parsons, P. J.; Queirolo, E. I.
Acquisition, analysis, and interpretation of data: Kordas, K.; Glotzer, D. L.; Desai, G.; Ghazal, D.; Palmer, C. D.; Parsons, P. J.; Beledo, M. I.; Queirolo, E. I.
Manuscript drafting and editing: Kordas, K.; Glotzer, D. L.; Desai, G.; Ghazal, D.; Quattrin, T.; Palmer, C. D.; Parsons, P. J.; Beledo, M. I.; Queirolo, E. I.
Availability of data and materials
The data presented in this study are available in aggregate or de-identified form from the corresponding author upon reasonable request.
Conflicts of interest
All authors declared that there are no conflicts of interest.
Financial support and sponsorship
This work was supported by the National Institute of Environmental Health Sciences grants R21ES16523, R21ES019949, R01ES023423 (PI: Kordas), and R01ES031411 (MPI: Kordas/Queirolo).
Ethical approval and consent to participate
This study was conducted according to the principles detailed in the Declaration of Helsinki. The study protocol was approved by the Institutional Review Board at the University at Buffalo (STUDY00004845). Caregivers provided written consent for children; participants 18 years or older provided written consent for themselves.
Consent for publication
Not applicable.
Copyright
© The Author(s) 2025.
Supplementary Materials
REFERENCES
1. Grandjean, P.; Landrigan, P. J. Developmental neurotoxicity of industrial chemicals. Lancet 2006, 368, 2167-78.
2. CDC Stacks. Fourth National Report on Human Exposure to Environmental Chemicals. Updated Tables, March 2021: Volume Three: Analysis of Pooled Serum Samples for Select Chemicals, NHANES 2005–2016. https://stacks.cdc.gov/view/cdc/105344 (accessed 2025-09-29).
3. Landrigan, P. J.; Miodovnik, A. Children’s health and the environment: an overview. Mt. Sinai. J. Med. 2011, 78, 1-10.
4. Au, W. W. Susceptibility of children to environmental toxic substances. Int. J. Hyg. Environ. Health. 2002, 205, 501-3.
5. Flannery, B. M.; Schaefer, H. R.; Middleton, K. B. A scoping review of infant and children health effects associated with cadmium exposure. Regul. Toxicol. Pharmacol. 2022, 131, 105155.
6. O’Connor, L. E.; Spill, M. K.; Trivedi, R.; et al. Mercury exposure and childhood outcomes: an overview of systematic reviews. Environ. Res. 2025, 274, 121196.
7. Gu, Q.; Liu, J.; Zhang, X.; et al. Association between heavy metals exposure and risk of attention deficit hyperactivity disorder (ADHD) in children: a systematic review and meta-analysis. Eur. Child. Adolesc. Psychiatry. 2025, 34, 921-41.
8. Feiler, M. O.; Kulick, E. R.; Sinclair, K.; Spiegel, N.; Habel, S.; Castello, O. G. Toxic metals and pediatric clinical immune dysfunction: a systematic review of the epidemiological evidence. Sci. Total. Environ. 2024, 927, 172303.
9. Issah, I.; Duah, M. S.; Arko-Mensah, J.; Bawua, S. A.; Agyekum, T. P.; Fobil, J. N. Exposure to metal mixtures and adverse pregnancy and birth outcomes: a systematic review. Sci. Total. Environ. 2024, 908, 168380.
10. Tanner, E.; Lee, A.; Colicino, E. Environmental mixtures and children’s health: identifying appropriate statistical approaches. Curr. Opin. Pediatr. 2020, 32, 315-20.
11. de Burbure, C.; Buchet, J. P.; Leroyer, A.; et al. Renal and neurologic effects of cadmium, lead, mercury, and arsenic in children: evidence of early effects and multiple interactions at environmental exposure levels. Environ. Health. Perspect. 2006, 114, 584-90.
12. Koch, W.; Czop, M.; Iłowiecka, K.; Nawrocka, A.; Wiącek, D. Dietary intake of toxic heavy metals with major groups of food products-results of analytical determinations. Nutrients 2022, 14, 1626.
13. Balali-Mood, M.; Naseri, K.; Tahergorabi, Z.; Khazdair, M. R.; Sadeghi, M. Toxic mechanisms of five heavy metals: mercury, lead, chromium, cadmium, and arsenic. Front. Pharmacol. 2021, 12, 643972.
14. ATSDR. ATSDR Substance Priority List. https://www.atsdr.cdc.gov/programs/substance-priority-list.html. (accessed 2025-09-29).
15. Killian, B.; Yuan, T. H.; Tsai, C. H.; Chiu, T. H. T.; Chen, Y. H.; Chan, C. C. Emission-related heavy metal associated with oxidative stress in children: effect of antioxidant intake. Int. J. Environ. Res. Public. Health. 2020, 17, 3920.
16. Sughis, M.; Nawrot, T. S.; Haufroid, V.; Nemery, B. Adverse health effects of child labor: high exposure to chromium and oxidative DNA damage in children manufacturing surgical instruments. Environ. Health. Perspect. 2012, 120, 1469-74.
17. Wong, R. H.; Kuo, C. Y.; Hsu, M. L.; et al. Increased levels of 8-hydroxy-2 -deoxyguanosine attributable to carcinogenic metal exposure among schoolchildren. Environ. Health. Perspect. 2005, 113, 1386-90.
18. Pizzino, G.; Bitto, A.; Interdonato, M.; et al. Oxidative stress and DNA repair and detoxification gene expression in adolescents exposed to heavy metals living in the Milazzo-Valle del Mela area (Sicily, Italy). Redox. Biol. 2014, 2, 686-93.
19. Horn, S. R.; Leve, L. D.; Levitt, P.; Fisher, P. A. Childhood adversity, mental health, and oxidative stress: a pilot study. PLoS. One. 2019, 14, e0215085.
20. Liu, M.; Cheng, Y.; He, J.; Zhang, L.; Li, J.; Tan, L. Association between metal exposure and oxidative stress in preschool children and the moderating role of urinary creatinine. Environ. Chem. Ecotoxicol. 2024, 6, 338-46.
21. Kordas, K.; Roy, A.; Vahter, M.; et al. Multiple-metal exposure, diet, and oxidative stress in Uruguayan school children. Environ. Res. 2018, 166, 507-15.
22. Jaishankar, M.; Tseten, T.; Anbalagan, N.; Mathew, B. B.; Beeregowda, K. N. Toxicity, mechanism and health effects of some heavy metals. Interdiscip. Toxicol. 2014, 7, 60-72.
23. Valko, M.; Morris, H.; Cronin, M. T. Metals, toxicity and oxidative stress. Curr. Med. Chem. 2005, 12, 1161-208.
24. Jomova, K.; Valko, M. Advances in metal-induced oxidative stress and human disease. Toxicology 2011, 283, 65-87.
25. Sun, Q.; Li, Y.; Shi, L.; et al. Heavy metals induced mitochondrial dysfunction in animals: molecular mechanism of toxicity. Toxicology 2022, 469, 153136.
26. Graille, M.; Wild, P.; Sauvain, J. J.; Hemmendinger, M.; Guseva, Canu. I.; Hopf, N. B. Urinary 8-isoprostane as a biomarker for oxidative stress. A systematic review and meta-analysis. Toxicol. Lett. 2020, 328, 19-27.
27. Valko, M.; Rhodes, C. J.; Moncol, J.; Izakovic, M.; Mazur, M. Free radicals, metals and antioxidants in oxidative stress-induced cancer. Chem. Biol. Interact. 2006, 160, 1-40.
28. Ma, E.; Ingram, K. H.; Milne, G. L.; Garvey, W. T. F2-isoprostanes reflect oxidative stress correlated with lean mass and bone density but not insulin resistance. J. Endocr. Soc. 2017, 1, 436-48.
30. Sies, H. Oxidative stress: a concept in redox biology and medicine. Redox. Biol. 2015, 4, 180-3.
31. Pisoschi, A. M.; Pop, A. The role of antioxidants in the chemistry of oxidative stress: a review. Eur. J. Med. Chem. 2015, 97, 55-74.
32. Bhattacharyya, A.; Chattopadhyay, R.; Mitra, S.; Crowe, S. E. Oxidative stress: an essential factor in the pathogenesis of gastrointestinal mucosal diseases. Physiol. Rev. 2014, 94, 329-54.
33. Elmarakby, A. A.; Sullivan, J. C. Relationship between oxidative stress and inflammatory cytokines in diabetic nephropathy. Cardiovasc. Ther. 2012, 30, 49-59.
34. Liguori, I.; Russo, G.; Curcio, F.; et al. Oxidative stress, aging, and diseases. Clin. Interv. Aging. 2018, 13, 757-72.
35. Rahal, A.; Kumar, A.; Singh, V.; et al. Oxidative stress, prooxidants, and antioxidants: the interplay. Biomed. Res. Int. 2014, 2014, 761264.
36. Pizzino, G.; Irrera, N.; Cucinotta, M.; et al. Oxidative stress: harms and benefits for human health. Oxid. Med. Cell. Longev. 2017, 2017, 8416763.
37. Phaniendra, A.; Jestadi, D. B.; Periyasamy, L. Free radicals: properties, sources, targets, and their implication in various diseases. Indian. J. Clin. Biochem. 2015, 30, 11-26.
38. Carroquino, M. J.; Posada, M.; Landrigan, P. J. Environmental toxicology: children at risk. In Environmental Toxicology; Laws, E. A., Eds.; Springer: New York, 2013; pp 239-91.
39. Samsonov, A.; Urlacher, S. S. Oxidative stress in children and adolescents: insights into human biology. Am. J. Hum. Biol. 2025, 37, e24200.
40. Henn B, Coull BA, Wright RO. Chemical mixtures and children’s health. Curr. Opin. Pediatr. 2014, 26, 223-9.
41. Carpenter, D. O.; Arcaro, K.; Spink, D. C. Understanding the human health effects of chemical mixtures. Environ. Health. Perspect. 2002, 110 Suppl 1, 25-42.
42. Frijhoff, J.; Winyard, P. G.; Zarkovic, N.; et al. Clinical relevance of biomarkers of oxidative stress. Antioxid. Redox. Signal. 2015, 23, 1144-70.
43. Queirolo, E. I.; Kordas, K.; Martínez, G.; Ahmed, Z.; Barg, G.; Mañay, N. Secular trends in blood lead concentrations of school-age children in Montevideo, Uruguay from 2009 to 2019. Environ. Pollut. 2024, 343, 123160.
44. Kowalski, K.C., Crocker, P.R.E., Donen, R.M. The physical activity questionnaire for older children (PAQ-C) and adolescents (PAQ-A) manual. 2004. https://www.prismsports.org/UserFiles/file/PAQ_manual_ScoringandPDF.pdf. (accessed 2025-09-23).
45. Hay, A.D., Heron, J., Ness, A.; ALSPAC study team. The prevalence of symptoms and consultations in pre-school children in the Avon Longitudinal Study of Parents and Children (ALSPAC): a prospective cohort study. Fam Pract 2005, 22, 367-74.
46. Poirier, M. J. P.; Grépin, K. A.; Grignon, M. Approaches and alternatives to the wealth index to measure socioeconomic status using survey data: a critical interpretive synthesis. Soc. Indic. Res. 2020, 148, 1-46.
47. Rodríguez, D.; Desai, G.; Barg, G.; et al. Low-level arsenic exposure, childhood neighborhood disadvantage, and executive functions in adolescents from Montevideo, Uruguay. Environ. Res. 2025, 279, 121791.
48. Palmer, C. D.; Lewis, M. E.; Geraghty, C. M.; Barbosa, F.; Parsons, P. J. Determination of lead, cadmium and mercury in blood for assessment of environmental exposure: a comparison between inductively coupled plasma-mass spectrometry and atomic absorption spectrometry. Spectrochim. Acta. B. At. Spectrosc. 2006, 61, 980-90.
49. Kuiper, J. R.; O’Brien, K. M.; Ferguson, K. K.; Buckley, J. P. Urinary specific gravity measures in the U.S. population: implications for the adjustment of non-persistent chemical urinary biomarker data. Environ. Int. 2021, 156, 106656.
50. Textor, J.; van, der. Zander. B.; Gilthorpe, M. S.; Liskiewicz, M.; Ellison, G. T. Robust causal inference using directed acyclic graphs: the R package ‘dagitty’. Int. J. Epidemiol. 2016, 45, 1887-94.
51. Bobb, J. F.; Valeri, L.; Claus, Henn. B.; et al. Bayesian kernel machine regression for estimating the health effects of multi-pollutant mixtures. Biostatistics 2015, 16, 493-508.
52. Kordas, K.; Ghazal, D.; Queirolo, E. I.; Olson, J. R.; Beledo, M. I.; Browne, R. W. Temperature stability of urinary F2-isoprostane and 8-hydroxy-2’-deoxyguanosine. Pract. Lab. Med. 2024, 39, e00373.
53. Li, Y. S.; Kawasaki, Y.; Watanabe, S.; Ootsuyama, Y.; Kasai, H.; Kawai, K. Diurnal and day-to-day variation of urinary oxidative stress marker 8-hydroxy-2’-deoxyguanosine. J. Clin. Biochem. Nutr. 2021, 68, 18-22.
54. Zeng, X.; Tian, G.; Zhu, J.; et al. Air pollution associated acute respiratory inflammation and modification by GSTM1 and GSTT1 gene polymorphisms: a panel study of healthy undergraduates. Environ. Health. 2023, 22, 14.
55. Ashrap, P.; Watkins, D. J.; Milne, G. L.; et al. Maternal urinary metal and metalloid concentrations in association with oxidative stress biomarkers. Antioxidants 2021, 10, 114.
56. Kim, S. S.; Meeker, J. D.; Keil, A. P.; et al. Exposure to 17 trace metals in pregnancy and associations with urinary oxidative stress biomarkers. Environ. Res. 2019, 179, 108854.
57. Zhang, M.; Liu, C.; Li, W. D.; et al. Individual and mixtures of metal exposures in associations with biomarkers of oxidative stress and global DNA methylation among pregnant women. Chemosphere 2022, 293, 133662.
58. Martinez-Morata, I.; Sobel, M.; Tellez-Plaza, M.; Navas-Acien, A.; Howe, C. G.; Sanchez, T. R. A state-of-the-science review on metal biomarkers. Curr. Environ. Health. Rep. 2023, 10, 215-49.
59. Hughes, M. F. Biomarkers of exposure: a case study with inorganic arsenic. Environ. Health. Perspect. 2006, 114, 1790-6.
60. Normandin, L.; Ayotte, P.; Levallois, P.; et al. Biomarkers of arsenic exposure and effects in a Canadian rural population exposed through groundwater consumption. J. Expo. Sci. Environ. Epidemiol. 2014, 24, 127-34.
61. Fewell, Z.; Davey, Smith. G.; Sterne, J. A. The impact of residual and unmeasured confounding in epidemiologic studies: a simulation study. Am. J. Epidemiol. 2007, 166, 646-55.
62. Okubo, H., Nakayama, S.F.; Japan Environment and Children’s Study Group. Periconceptional maternal diet quality influences blood heavy metal concentrations and their effect on low birth weight: the Japan Environment and Children’s Study. Environ Int 2023, 173, 107808.
63. Meyer, K. A.; Sijtsma, F. P.; Nettleton, J. A.; et al. Dietary patterns are associated with plasma F2-isoprostanes in an observational cohort study of adults. Free. Radic. Biol. Med. 2013, 57, 201-9.
64. Whalen, K. A.; McCullough, M. L.; Flanders, W. D.; Hartman, T. J.; Judd, S.; Bostick, R. M. Paleolithic and mediterranean diet pattern scores are inversely associated with biomarkers of inflammation and oxidative balance in adults. J. Nutr. 2016, 146, 1217-26.
65. García-Villarino, M.; Signes-Pastor, A. J.; Karagas, M. R.; et al. Exposure to metal mixture and growth indicators at 4-5 years. A study in the INMA-Asturias cohort. Environ. Res. 2022, 204, 112375.
67. Probst, C.; Monteiro, M.; Smith, B.; Caixeta, R.; Merey, A.; Rehm, J. Alcohol policy relevant indicators and alcohol use among adolescents in Latin America and the Caribbean. J. Stud. Alcohol. Drugs. 2018, 79, 49-57.
68. Pengpid, S.; Peltzer, K.; Rodríguez, M. J. Adolescent health-risk behaviours in Uruguay: patterns from national cross-sectional school surveys conducted in 2006, 2012 and 2019. Trop. Med. Int. Health. 2024, 29, 801-12.
69. JND. Sexta encuesta nacional sobre consumo de drogas en estudiantes de enseñanza media. Uruguay 2014. https://extranet.who.int/fctcapps/sites/default/files/2023-04/uruguay_2018_annex-1_national_survey_on_drug_use_in_high_school_students_2014.pdf. (accessed 2025-09-23).
Cite This Article
How to Cite
Download Citation
Export Citation File:
Type of Import
Tips on Downloading Citation
Citation Manager File Format
Type of Import
Direct Import: When the Direct Import option is selected (the default state), a dialogue box will give you the option to Save or Open the downloaded citation data. Choosing Open will either launch your citation manager or give you a choice of applications with which to use the metadata. The Save option saves the file locally for later use.
Indirect Import: When the Indirect Import option is selected, the metadata is displayed and may be copied and pasted as needed.
About This Article
Special Topic
Copyright

Data & Comments
Data
0


Comments
Comments must be written in English. Spam, offensive content, impersonation, and private information will not be permitted. If any comment is reported and identified as inappropriate content by OAE staff, the comment will be removed without notice. If you have any queries or need any help, please contact us at [email protected].