

Heavy metal analysis in commercial spices and herbs by inductively coupled plasma mass spectrometry (ICP-MS) and estimated dietary exposure
 0
0 Abstract
Spices and herbs are widely used food ingredients with both cultural and dietary importance, but there is a concern that these products contain heavy metal contaminants. In this study, the levels of heavy metals (aluminium, arsenic, cadmium, chromium, lead, mercury, nickel, strontium) were investigated in dried spice and herb samples
Keywords
INTRODUCTION
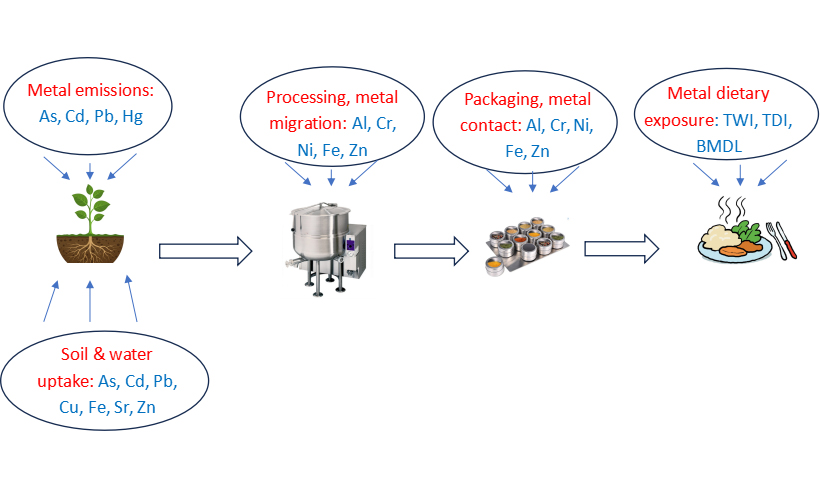
The use of spices and herbs in cooking, food preservation, and flavoring has a long history in human diets and nutrition. The global spice trade was valued at US $ 4.3 billion in 2016, and continues to grow annually[1]. However, the increasing global demand for high-quality spices and herbs has also caused a rise in fraudulent practices, including adulteration and fortification[2]. Beyond their culinary value, spices and herbs are recognized for their potential health benefits, including protective effects against cardiovascular and neurodegenerative diseases, cancer, and diabetes[3-5]. These health-promoting properties are largely attributed to bioactive substances such as polyphenols and flavonoids, which exhibit antioxidant, anti-inflammatory, and antibacterial activities[6-8]. Despite these benefits, spices and herbs may also contain hazardous contaminants such as mycotoxins, aflatoxins, pesticides, and carcinogenic heavy metals[9,10]. Heavy metal contamination in spices and herbs can occur through plant uptake from contaminated soil and water[11], or during processing via contact with equipment and packaging materials[12,13]. Chronic dietary exposure to toxic metals such as lead, cadmium, and mercury is associated with serious health risks, including kidney damage, neurodevelopmental impairment, and organ dysfunction[14-16]. To mitigate such risks, several countries have established permissible limits for heavy metals in spices and herbs. In Bangladesh, for example, the Bangladesh Standards and Testing Institution sets the maximum allowable lead concentration in turmeric at 2.5 mg/kg[17]. In the United States, high levels of lead detected in imported ground turmeric have led to product recalls, with many of the affected products originating from Asian countries[1,18]. Although the U.S. Food and Drug Administration (FDA) has the authority to regulate and restrict contaminated products, it has not yet established specific legislative limits for heavy metals in spices and herbs[18]. Other countries have also reported heavy metal levels in various spice and herbal products and the monitoring of metal exposure from consumption of spices and herbs in a population[8,15,19-21]. In Europe, the Commission Regulation (EU) No. 1881/2006 and subsequent amendments (No. 1317/2021) have set maximum permissible levels of lead at 0.80 mg/kg in fresh turmeric and ginger, and 2.0 mg/kg in dried bark spices. For cadmium, the limit is 0.20 mg/kg in fresh herbs (amendments No. 1323/2021)[22-23]. In contrast, there is limited information available on heavy metal contamination in commercial spices and herbs in Australia. In this study, the concentrations of heavy metals in spices and herbs were analyzed using inductively coupled plasma mass spectrometry (ICP-MS). The objectives were: (1) to determine heavy metal levels in a wide range of imported and locally produced spice and herb products; (2) to provide data for inclusion in the Australian Food Composition Database; and (3) to assess the contribution of spices and herbs to dietary heavy metal exposure.
EXPERIMENTAL
Sample collection
Dried powdered samples of commercial spices and herbs (n = 69; basil, chilli, cinnamon, paprika, black pepper, sesame seeds, and turmeric) imported from different countries were purchased from selected markets and outlets in Queensland, Australia. A description of the spice and herb samples by country of origin is shown in Table 1. In addition, dried samples of organic turmeric (n = 7) and non-organic turmeric (n = 13) were obtained from local markets.
Samples of spices and herbs
| Spices and herbs | Scientific name | Country | Number of samples |
| Basil | Ocimum basilicum | Egypt | 1 |
| Unknown* | 1 | ||
| Chilli | Capsicum frutescens | China | 1 |
| India | 10 | ||
| Malaysia | 3 | ||
| Unknown | 3 | ||
| Cinnamon | Cinnamomum verum | China | 1 |
| India | 1 | ||
| Sri Lanka | 2 | ||
| Vietnam | 2 | ||
| Unknown | 4 | ||
| Paprika | Capsicum annuum | China | 1 |
| India | 2 | ||
| Malaysia | 1 | ||
| Spain | 3 | ||
| Unknown | 4 | ||
| Black pepper | Piper nigrum | China | 2 |
| India | 4 | ||
| Malaysia | 1 | ||
| Sri Lanka | 1 | ||
| Vietnam | 2 | ||
| Sesame seeds | Sesamum indicum | India | 8 |
| Unknown | 1 | ||
| Turmeric | Curcuma longa | Bangladesh | 1 |
| India | 7 | ||
| Malaysia | 1 | ||
| Fiji | 1 | ||
| Total samples | 69 |
Heavy metal analysis
The concentrations of heavy metals - aluminium (Al), cadmium (Cd), chromium (Cr), lead (Pb), mercury (Hg), nickel (Ni), strontium (Sr) - and the metalloid arsenic (As) were determined using ICP-MS (8800 ICP-MS Triple Quad, Agilent Technologies, Tokyo, Japan) following microwave-assisted digestion (CEM MARS 6, USA). For consistency in discussion, As is referred to as a heavy metal throughout the text. Standard reference materials (ERM CE-278K Mussel Tissue, NIST SRM 1547 Peach Leaves) were used for quality control and validation of the analytical method. Further details of the procedure have been reported elsewhere[24]. Briefly, 0.3-0.5 g of dried sample was weighed and digested with 5 mL of high-purity nitric acid (69%, Seastar Chemicals, Canada). Following acid addition, the samples were left to stand overnight to allow gradual digestion and gas release. Microwave-assisted digestion was then performed using a three-step program: Step 1 - 400 W, ramp 7 min to 85 °C, hold 5 min; Step 2 - 800 W, ramp 10 min to 110 °C, hold 10 min; Step 3 – 1,600 W, ramp 7 min to 165 °C, hold 10 min. The digested solutions were diluted to 40 mL with high-purity deionized water (Aqua Cure, Burscough, UK) prior to ICP-MS analysis. The ICP-MS system was equipped with an Agilent SPS 4 autosampler, and samples were introduced via the Integrated Sample Introduction System (ISIS) (Agilent Technologies, Victoria, Australia). The operating conditions are summarized in Table 2. Standard reference materials were subjected to the same preparation and analytical procedure as the test samples. Limits of detection (LOD) were established from 20 blank measurements and calculated as three times the standard deviation of the blanks. Limits of reporting (LOR) were determined as ten times the standard deviation of the blanks.
ICP-MS Operating conditions (Agilent 8800)
| Parameters | |
| Cones | Platinum |
| RF power (W) | 1550 |
| RF matching (V) | 1.80 |
| Sample depth (mm) | 8.0 |
| Argon flow rate (L/min) | 15 |
| Auxiliary gas flow rate (L/min) | 0.9 |
| Nebulizer gas flow rate (mL/min) | 0.99 |
| Nebulizer pump (rps) | 0.1 |
| Spray chamber temp. (°C) | 2.0 |
| Sample uptake rate (mL/min) | 0.1 |
| Number of replicates | 3 |
| Integration time (s) | 0.30-3.0 |
| He flow rate (mL/min) | 5.0 |
| O2 flow rate (%) | 30 |
| No gas mode: Sensitivity | 7Li >3,400 counts/0.1sec/1µg/L 89Y >13,000 counts/0.1sec/1µg/L 205Tl > 4,800 counts/0.1sec/1µg/L |
| Oxides | 156CeO+/140Ce+ < 1% |
| He gas mode: Sensitivity | 59Co > 1,500 counts/0.1sec/1µg/L |
| O2 gas mode: Sensitivity | 89Y>105Y >700counts/0.1sec/1ug/L |
Statistical analysis
Descriptive statistics and non-parametric analysis (Mann-Whitney test) were performed using IBM SPSS Statistics (version 29.0.2; IBM Corporation, USA). Boxplots of heavy metal concentrations in spices were generated using R version 4.0.4 (R Foundation for Statistical Computing). For statistical purposes, metal concentrations below the LOR were replaced with the LOR values and treated as minimum values.
RESULTS AND DISCUSSION
Method validation and quality control
Sample digestion in sealed Teflon digestion vessels using a microwave digestion system was found to be both efficient and rapid, with no evidence of carry-over or cross-contamination. The optimized operating conditions of the ICP-MS provided high sensitivity for detecting trace levels of heavy metals in spice products [Table 2]. Calibration curves were linear across the concentration range of 0.1-100 µg/L, with correlation coefficients (r) of 0.9997 or higher. Scandium, rhodium, and iridium were used as internal standards. Method accuracy was validated by analyzing heavy metal concentrations in standard reference materials (SRMs) as quality controls. Recoveries were within the certified ranges for all elements except aluminium, which showed a recovery of 68.5%. This lower recovery is likely attributable to a matrix effect caused by the high aluminium content in the reference sample. The LOD, LOR, and recoveries of metals from SRMs are presented in Table 3. Our laboratory also regularly participates in the proficiency testing program organized by the National Measurement Institute (NMI), Australia, for trace metal analysis in food products. Consistently, our results fall within the assigned reference values and Z-scores[25].
LOD, LOR, and recoveries of heavy metals from SRMs
| Elements (mg/kg) | LOD | LOR | This study | QC311 ERM - CE278k mussel tissue | Recovery (%) | This study | QC320 NIST SRM 1547 peach leaves | Recovery (%) | ||
| Mean ± SD (n = 8) | Certified values | Uncertainty | Mean ± SD (n = 5) | Certified values | Uncertainty | |||||
| Aluminium | 0.04 | 0.1 | 55.6 ± 2.5 | *- | - | - | 170.5 ± 4.8 | 248.9 | 6.5 | 68.5 |
| Arsenic | 0.001 | 0.005 | 6.51 ± 0.88 | 6.7 | 0.4 | 97.2 | 0.066 ± 0.013 | 0.062 | 0.014 | 105.7 |
| Cadmium | 0.001 | 0.005 | 0.32 ± 0.04 | 0.336 | 0.025 | 94.6 | 0.025 ± 0.004 | 0.0261 | 0.0022 | 95.6 |
| Chromium | 0.006 | 0.01 | 0.54 ± 0.06 | 0.73 | 0.22 | 73.5 | 0.65 ± 0.04 | *- | - | - |
| Lead | 0.002 | 0.005 | 2.04 ± 0.20 | 2.18 | 0.18 | 93.5 | 0.789 ± 0.34 | 0.869 | 0.018 | 90.8 |
| Mercury | 0.001 | 0.005 | 0.065 ± 0.018 | 0.071 | 0.007 | 92.0 | 0.026 ± 0.002 | 0.0317 | 0.0043 | 82.8 |
| Nickel | 0.003 | 0.01 | 0.62 ± 0.07 | 0.69 | 0.15 | 90.1 | 0.55 ± 0.05 | 0.689 | 0.095 | 80.4 |
| Strontium | 0.003 | 0.01 | 16.9 ± 1.7 | 19 | 1.2 | 88.9 | 54.8 ± 4.7 | 53 | 5.0 | 103.4 |
Levels of heavy metals in spices and herbs
Arsenic, cadmium, mercury and lead
The concentrations of heavy metals in spices and herbs varied widely, with broad distribution ranges
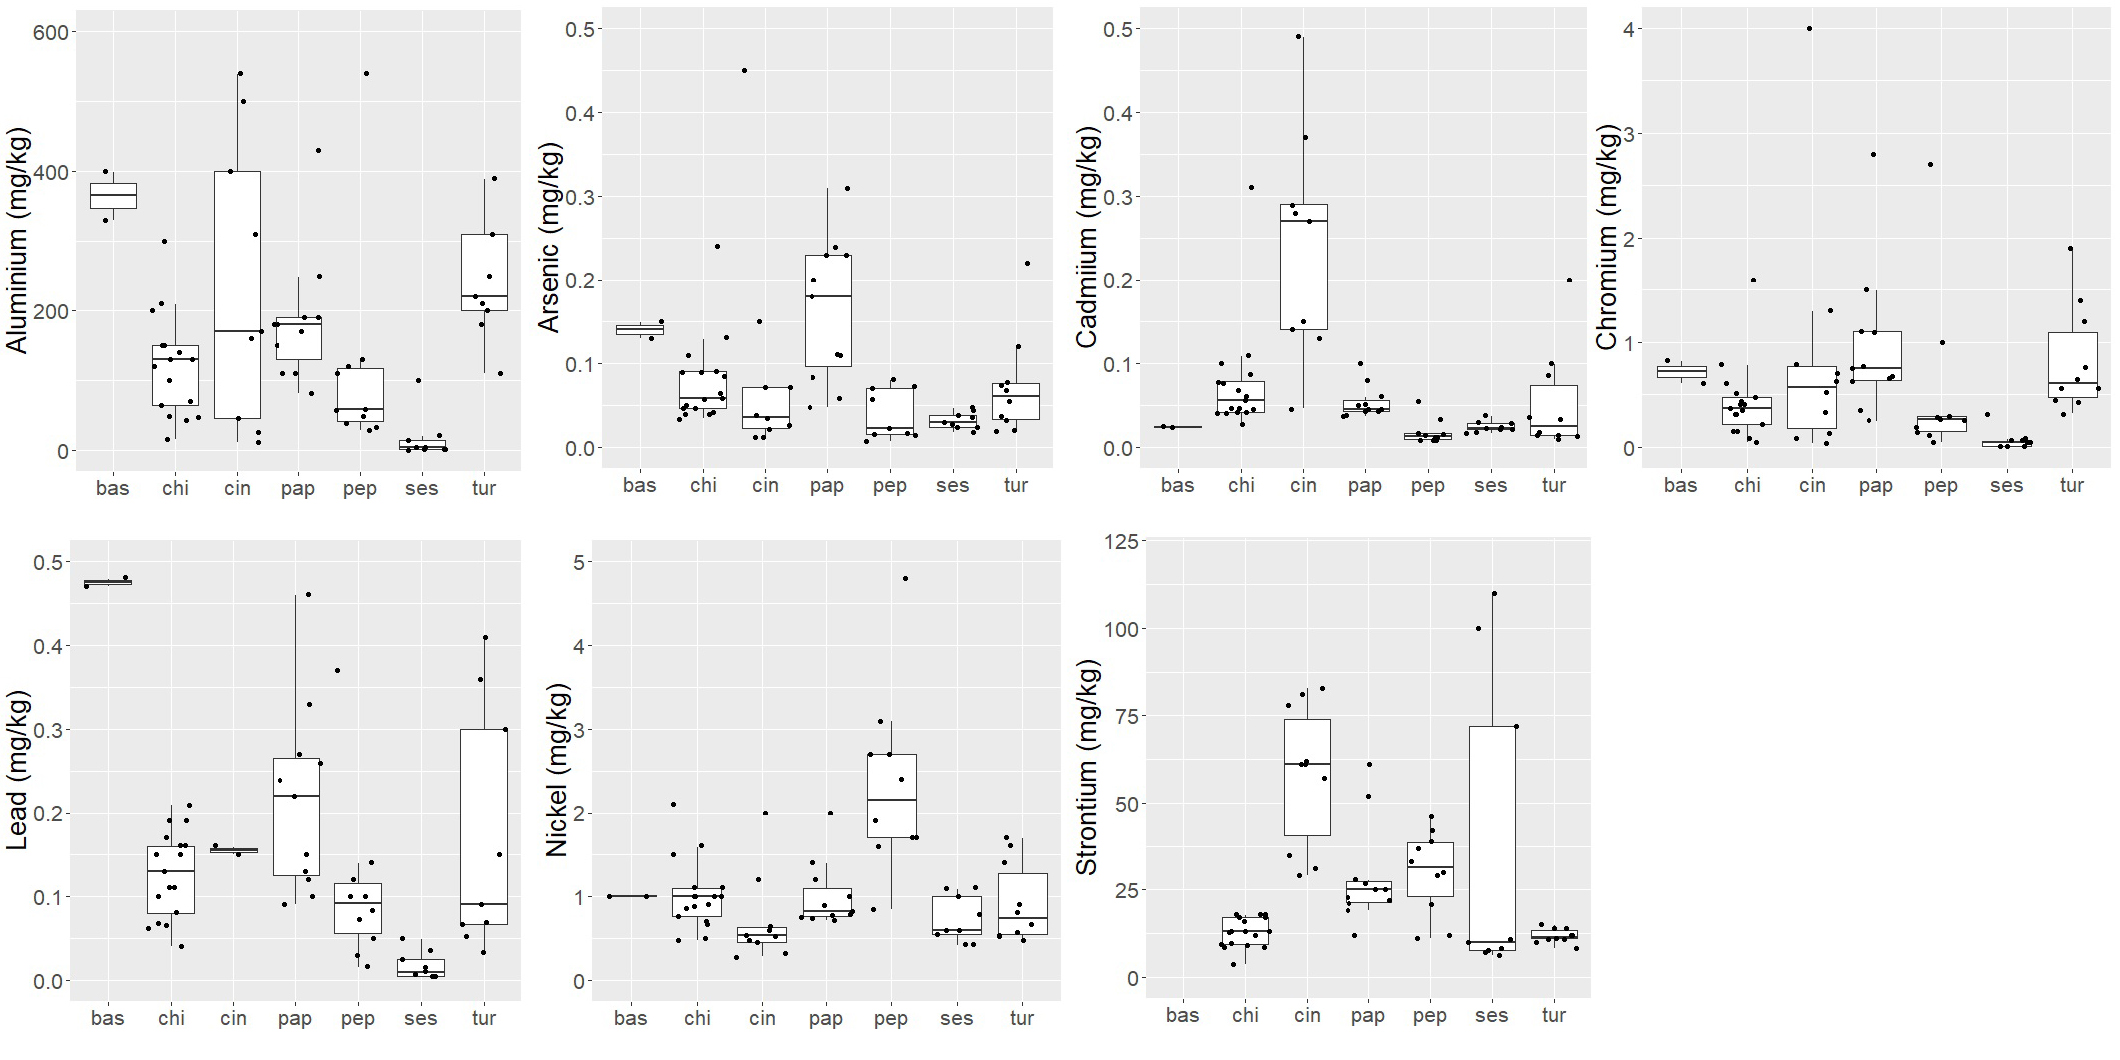
Figure 1. Boxplots of heavy metal distribution (arsenic, cadmium, lead, chromium, nickel, strontium, aluminium) in spices and herbs (bas = basil, chi = chilli, cin = cinnamon, pap = paprika, pep = black pepper, ses = sesame seeds, tur = turmeric). Outlier values for arsenic (pap), cadmium and lead (cin), and strontium (bas) are not shown in the graphs but are listed in Table 4.
Levels of heavy metals in spices and herbs
| Spices & herbs | Metal concentration (mg/kg), mean ± SD (range) | |||||||
| Al | As | Cd | Cr | Hg | Ni | Pb | Sr | |
| Basil (n = 2) | 365 (330-400) | 0.14 (0.13-0.15) | 0.024 (0.023-0.025) | 0.72 (0.61-0.83) | (0.007-0.012) | 1.0 (1.0-1.0) | 0.475 (0.47-0.48) | 275 (260-290) |
| Chilli (n = 14) | 97.0 ± 47.4 (16-150) | 0.076 ± 0.056 (0.034-0.24) | 0.080 ± 0.071 (0.027-0.31) | 0.381 ± 0.376 (0.05-1.6) | (< LOR-0.023) | 0.97 ± 0.43 (0.48-2.1) | 0.11 ± 0.046 (0.04-0.19) | 12.4 ± 4.38 (3.7-18) |
| Cinnamon (n = 10) | 308.1 ± 289.1 (11-920) | 0.09 ± 0.13 (0.012-0.45) | 0.59 ± 1.10 (0.046-3.7) | 0.85 ± 1.17 (0.04-4.0) | (< LOR-0.059) | 0.70 ± 0.52 (0.28-2.0) | 1.60 ± 2.07 (0.15-7.0) | 57.8 ± 20.2 (29-83) |
| Paprika (n = 11) | 185.6 ± 93.7 (81-430) | 0.16 ± 0.09 (0.047-0.31) | 0.054 ± 0.02 (0.037-0.1) | 0.96 ± 0.70 (0.25-2.8) | (< LOR-0.008) | 1.01 ± 0.40 (0.71-2.0) | 0.22 ± 0.11 (0.09-0.46) | 28.6 ± 14.6 (12.0-61) |
| Black pepper (n = 13) | 144.2 ± 144.7 (29-540) | 0.18 ± 0.46 (0.007-1.7) | 0.026 ± 0.02 (0.008-0.067) | 0.56 ± 0.70 (0.05-2.7) | (< LOR-0.017) | 2.08 ± 1.07 (0.85-4.8) | 0.13 ± 0.09 (0.016-0.37) | 26.5 ± 12.5 (11-46) |
| Sesame seeds (n = 9) | 16.6 ± 32.1 (0.1-100) | 0.032 ± 0.010 (0.018-0.047) | 0.025 ± 0.007 (0.017-0.038) | 0.071 ± 0.094 (0.01-0.31) | (< LOR) | 0.73 ±0.28 (0.42-1.1) | 0.018 ±0.016 (0.005-0.05) | 36.9 ±43.9 (6.2-110) |
| Turmeric (n = 10) | 310 ± 178 (110-630) | 0.07 ± 0.060 (0.019-0.22) | 0.05 ± 0.061 (0.01-0.20) | 0.82 ± 0.51 (0.32-1.9) | (< LOR-0.007) | 0.92 ± 0.47 (0.48-1.7) | 0.24 ± 0.27 (0.033-0.90) | 11.8 ± 2.02 (8.4-15) |
| Total (n = 69) | 178.8 ± 178.6 (0.1-920) | 0.11 ± 0.21 (0.007-1.7) | 0.13 ± 0.45 (0.008-3.7) | 0.61 ± 0.70 (0.01-4.0) | (< LOR-0.059) | 1.11 ± 0.76 (0.28-4.8) | 0.36 ± 0.92 (0.005-7.0) | 35.0 ± 48.2 (3.7-290) |
Cadium levels in this study were generally low, with the exception of one sample containing 3.7 mg/kg [Table 4]. High cadmium levels in cinnamon (2.43 ± 0.38 mg/kg) have previously been reported in Egypt[26]. Numerous studies on mercury in spices and herbs, including herbal medicines, have consistently shown levels below analytical detection limits[15,19]. In this study, mercury was detected at low levels in several samples, with approximately 75% of samples falling below the method’s reporting limit (0.005 mg/kg) [Table 4]. Mercury accumulation in plants typically occurs through soil uptake in contaminated or polluted environments[28,29]. Therefore, the low mercury levels observed here and in other studies may reflect cultivation in relatively unpolluted soils, resulting in minimal uptake by the plants. Lead concentrations in this study were also relatively low. However, higher levels of lead in cinnamon from India (2.5 mg/kg) and Vietnam (7.0 mg/kg) were found in this study [Supplementary Table 1] High levels of lead have also been reported from Pakistan (7.6-8.4 mg/kg) and Vietnam (2.26-2.92 mg/kg)[26,30]. Particularly concerning are reports of turmeric powders from Bangladeshi markets containing elevated lead levels (37.3 ± 7.5 mg/kg), far exceeding the allowable limit of 2.5 mg/kg set by the Bangladesh Standards and Testing Institution[17]. In Australia, the Food Standards Australia and New Zealand (FSANZ) has established a maximum permitted level of lead in fruits, vegetables, and spices, including herbs, at 0.1 mg/kg[31].
Aluminium, chromium, nickel and strontium
The high levels of aluminium detected in spice and herb samples are not unexpected, given that aluminium utensils and containers used in food processing and packaging can serve as sources of contamination[32,33]. In addition, some plants and vegetables readily accumulate aluminium, which is stored in plant tissues and subsequently consumed as food or dietary supplements[34,35]. In this study, high aluminium concentrations (300-400 mg/kg) were found in dried basil. Similarly, another study reported high aluminium levels (160 mg/kg) in basil from Australian markets[36]. Leaching and migration of metals from stainless steel equipment may also contribute to chromium and nickel contamination during food production, including spice processing[37-39]. In this study, chromium levels in spices and herbs were generally low, typically below 1.0 mg/kg. The highest chromium concentration (4.0 mg/kg) was detected in cinnamon from Vietnam, which also contained elevated levels of aluminium (920 mg/kg), nickel (2.0 mg/kg), and lead (7.0 mg/kg). High chromium levels (2.36 ± 0.029 mg/kg) in Vietnamese cinnamon have also been reported previously[19]. Nickel concentrations were generally low (around 1.0 mg/kg), though higher levels were observed in chilli (2.1 mg/kg) and black pepper (4.8 mg/kg). Other studies have similarly reported high nickel levels in chilli (4.75-5.25 mg/kg) from Pakistan and in basil (6.7 ± 0.1 mg/kg) from Turkey[26,40]. The present study also identified high strontium concentrations in basil (260-290 mg/kg), although limited information on strontium levels in basil is available. In other spices, strontium levels ranged widely (3.7-110 mg/kg) but were generally high. Notably, relatively elevated strontium concentrations were found in cinnamon from Sri Lanka (61-81 mg/kg) and Vietnam (31-57 mg/kg). High strontium levels in cinnamon have also been reported in Brazil (68.5 ± 25.0 mg/kg) and Vietnam (50.6 ± 0.127 mg/kg) [19,41].
Heavy metal levels in organic and non-organic (conventional) turmeric
The study has also shown wide variation in heavy metal content across both organic and conventional turmeric products [Table 5 and Figure 2]. High levels of aluminium were detected in both product types, ranging from 78 to 1,400 mg/kg.
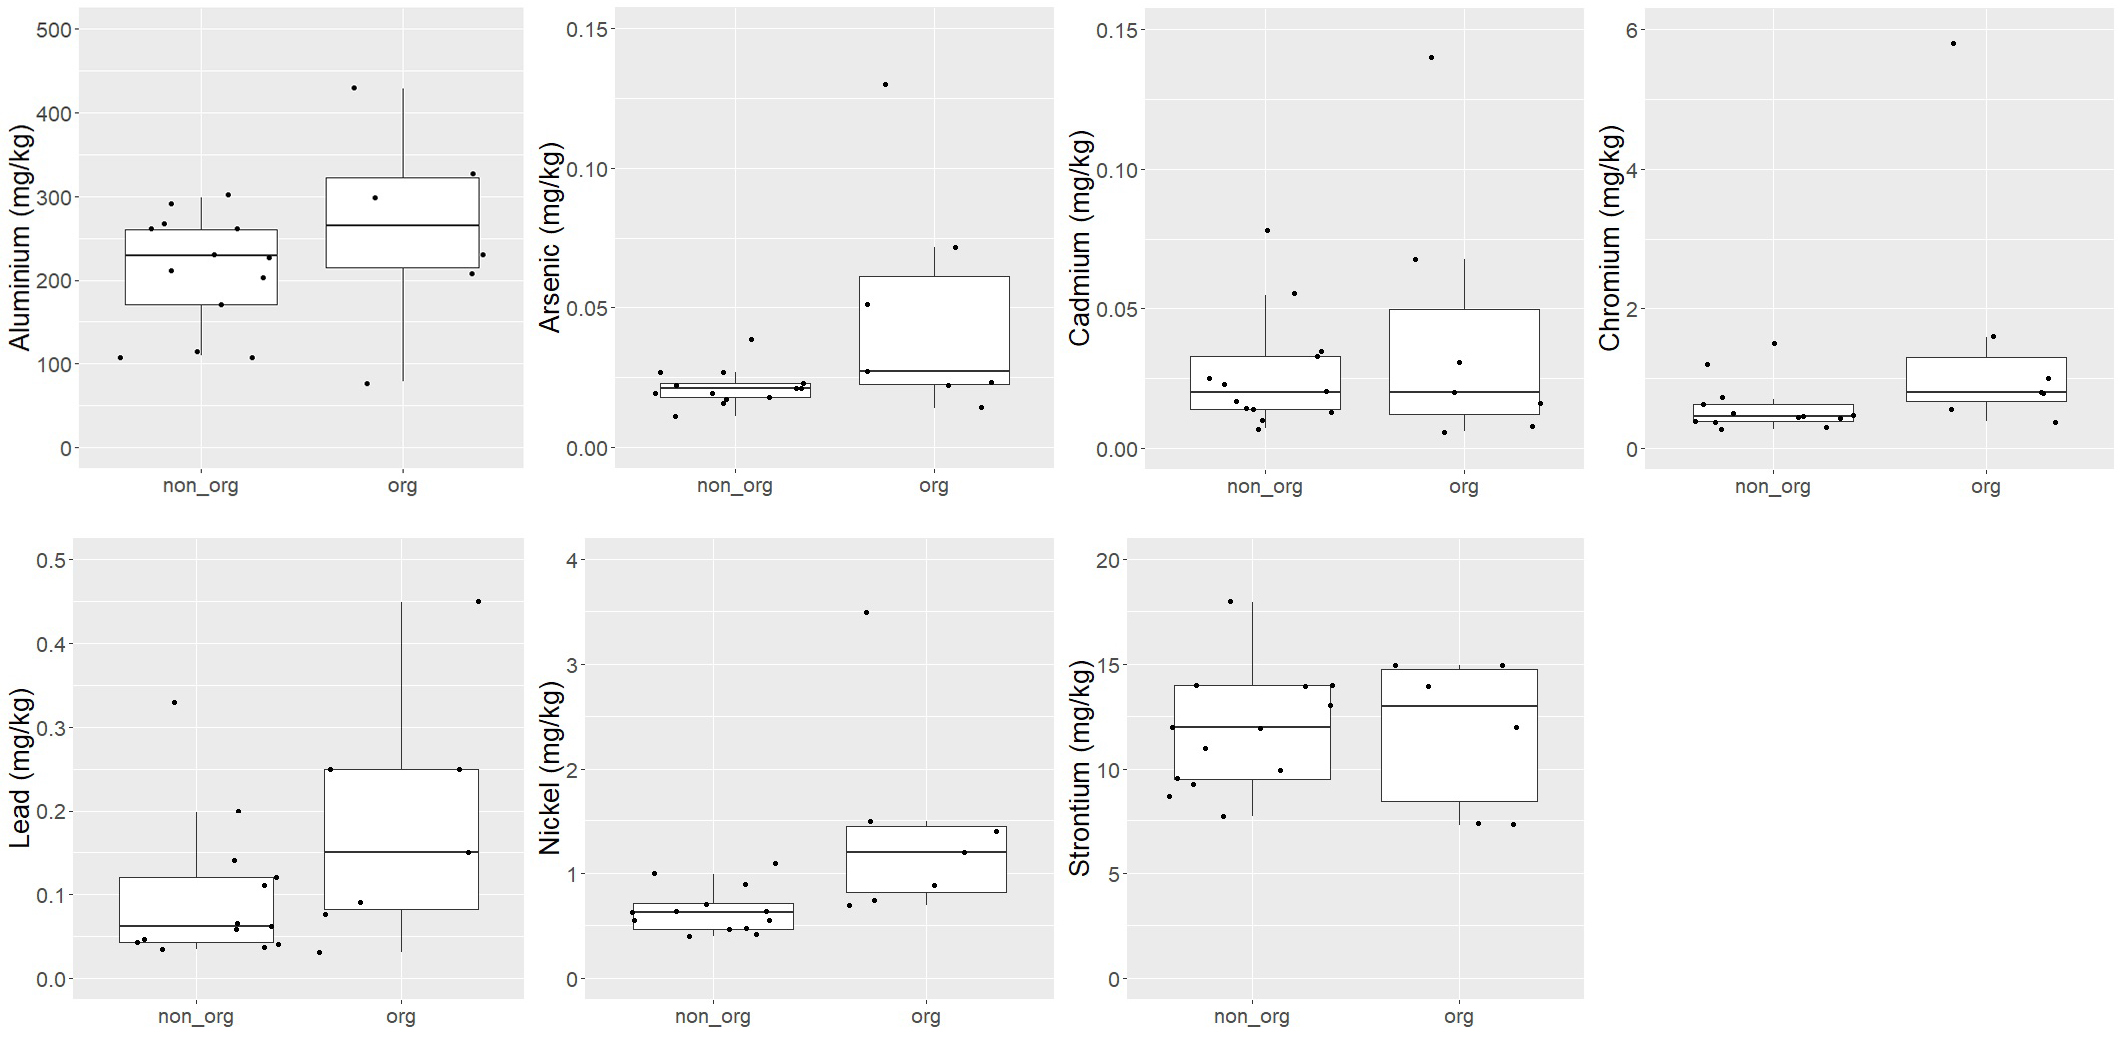
Figure 2. Boxplots showing the distribution of heavy metals (arsenic, cadmium, lead, chromium, nickel, strontium, aluminium) in non-organic (non-org) and organic (org) turmeric.
Heavy metal concentrations in non-organic (conventional) and organic turmeric spices
| Metals | Concentration (mg/kg), mean ± SD (range) | |||
| Non-organic turmeric (n = 13) | Organic turmeric (n = 7) | *P value | All turmeric products (n = 20) | |
| Aluminium | 211.5 ± 68.1 (110-300) | 425.4 ± 443.5 (78-1400) | 286.4 ± 275.7 (78-1,400) | |
| Arsenic | 0.022 ± 0.007 (0.011-0.039) | 0.048 ± 0.041 (0.014-0.13) | 0.031 ± 0.027 (0.011-0.13) | |
| Cadmium | 0.026 ± 0.020 (0.007-0.078) | 0.041 ± 0.048 (0.006-0.14) | 0.032 ± 0.032 (0.006-0.14) | |
| Chromium | 0.59 ± 0.36 (0.27-1.5) | 1.56 ± 1.91 (0.38-5.8) | P < 0.05 | 0.93 ± 1.21 (0.27-5.8) |
| Mercury | < LOR | < LOR | < LOR | |
| Nickel | 0.65 ± 0.22 (0.40-1.1) | 1.42 ± 0.97 (0.69-3.5) | P < 0.01 | 0.92 ± 0.68 (0.4-3.5) |
| Lead | 0.10 ± 0.085 (0.034-0.33) | 0.19 ± 0.14 (0.031-0.45) | 0.13 ± 0.11 (0.031-0.45) | |
| Strontium | 11.8 ± 2.83 (7.7-18) | 13.1 ± 4.81 (7.3-21) | 12.2 ± 3.58 (7.3-21) | |
There is limited information on heavy metal levels in organic spices, including turmeric. However, high aluminium levels have previously been reported in conventional spices such as chilli (795 ± 342 mg/kg) and black pepper (1,770 ± 17 mg/kg) from Bangladesh[42]. In the present study, arsenic, cadmium, and lead concentrations in turmeric were generally low, mostly below 0.5 mg/kg, consistent with earlier reports[15,43]. Strontium levels were relatively higher than chromium and nickel, although little prior data exist on strontium in turmeric. Chromium and nickel levels observed here are comparable with those of other studies[44]. Overall, organic turmeric contained higher heavy metal concentrations than conventional turmeric [Figure 2]. However, no significant differences were found for aluminium, arsenic, lead, or strontium [Table 5]. Significant differences were observed for chromium (P < 0.05) and nickel (P < 0.01), with higher levels in organic products. Organic foods, including spices, are widely perceived as healthier and of superior quality, leading to increasing consumer demand. Nonetheless, based on heavy metal content, our findings suggest that organic turmeric is not superior to conventional turmeric. It should be noted that the sample size in this study was small, and larger studies are needed to confirm these findings. Finally, mercury concentrations in all turmeric products were consistently below the method reporting limit (0.005 mg/kg), consistent with previous studies showing mercury levels in turmeric typically fall below detection limits[15].
Estimation of heavy metal exposure from dietary spice intake
Spices are widely used not only as key ingredients in food but also in pharmaceuticals and dietary supplements, such as turmeric, which is valued for its health benefits[45,46]. Due to cultural differences, daily spice consumption varies widely across countries and ethnic groups. Spice blends are commonly used in cooking; in India, adult daily intake has been estimated at 8-10 g, while in Bangladesh it ranges from 3.5-10 g/day[42,47]. In contrast, spice consumption in Western countries is generally lower, averaging 0.5-2.7 g/day in Europe, 1.0 g/day in New Zealand, and 4 g/day in the United States[48,49]. Data on spice and herb consumption in Australia are limited. A recent study indicated that Australian adults frequently consume spices and herbs, with approximately two-thirds reporting daily intake of 1-2 times over the past year[50]. However, this study did not quantify the actual amounts consumed. Another Australian survey, part of a market basket study in Western Australia, reported an average daily intake of 1.9 g of spices and herbs[36].
In the present study, exposure to heavy metals from spice and herb consumption was assessed using health-based guidance values (HBGVs) established by the European Food Safety Authority (EFSA)[51]. The average concentrations of each heavy metal across all spices and herbs were used to estimate exposure from daily consumption. The estimated tolerable weekly intake (TWI), tolerable daily intake (TDI), and benchmark dose lower confidence limit (BMDL) were calculated as follows:
For this estimation, a daily spice intake of 1.9 g and an adult body weight of 70 kg were assumed (metal concentration expressed in mg/kg unit is equivalent to μg/g unit).
The percentage of metal intake relative to HBGV was calculated as:
Table 6 summarizes the estimated heavy metal intake from spices and herbs and their contributions, expressed as percentages of the relevant HBGVs.
Estimated heavy metal exposure from dietary intake of spices and herbs
| Element | Mean concentration (µg/g) | Daily intake (µg/day)# | Exposure (µg/kg bw/day or week) | HBGV type | Value | Reference | Percentage (%) of TWI/BMDL/TDI |
| Al | 179 | 340 | 34* | TWI | 1,000 µg/kg bw/week | EFSA[52] 2008 | 3.4 |
| As** | 0.11 | 0.21 | 0.003 | BMDL01 iAs | 0.3-8 µg/kg bw/day | EFSA[27] 2014 | 0.038-1.0 |
| Cd | 0.13 | 0.25 | 0.025* | TWI | 2.5 µg/kg bw/week | EFSA[23] 2009 | 1.0 |
| Cr## | 0.61 | 1.15 | 0.016 | BMDL10 Cr (VI) | 1,000 µg/kg bw/day | EFSA[53] 2014 | 0.002 |
| Ni | 1.11 | 2.1 | 0.03 | TDI | 13 µg/kg bw/day | EFSA[54] 2020 | 0.23 |
| Pb | 0.36 | 0.68 | 0.0097 | BMDL01 | 1.5 µg/kg bw/day | EFSA[22] 2010 | 0.65 |
| Sr | 35 | 66.5 | 0.95 | TDI | 130 µg/kg bw/day | WHO[55] 2010 | 0.73 |
Based on the average Al content of 179 mg/kg across all spices in this study, it is estimated that the contribution of spices and herbs to Al intake is approximately 3.4% of the TWI established by EFSA[52], which is considered low [Table 6]. EFSA has provided a BMDL value only for inorganic As, not for total arsenic[27]. Accordingly, this study used the inorganic As BMDL value to estimate dietary arsenic exposure from the consumption of spices and herbs. Inorganic As (III) and As (V) are known to accumulate in plant tissues due to the uptake of soluble inorganic arsenic species from the soil by plant roots[56,57]. The contribution of spices and herbs to arsenic intake was estimated to be low, ranging from approximately 0.038% to 1.0 % of the BMDL [Table 6]. Similarly, for chromium, EFSA[53] has provided TDI values only for inorganic Cr species, Cr (III) and Cr (VI), which are the common forms present in food. Cr (III) is considered an essential element due to its possible role in insulin regulation and glucose tolerance factor; however, its physiological mechanisms are not fully understood and remain equivocal[58,59]. In contrast, Cr (VI) is toxic, and chronic exposure may lead to adverse health effects, including cancer[60]. Total Cr levels in food are generally low (< 0.02 mg/kg), and the levels of Cr (III) or Cr (VI) are expected to be similarly low[61,62]. In this study, Cr exposure from spices and herbs was assessed against the BMDL value for Cr (VI) due to its toxicity. The contribution of spices and herbs to Cr dietary exposure was low (0.002 % of the BMDL, Table 6). Previous reports have identified high lead and chromium levels in turmeric products, raising concerns that some products may be adulterated with lead chromate to enhance color and appearance[63]. This study also found that the estimated contributions of spices and herbs to the intake of Ni, Pb, Cd, and Sr were generally low [Table 6]. While exposure to Pb and Cd is a health concern due to their high toxicity, Ni and Sr are less toxic and thus pose a lower risk. Notably, turmeric (Curcuma) from Sri Lanka has been reported to contribute significantly to Pb intake (approximately 263% of MBDL01), and about 33% for turmeric from India[30]. Cinnamon from Vietnam has been reported to contribute to high Cd intake (about 151% of TWI), and cinnamon from Indonesia contributes about 94% of TWI. Although strontium is considered non-toxic, its biological role in humans remains unknown. At high exposure levels, strontium can incorporate into bone and replace calcium, potentially causing bone demineralization and deformities[64,65]. In this study, the estimated contribution of spices and herbs to daily strontium exposure was low, at approximately 0.73% of the TDI set by the World Health Organization[55] [Table 6].
CONCLUSIONS
This study revealed a wide variation in heavy metal content among dried culinary spices and herbs, providing data on heavy metal levels in spices and herbs not previously reported in Australia. The estimated contributions of spices and herbs to heavy metal exposure from daily intake were generally low, indicating no significant public health risks. A wide variation in heavy metal content was also observed between organic and conventional (non-organic) turmeric products, with organic turmeric showing significantly higher levels of Cr and Ni compared to conventional products. A limitation of this study is the small sample size, with spices and herbs collected only from Queensland markets, which may not represent those available across Australia. Future studies should include a larger sample size across all Australian states and conduct detailed assessments of spice consumption to better evaluate health risks. Additionally, regular monitoring of heavy metals in imported spices and herbal products is recommended to detect potential contaminants or adulteration and safeguard consumer health and confidence.
DECLARATIONS
Acknowledgments
Part of the preliminary findings in the manuscript were presented as a poster during the conference at the 49th IUPAC World Chemistry Congress, 20-25 August 2023, The Hague, Netherlands. The complete findings of the manuscript were presented as an oral presentation at the International Workshop on Advancing Food Analysis, Safety and Testing Standards for Global Comparability, 15-17 August 2024, Putrajaya, Malaysia. All authors have read and approved the final manuscript for publication.
Authors’ contributions
Design and methodology of the study: Porter, J.; Mitchell, S.; Tinggi, U.; Jurd, S.
Sample preparation and analysis: Farrell, M.
Data analysis and interpretation: Tinggi, U.
Availability of data and materials
The data of the findings in this study are available from the corresponding author upon reasonable request.
Financial support and sponsorship
None.
Conflicts of interest
Ujang Tinggi and Madeleine Farrell's institution includes Public Health and Scientific Services. Jayde Porter, Sarah Mitchell, and Sharon Jurd's institution includes Public Health Unit. They declared that there are no conflicts of interest.
Ethical approval and consent to participate
Not applicable.
Consent for publication
Not applicable.
Copyright
© The Author(s) 2025.
Supplementary Materials
REFERENCES
1. Nguyen, L.; Duong, L. T.; Mentreddy, R. S. The U.S. import demand for spices and herbs by differentiated sources. Journal. of. Applied. Research. on. Medicinal. and. Aromatic. Plants. 2019, 12, 13-20.
2. Galvin-king, P.; Haughey, S. A.; Elliott, C. T. Herb and spice fraud; the drivers, challenges and detection. Food. Control. 2018, 88, 85-97.
3. Kaefer, C. M.; Milner, J. A. The role of herbs and spices in cancer prevention. J. Nutr. Biochem. 2008, 19, 347-61.
4. Opara, E. I. Culinary herbs and spices: what can human studies tell us about their role in the prevention of chronic non-communicable diseases? J. Sci. Food. Agric. 2019, 99, 4511-7.
5. Opara, E. I.; Chohan, M. Culinary herbs and spices: their bioactive properties, the contribution of polyphenols and the challenges in deducing their true health benefits. Int. J. Mol. Sci. 2014, 15, 19183-202.
6. Embuscado, M. E. Spices and herbs: Natural sources of antioxidants - a mini review. J. Funct. Foods. 2015, 18, 811-9.
8. Kowalska, G. The Safety Assessment of toxic metals in commonly used herbs, spices, tea, and coffee in Poland. Int. J. Environ. Res. Public. Health. 2021, 18, 5779.
9. Akhtar, S.; Riaz, M.; Naeem, I.; et al. Risk assessment of aflatoxins and selected heavy metals through intake of branded and non-branded spices collected from the markets of Multan city of Pakistan. Food. Control. 2020, 112, 107132.
10. Reinholds, I.; Pugajeva, I.; Bavrins, K.; Kuckovska, G.; Bartkevics, V. Mycotoxins, pesticides and toxic metals in commercial spices and herbs. Food. Addit. Contam. Part. B. Surveill. 2017, 10, 5-14.
11. Shim, J.; Cho, Y.; Lee, K.; An, H.; Lee, C. Multivariate analysis of metals contents in spices commonly consumed in republic of Korea. Food. Addit. Contam. Part. B. Surveill. 2021, 14, 184-92.
12. Kim, S. U.; Kim, T. R.; Lee, E. S.; et al. Formaldehyde and heavy metal migration from rubber and metallic packaging/utensils in Korea. Food. Addit. Contam. Part. B. Surveill. 2015, 8, 7-11.
13. Kiyataka, P. H.; Dantas, S. T.; Pallone, J. A. Method for assessing lead, cadmium, mercury and arsenic in high-density polyethylene packaging and study of the migration into yoghurt and simulant. Food. Addit. Contam. Part. A. Chem. Anal. Control. Expo. Risk. Assess. 2014, 31, 156-63.
14. Alawadhi, N.; Abass, K.; Khaled, R.; Osaili, T. M.; Semerjian, L. Heavy metals in spices and herbs from worldwide markets: a systematic review and health risk assessment. Environ. Pollut. 2024, 362, 124999.
15. Shim, J.; Cho, T.; Leem, D.; Cho, Y.; Lee, C. Heavy metals in spices commonly consumed in Republic of Korea. Food. Addit. Contam. Part. B. Surveill. 2019, 12, 52-8.
16. Wong, C.; Roberts, S. M.; Saab, I. N. Review of regulatory reference values and background levels for heavy metals in the human diet. Regul. Toxicol. Pharmacol. 2022, 130, 105122.
17. Alam, M. N. E.; Hosen, M. M.; Ullah, A. K. M. A.; et al. Lead Exposure of four biologically important common branded and non-branded spices: relative analysis and health implication. Biol. Trace. Elem. Res. 2023, 201, 4972-84.
18. Cowell, W.; Ireland, T.; Vorhees, D.; Heiger-Bernays, W. Ground turmeric as a source of lead exposure in the United States. Public. Health. Rep. 2017, 132, 289-93.
19. Cicero, N.; Gervasi, T.; Durazzo, A.; et al. Mineral and microbiological analysis of spices and aromatic herbs. Foods 2022, 11, 548.
20. Das, A.; Das, A. Heavy metals in common food items in Kolkata, India. Euro-Mediterr. J. Environ. Integr. 2018, 3, 39.
21. Nordin, N.; Selamat, J. Heavy metals in spices and herbs from wholesale markets in Malaysia. Food. Addit. Contam. Part. B. Surveill. 2013, 6, 36-41.
22. Food Safety Authority (EFSA). Panel on contaminants in the food chain (CONTAM). Scientific opinion on lead in food. EFSA. J. 2010, 8, 1570.
23. Food Safety Authority (EFSA). Cadmium in food. Scientific opinion of the panel on contaminants in the food chain. EFSA. J. 2009, 980, 1-139.
24. Hungerford, N. L.; Tinggi, U.; Tan, B. L. L.; Farrell, M.; Fletcher, M. T. Mineral and trace element analysis of Australian/Queensland Apis mellifera honey. Int. J. Environ. Res. Public. Health. 2020, 17, 6304.
25. National Measurement Institute (NMI). Proficiency test final report AQA 21-12 metals in food. NMI 2022. https://www.industry.gov.au/sites/default/files/2022-10/AQA-21-12-Final-Report.pdf (accessed on 2025-08-18).
26. Baig, J. A.; Bhatti, S.; Kazi, T. G.; Afridi, H. I. Evaluation of arsenic, cadmium, nickel and lead in common spices in Pakistan. Biol. Trace. Elem. Res. 2019, 187, 586-95.
27. Food Safety Authority (EFSA). Dietary exposure to inorganic arsenic in the European population. EFSA. J. 2014, 12, 3597.
28. Ghasemidehkordi, B.; Malekirad, A. A.; Nazem, H.; et al. Concentration of lead and mercury in collected vegetables and herbs from Markazi province, Iran: a non-carcinogenic risk assessment. Food. Chem. Toxicol. 2018, 113, 204-10.
29. Pelcová, P.; Ridošková, A.; Hrachovinová, J.; Grmela, J. Evaluation of mercury bioavailability to vegetables in the vicinity of cinnabar mine. Environ. Pollut. 2021, 283, 117092.
30. Bua, D. G.; Annuario, G.; Albergamo, A.; Cicero, N.; Dugo, G. Heavy metals in aromatic spices by inductively coupled plasma-mass spectrometry. Food. Addit. Contam. Part. B. Surveill. 2016, 9, 210-6.
31. Food Standards Australia New Zealand (FSANZ). Contaminants and natural toxicants. 2024. https://www.foodstandards.gov.au/food-standards-code/legislation (accessed on 2025-08-18).
32. Dordevic, D.; Buchtova, H.; Jancikova, S.; et al. Aluminum contamination of food during culinary preparation: case study with aluminum foil and consumers’ preferences. Food. Sci. Nutr. 2019, 7, 3349-60.
33. Stahl, T.; Falk, S.; Taschan, H.; Boschek, B.; Brunn, H. Evaluation of human exposure to aluminum from food and food contact materials. Eur. Food. Res. Technol. 2018, 244, 2077-84.
34. Ba V, Thien BN, Phuong HT, Thi Hong Loan T, Anh TT. Bioconcentration and translocation of elements from soil to vegetables and associated health risk. J. Food. Compos. Anal. 2024, 132, 106296.
35. Ofoe, R.; Thomas, R. H.; Asiedu, S. K.; Wang-Pruski, G.; Fofana, B.; Abbey, L. Aluminum in plant: Benefits, toxicity and tolerance mechanisms. Front. Plant. Sci. 2022, 13, 1085998.
36. Callan, A.; Hinwood, A.; Devine, A. Metals in commonly eaten groceries in Western Australia: a market basket survey and dietary assessment. Food. Addit. Contam. Part. A. Chem. Anal. Control. Expo. Risk. Assess. 2014, 31, 1968-81.
37. Herting, G.; Wallinder, I. O.; Leygraf, C. Corrosion-induced release of chromium and iron from ferritic stainless steel grade AISI 430 in simulated food contact. J. Food. Eng. 2008, 87, 291-300.
38. Kamerud, K. L.; Hobbie, K. A.; Anderson, K. A. Stainless steel leaches nickel and chromium into foods during cooking. J. Agric. Food. Chem. 2013, 61, 9495-501.
39. Koo, Y. J.; Pack, E. C.; Lee, Y. J.; et al. Determination of toxic metal release from metallic kitchen utensils and their health risks. Food. Chem. Toxicol. 2020, 145, 111651.
40. Divrikli, U.; Horzum, N.; Soylak, M.; Elci, L. Trace heavy metal contents of some spices and herbal plants from western Anatolia, Turkey. Int. J. of. Food. Sci. Tech. 2006, 41, 712-6.
41. Caldeirão, L.; Sousa, J.; Nunes, L. C. G.; Godoy, H. T.; Fernandes, J. O.; Cunha, S. C. Herbs and herbal infusions: Determination of natural contaminants (mycotoxins and trace elements) and evaluation of their exposure. Food. Res. Int. 2021, 144, 110322.
42. Rahman, M.; Islam, M. A.; Khan, R. A. Characterization of chemical elements in common spices of Bangladesh for dietary intake and possible health risk assessment by INAA and AAS techniques. J. Radioanal. Nucl. Chem. 2018, 318, 1347-57.
43. Potortì, A. G.; Bua, G. D.; Lo, Turco. V.; et al. Major, minor and trace element concentrations in spices and aromatic herbs from Sicily (Italy) and Mahdia (Tunisia) by ICP-MS and multivariate analysis. Food. Chem. 2020, 313, 126094.
44. Khan, N.; Choi, J. Y.; Nho, E. Y.; et al. Determination of minor and trace elements in aromatic spices by micro-wave assisted digestion and inductively coupled plasma-mass spectrometry. Food. Chem. 2014, 158, 200-6.
45. Hay, E.; Lucariello, A.; Contieri, M.; et al. Therapeutic effects of turmeric in several diseases: an overview. Chem. Biol. Interact. 2019, 310, 108729.
46. Liu, S.; Liu, J.; He, L.; et al. A comprehensive review on the benefits and problems of curcumin with respect to human health. Molecules 2022, 27, 4400.
47. Bhathal, S. K.; Kaur, H.; Bains, K.; Mahal, A. K. Assessing intake and consumption level of spices among urban and rural households of Ludhiana district of Punjab, India. Nutr. J. 2020, 19, 121.
48. Carlsen, M. H.; Blomhoff, R.; Andersen, L. F. Intakes of culinary herbs and spices from a food frequency questionnaire evaluated against 28-days estimated records. Nutr. J. 2011, 10, 50.
49. Lampe, J. W. Spicing up a vegetarian diet: chemopreventive effects of phytochemicals. Am. J. Clin. Nutr. 2003, 78, 579S-83S.
50. Wilson, N. A.; Mantzioris, E.; Villani, A. Use of herbs and spices in cooking and food preparation in Australia. Proceed. Nutr. Society. 2024, 83, E97.
51. Suomi, J.; Valsta, L.; Tuominen, P. Dietary Heavy Metal Exposure among Finnish Adults in 2007 and in 2012. Int. J. Environ. Res. Public. Health. 2021, 18, 10581.
52. Food Safety Authority (EFSA). Safety of aluminium from dietary intake - Scientific opinion of the panel on food additives, flavourings, processing aids and food contact materials (AFC). EFSA. J. 2008, 6, 754.
53. Food Safety Authority (EFSA). CONTAM Panel (EFSA Panel on Contaminants in the Food Chain). Scientific opinion on the risks to public health related to the presence of chromium in food and drinking water. EFSA. J. 2014, 12, 3595.
54. Schrenk, D.; Bignami, M.; Bodin, L.; et al.; EFSA panel on contaminants in the food chain (CONTAM). Update of the risk assessment of nickel in food and drinking water. EFSA. J. 2020, 18, e06268.
55. World Health Organization (WHO). Concise international chemical assessment document 77- Strontium and strontium compounds. WHO 2010. https://iris.who.int/bitstream/handle/10665/44280/9789241530774_eng.pdf (accessed on 2025-08-18).
56. Allevato, E.; Stazi, S. R.; Marabottini, R.; D’Annibale, A. Mechanisms of arsenic assimilation by plants and countermeasures to attenuate its accumulation in crops other than rice. Ecotoxicol. Environ. Saf. 2019, 185, 109701.
57. Bergqvist, C.; Herbert, R.; Persson, I.; Greger, M. Plants influence on arsenic availability and speciation in the rhizosphere, roots and shoots of three different vegetables. Environ. Pollut. 2014, 184, 540-6.
58. Pavesi, T.; Moreira, J. C. Mechanisms and individuality in chromium toxicity in humans. J. Appl. Toxicol. 2020, 40, 1183-97.
59. Vincent, J. B. New evidence against chromium as an essential trace element. J. Nutr. 2017, 147, 2212-9.
60. Alvarez, C. C.; Bravo, Gómez. M. E.; Hernández, Zavala. A. Hexavalent chromium: Regulation and health effects. J. Trace. Elem. Med. Biol. 2021, 65, 126729.
61. Chung, S. W. C. Update on chromium speciation analysis in foods: a review of advances in analytical methods and dietary exposure assessment. Food. Addit. Contam. Part. A. Chem. Anal. Control. Expo. Risk. Assess. 2024, 41, 782-9.
62. Hernandez, F.; Bemrah, N.; Séby, F.; Noël, L.; Guérin, T. Cr(VI) and Cr(III) in milk, dairy and cereal products and dietary exposure assessment. Food. Addit. Contam. Part. B. Surveill. 2019, 12, 209-15.
63. Forsyth, J. E.; Nurunnahar, S.; Islam, S. S.; et al. Turmeric means “yellow” in Bengali: Lead chromate pigments added to turmeric threaten public health across Bangladesh. Environ. Res. 2019, 179, 108722.
64. Marx, D.; Rahimnejad, Yazdi. A.; Papini, M.; Towler, M. A review of the latest insights into the mechanism of action of strontium in bone. Bone. Rep. 2020, 12, 100273.
Cite This Article
How to Cite
Download Citation
Export Citation File:
Type of Import
Tips on Downloading Citation
Citation Manager File Format
Type of Import
Direct Import: When the Direct Import option is selected (the default state), a dialogue box will give you the option to Save or Open the downloaded citation data. Choosing Open will either launch your citation manager or give you a choice of applications with which to use the metadata. The Save option saves the file locally for later use.
Indirect Import: When the Indirect Import option is selected, the metadata is displayed and may be copied and pasted as needed.
About This Article
Special Issue
Copyright

Data & Comments
Data
0


Comments
Comments must be written in English. Spam, offensive content, impersonation, and private information will not be permitted. If any comment is reported and identified as inappropriate content by OAE staff, the comment will be removed without notice. If you have any queries or need any help, please contact us at [email protected].