

fig1
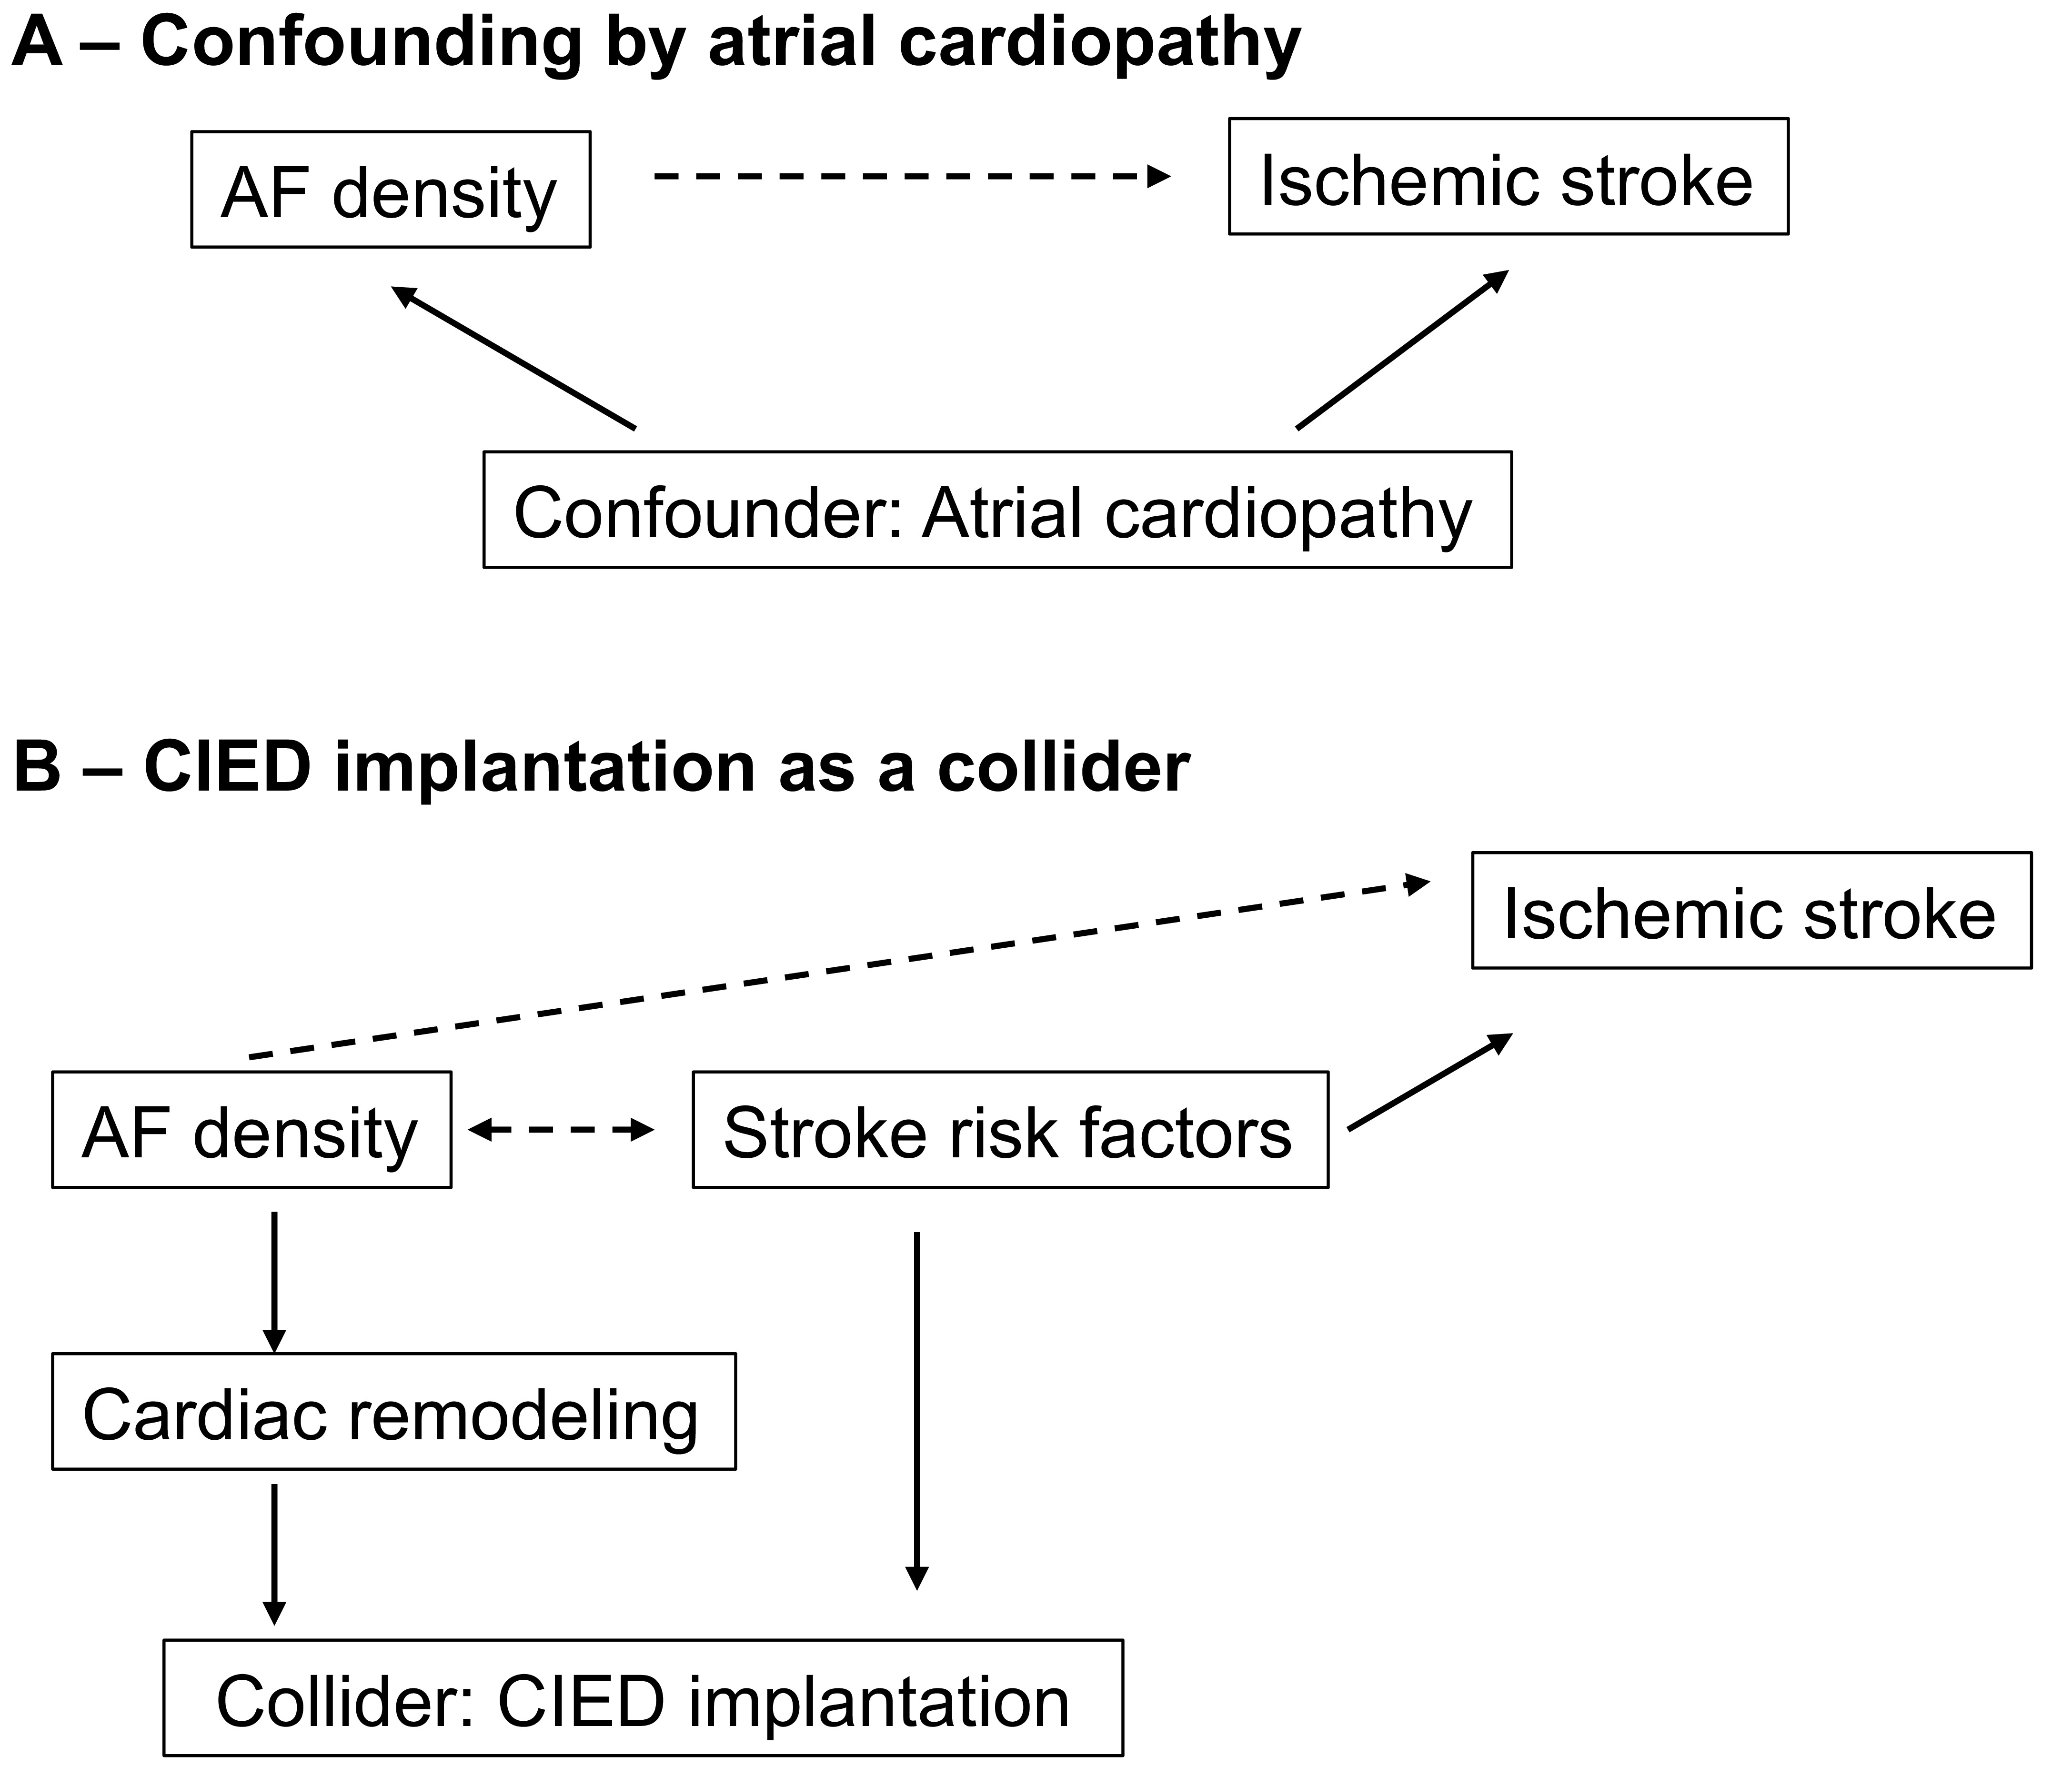
Figure 1. Directed acyclic graphs illustrating potential sources of bias in the association between AF density and ischemic stroke. The depicted biases include (A) confounding and (B) collider bias. Solid arrows represent causal relationships, while dashed arrows represent non-causal correlations induced by the respective biases. AF: Atrial fibrillation. CIED: cardiac implantable electronic devices.




