

fig9
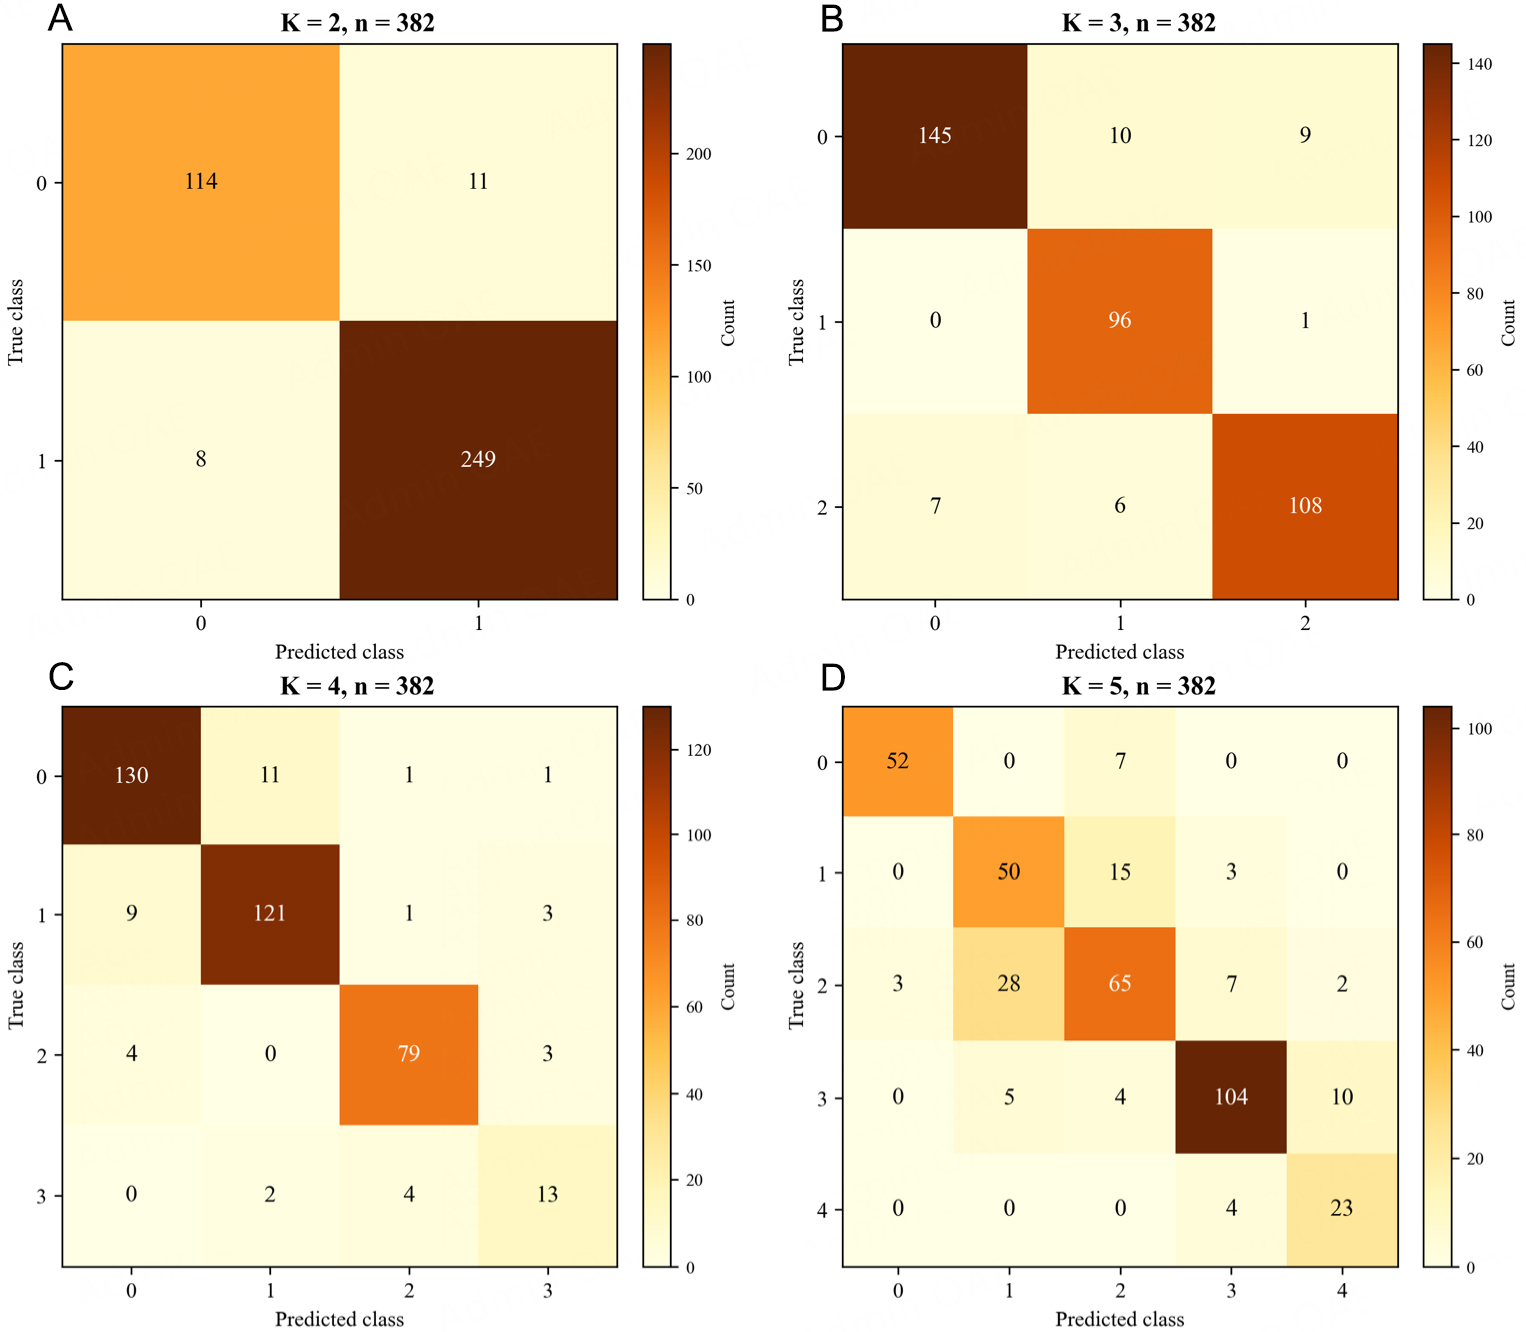
Figure 9. Confusion matrices of ICG morphology classification results under different clustering schemes in the HeartCycle dataset. All confusion matrices are generated from the test set with n = 382 beat segments, and the values in each cell represent the number of samples assigned to the corresponding category. (A) Binary classification. (B) Three-class classification. (C) Four-class classification. (D) Five-class classification.




