

fig8
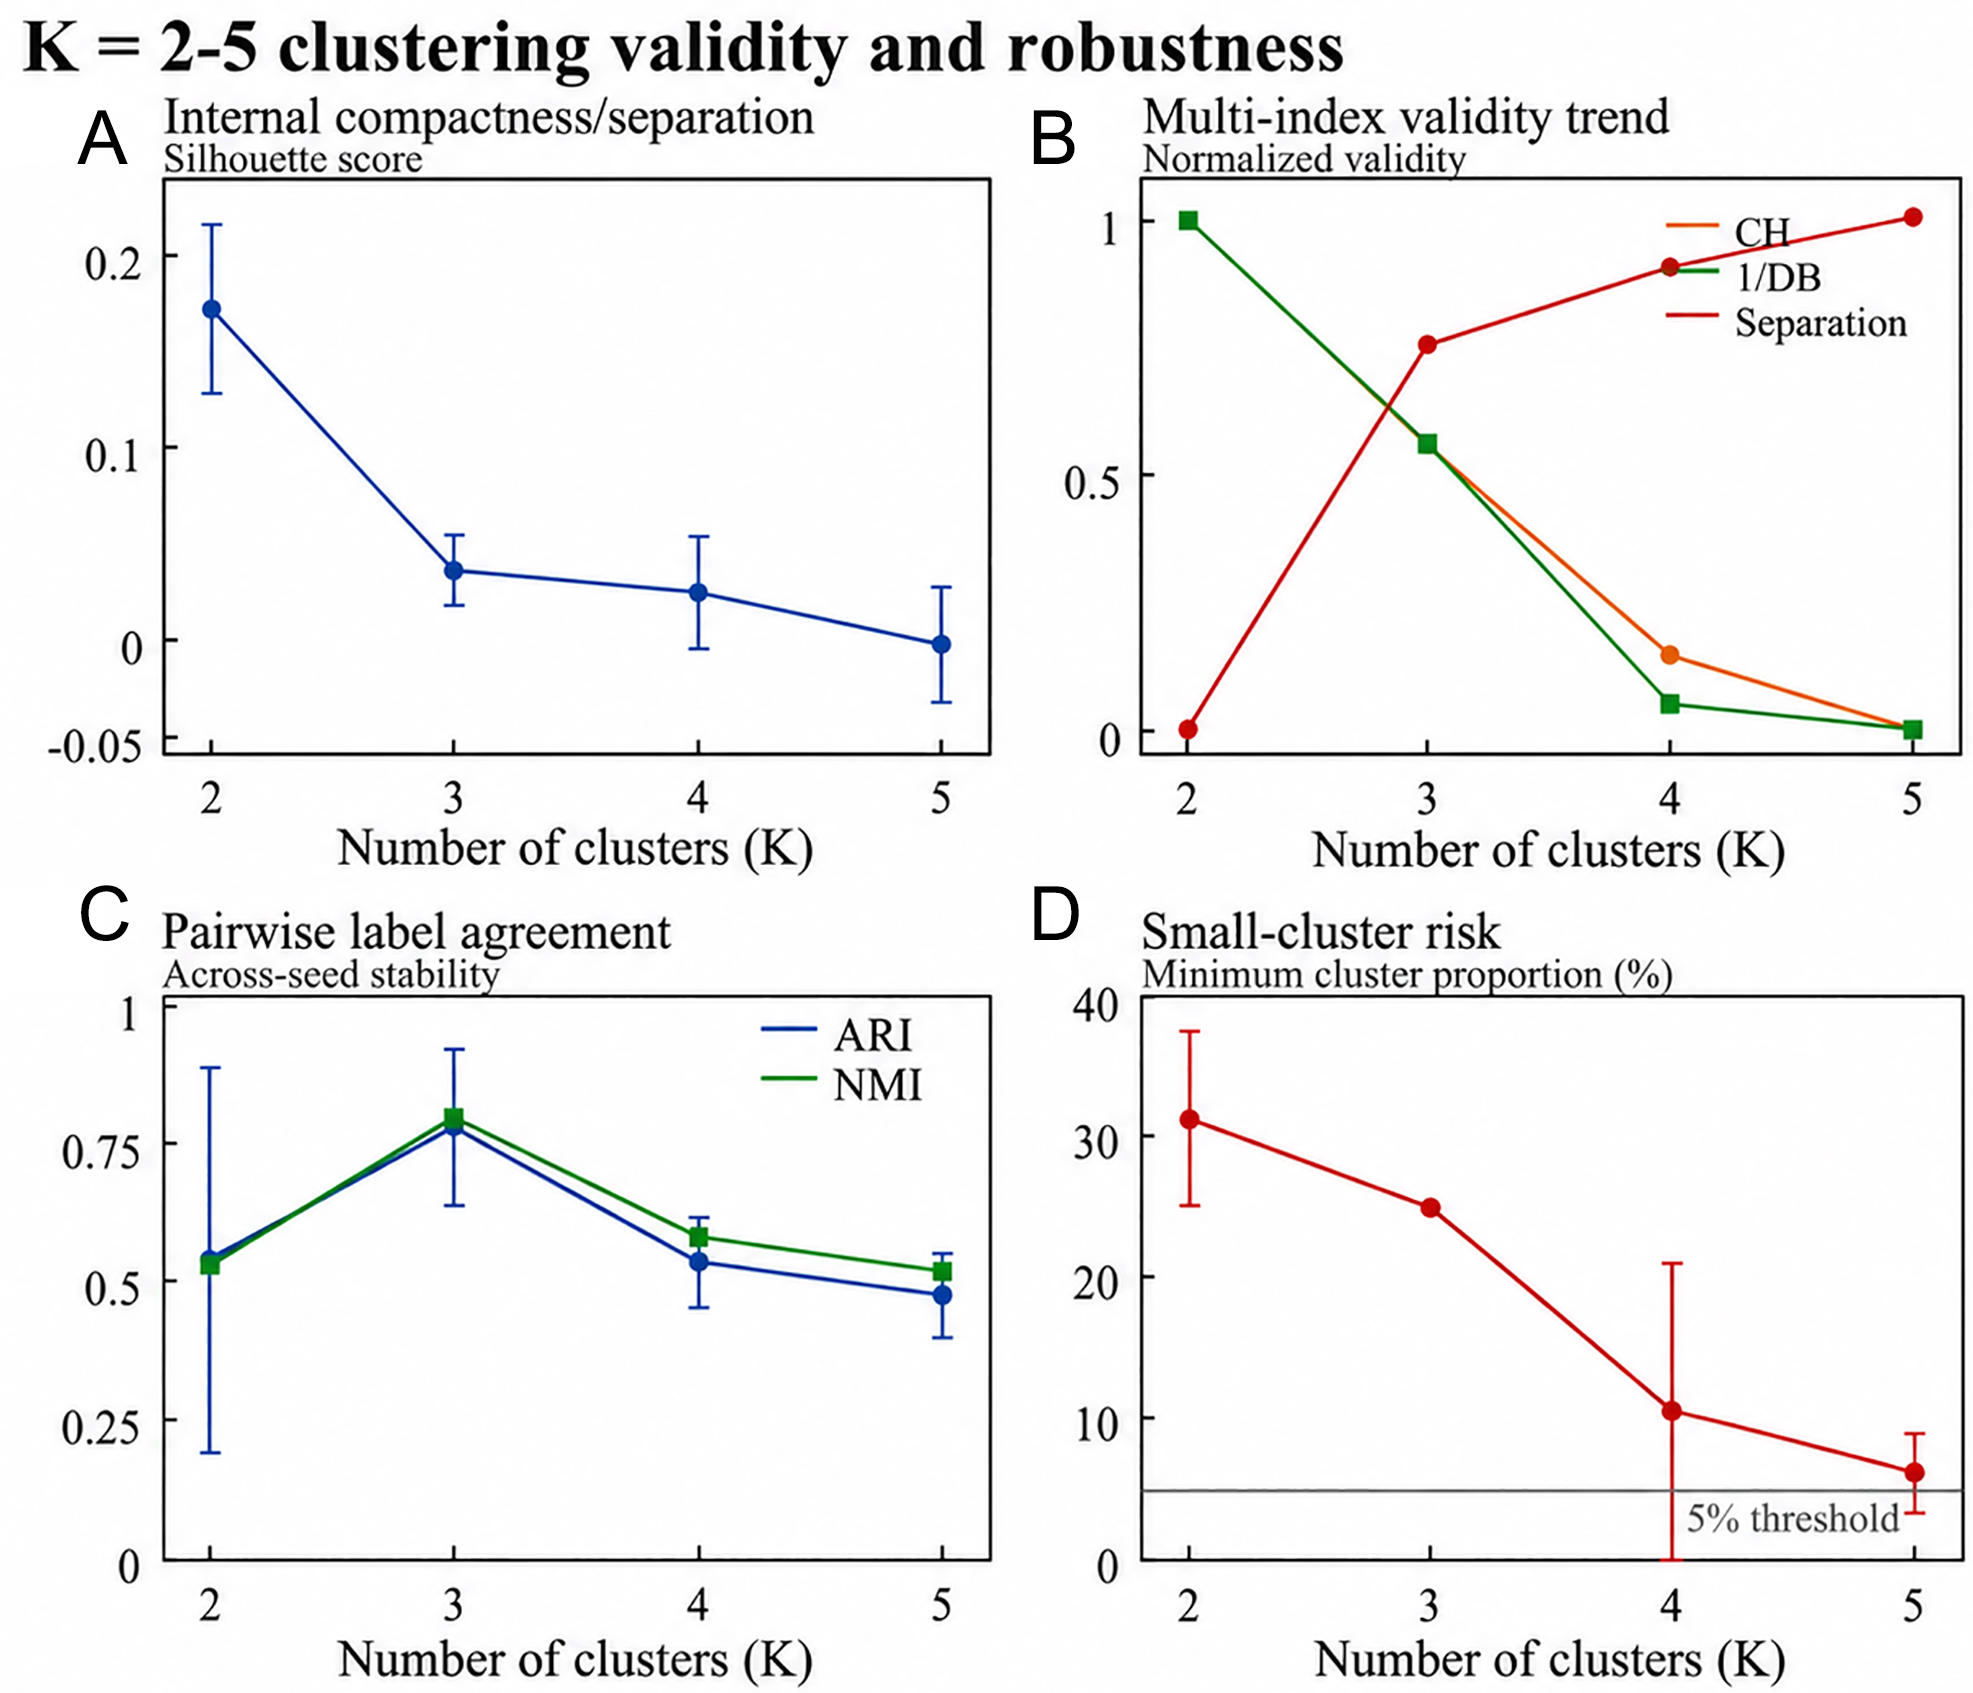
Figure 8. Validity and robustness analysis of ICG waveform clustering results under different numbers of clusters. A total of N = 1,908 valid ICG beat segments are included. (A) Silhouette score for K = 2-5. (B) Normalized trends of multiple clustering validity metrics. (C) Label consistency across random seeds. (D) Minimum cluster proportion and the 5% small-cluster risk threshold. Except for the normalized trend plot, the points represent the mean values over five repeated runs, and the error bars indicate ±1 standard deviation (mean ± SD). ARI and NMI are calculated from 10 pairwise label comparisons generated from five runs for each K value.




