

fig17
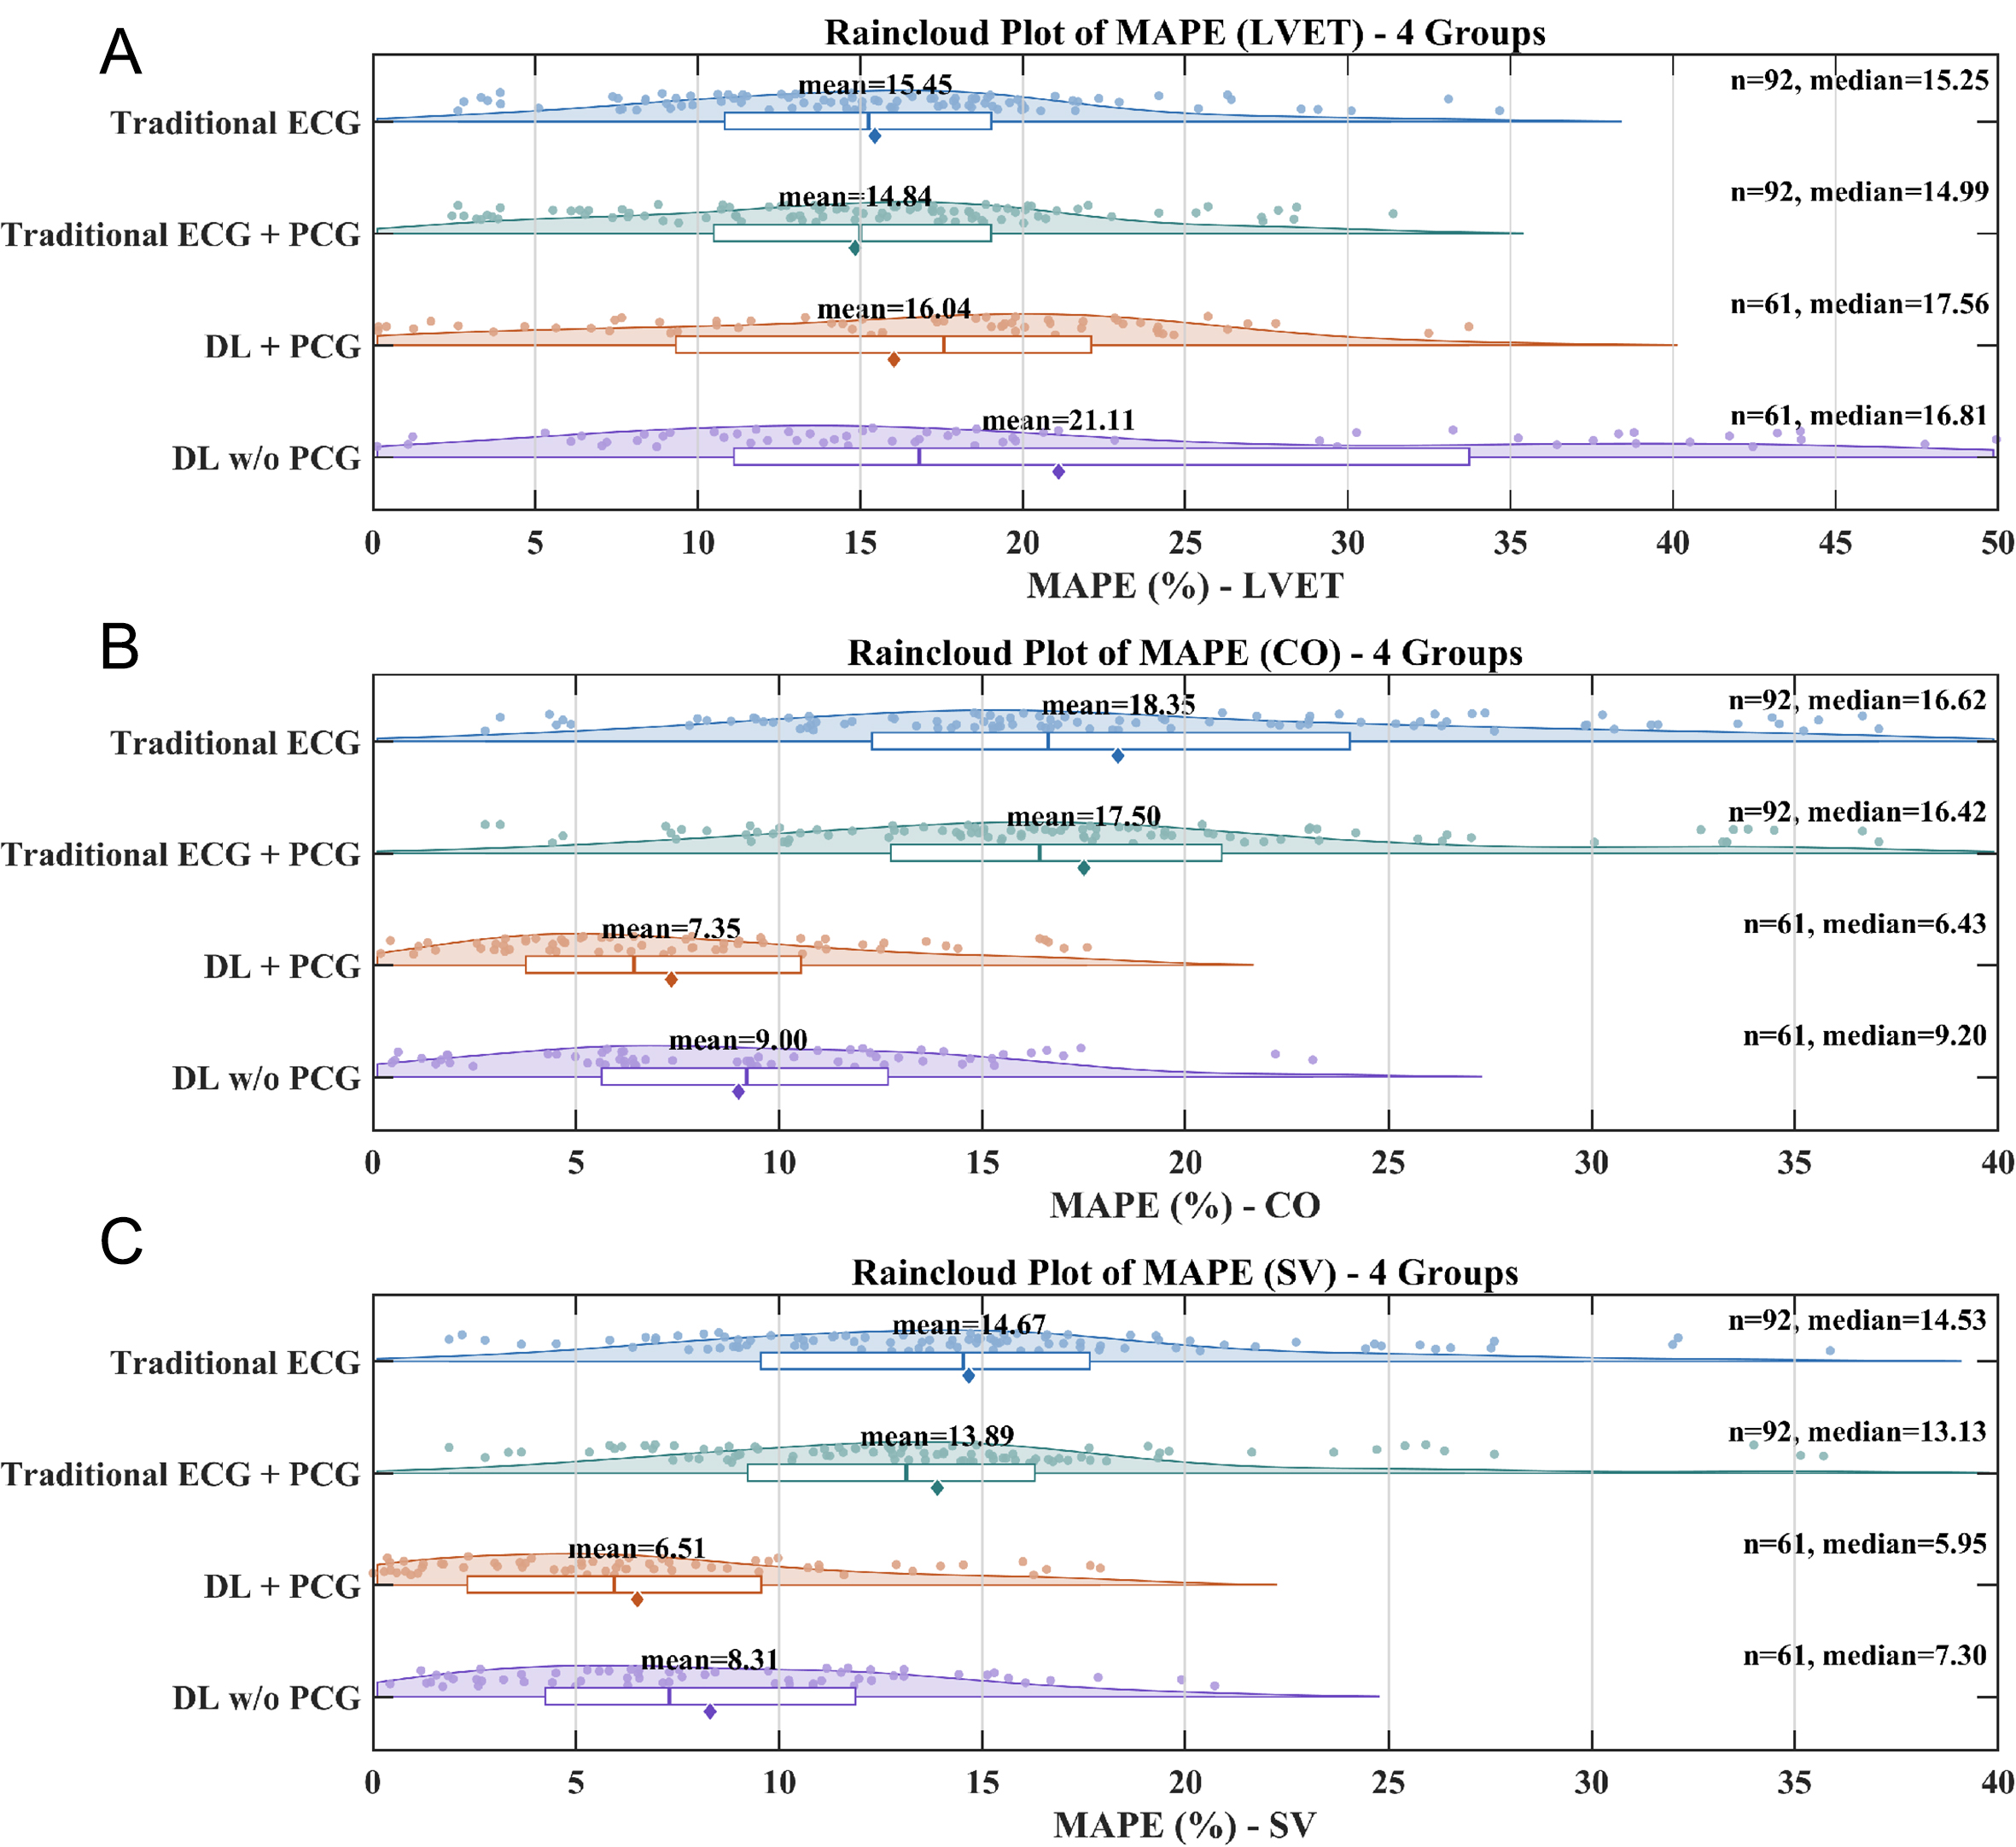
Figure 17. Raincloud plots of beat-level MAPE for LVET, SV, and CO across four methods. (A) Beat-level MAPE distribution for LVET. (B) Beat-level MAPE distribution for CO. (C) Beat-level MAPE distribution for SV. The conventional rule-based methods, ECG-only and ECG + PCG-assisted, are each evaluated on n = 92 valid test beats, whereas the deep learning methods, DL w/o PCG and DL + PCG, are each evaluated on n = 61 valid test beats. The scatter points represent the MAPE of individual valid beats, the density curves represent the error distributions, the boxplots indicate the median and interquartile range, and the diamonds denote the mean.




