

fig16
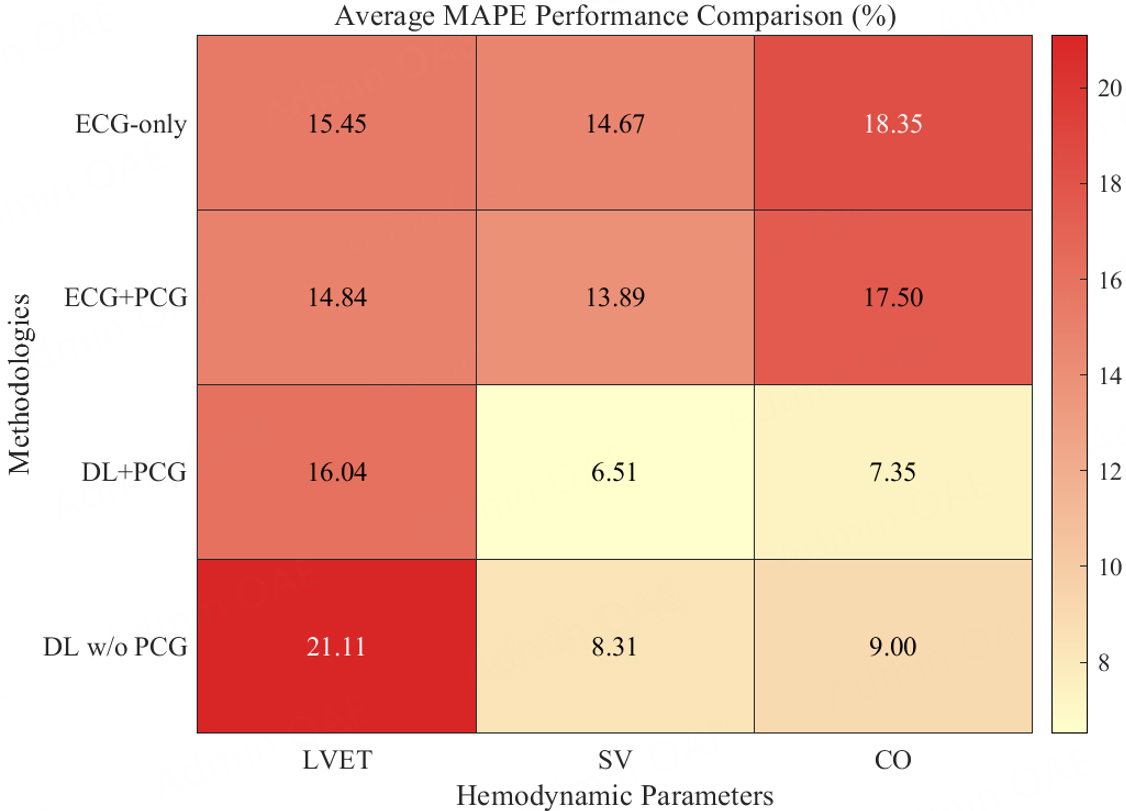
Figure 16. Heatmap of mean MAPE values for LVET, SV, and CO across the four experimental groups. Statistics for the conventional rule-based methods are based on n = 92 valid test beats, whereas statistics for the deep learning methods are based on n = 61 valid test beats. Color indicates the mean MAPE (%) of each method for the corresponding metric.




