

fig12

Morphological analysis and multimodal deep learning for impedance cardiography feature localization and hemodynamic parameter estimation

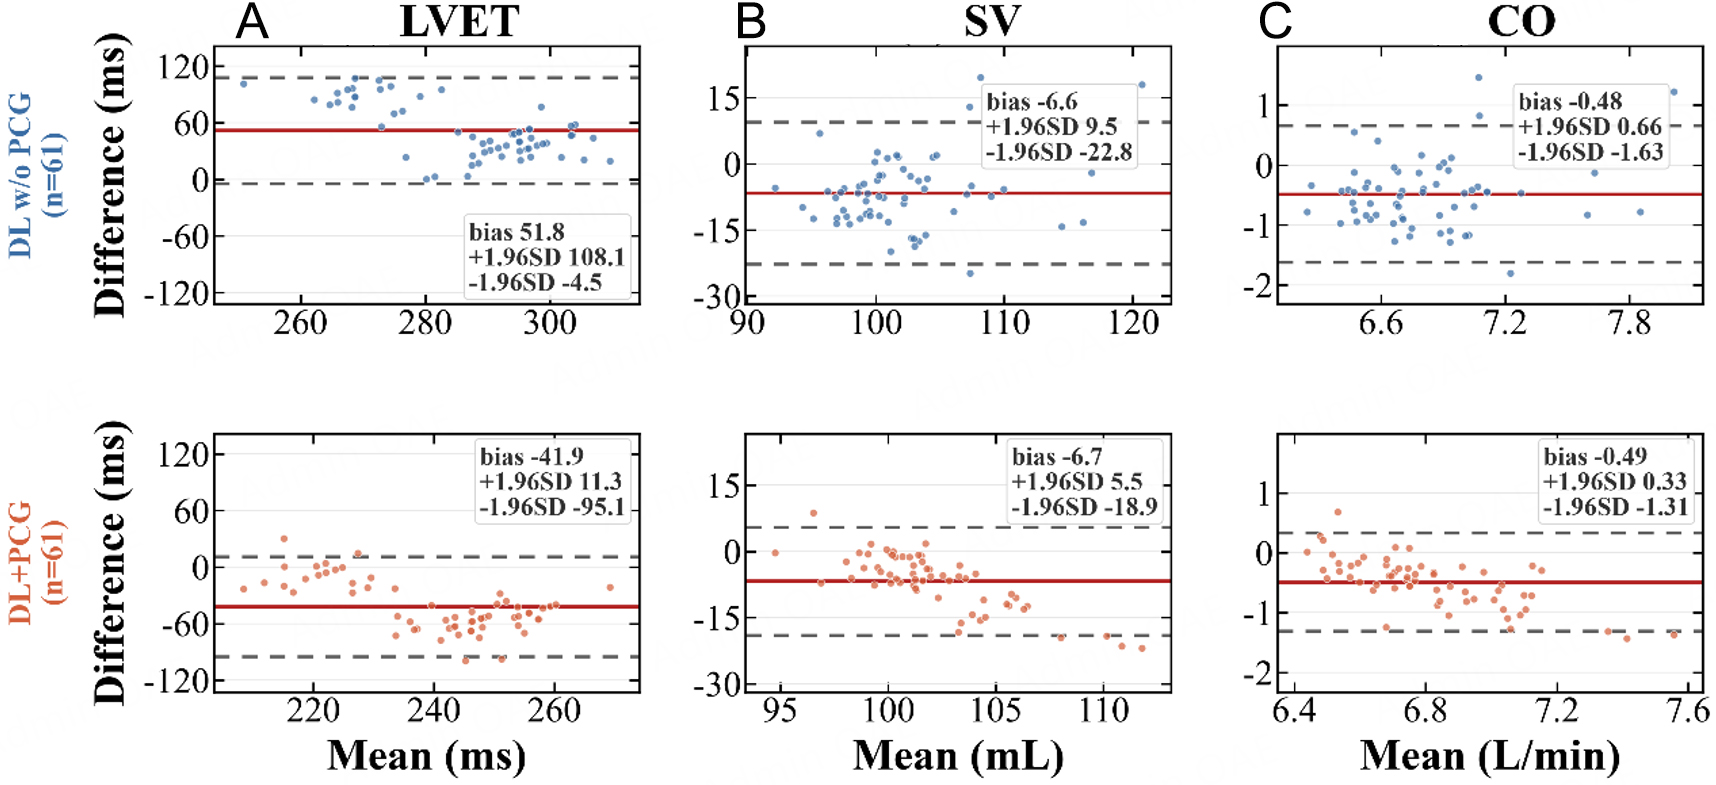
Figure 12. Bland-Altman agreement analysis of beat-level estimation results from the deep learning model (n = 61 predicted-reference pairs in each panel). (A-C) correspond to LVET, SV, and CO, respectively. The solid line represents the mean bias, and the dashed lines indicate the 95% limits of agreement.


The Journal of Cardiovascular Aging
ISSN 2768-5993 (Online)

Portico

All published articles are preserved here permanently:

https://www.portico.org/publishers/oae/

Portico

All published articles are preserved here permanently:

https://www.portico.org/publishers/oae/


