

fig4
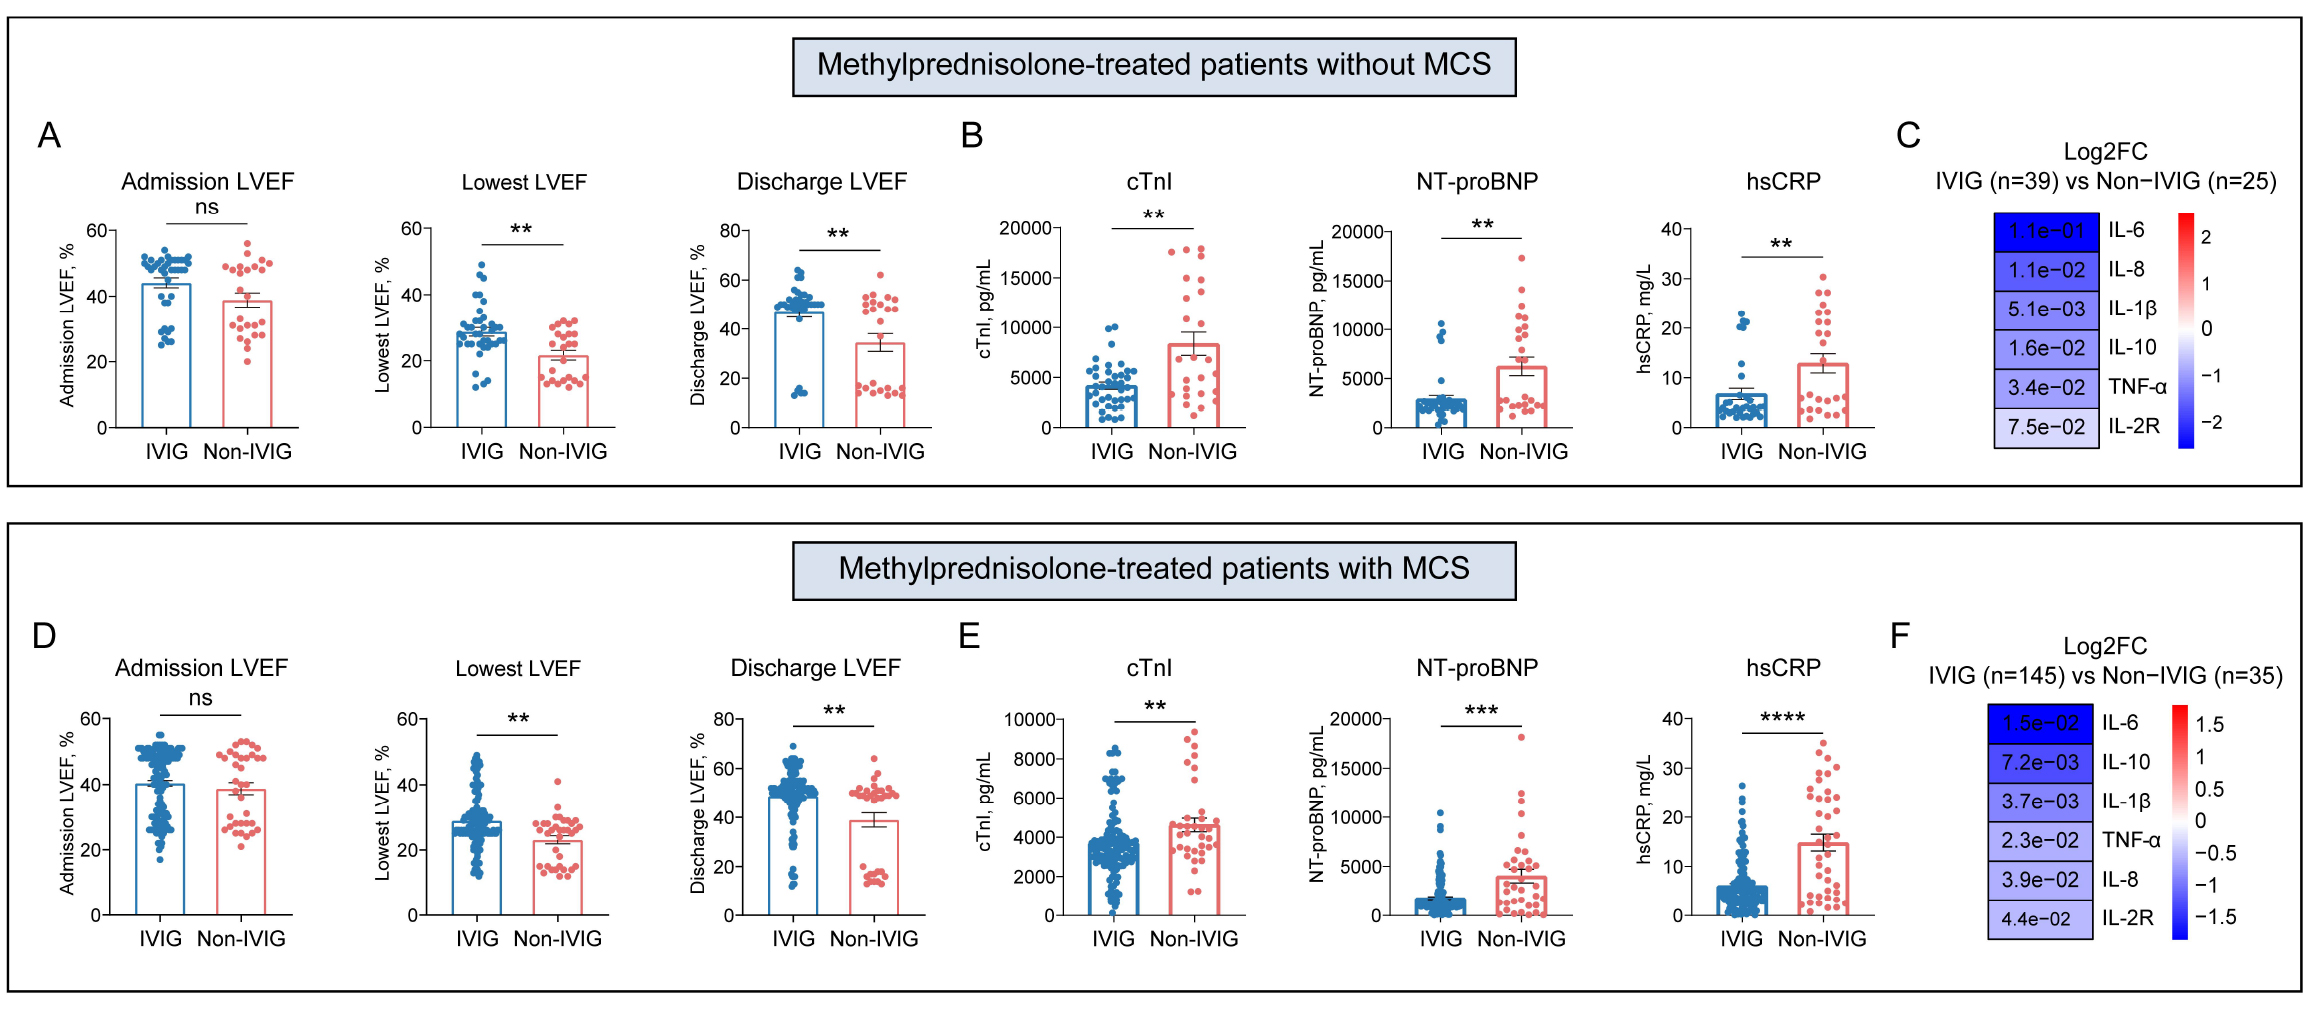
Figure 4. Cardiac function and in-hospital cardiac and inflammatory biomarker profiles according to IVIG use. (A-C) show methylprednisolone-treated patients without MCS (IVIG, n = 39; non-IVIG, n = 25). (A) admission, lowest in-hospital, and discharge LVEF. (B) in-hospital cTnI, NT-proBNP, and hsCRP. (C) heatmap of circulating cytokine differences between groups. (D-F) show methylprednisolone-treated patients receiving MCS (IVIG, n = 145; non-IVIG, n = 35). (D) admission, lowest in-hospital, and discharge LVEF. (E) in-hospital cTnI, NT-proBNP, and hsCRP. (F) heatmap of circulating cytokine differences between groups. Heatmap color represents log2 fold change for IVIG relative to non-IVIG, and the numbers within cells are P values. Dot-bar plots show individual observations with mean ± standard error of the mean. Group comparisons used the Mann-Whitney U test. **P < 0.01, ***P < 0.001, ****P < 0.0001; ns: not significant.




