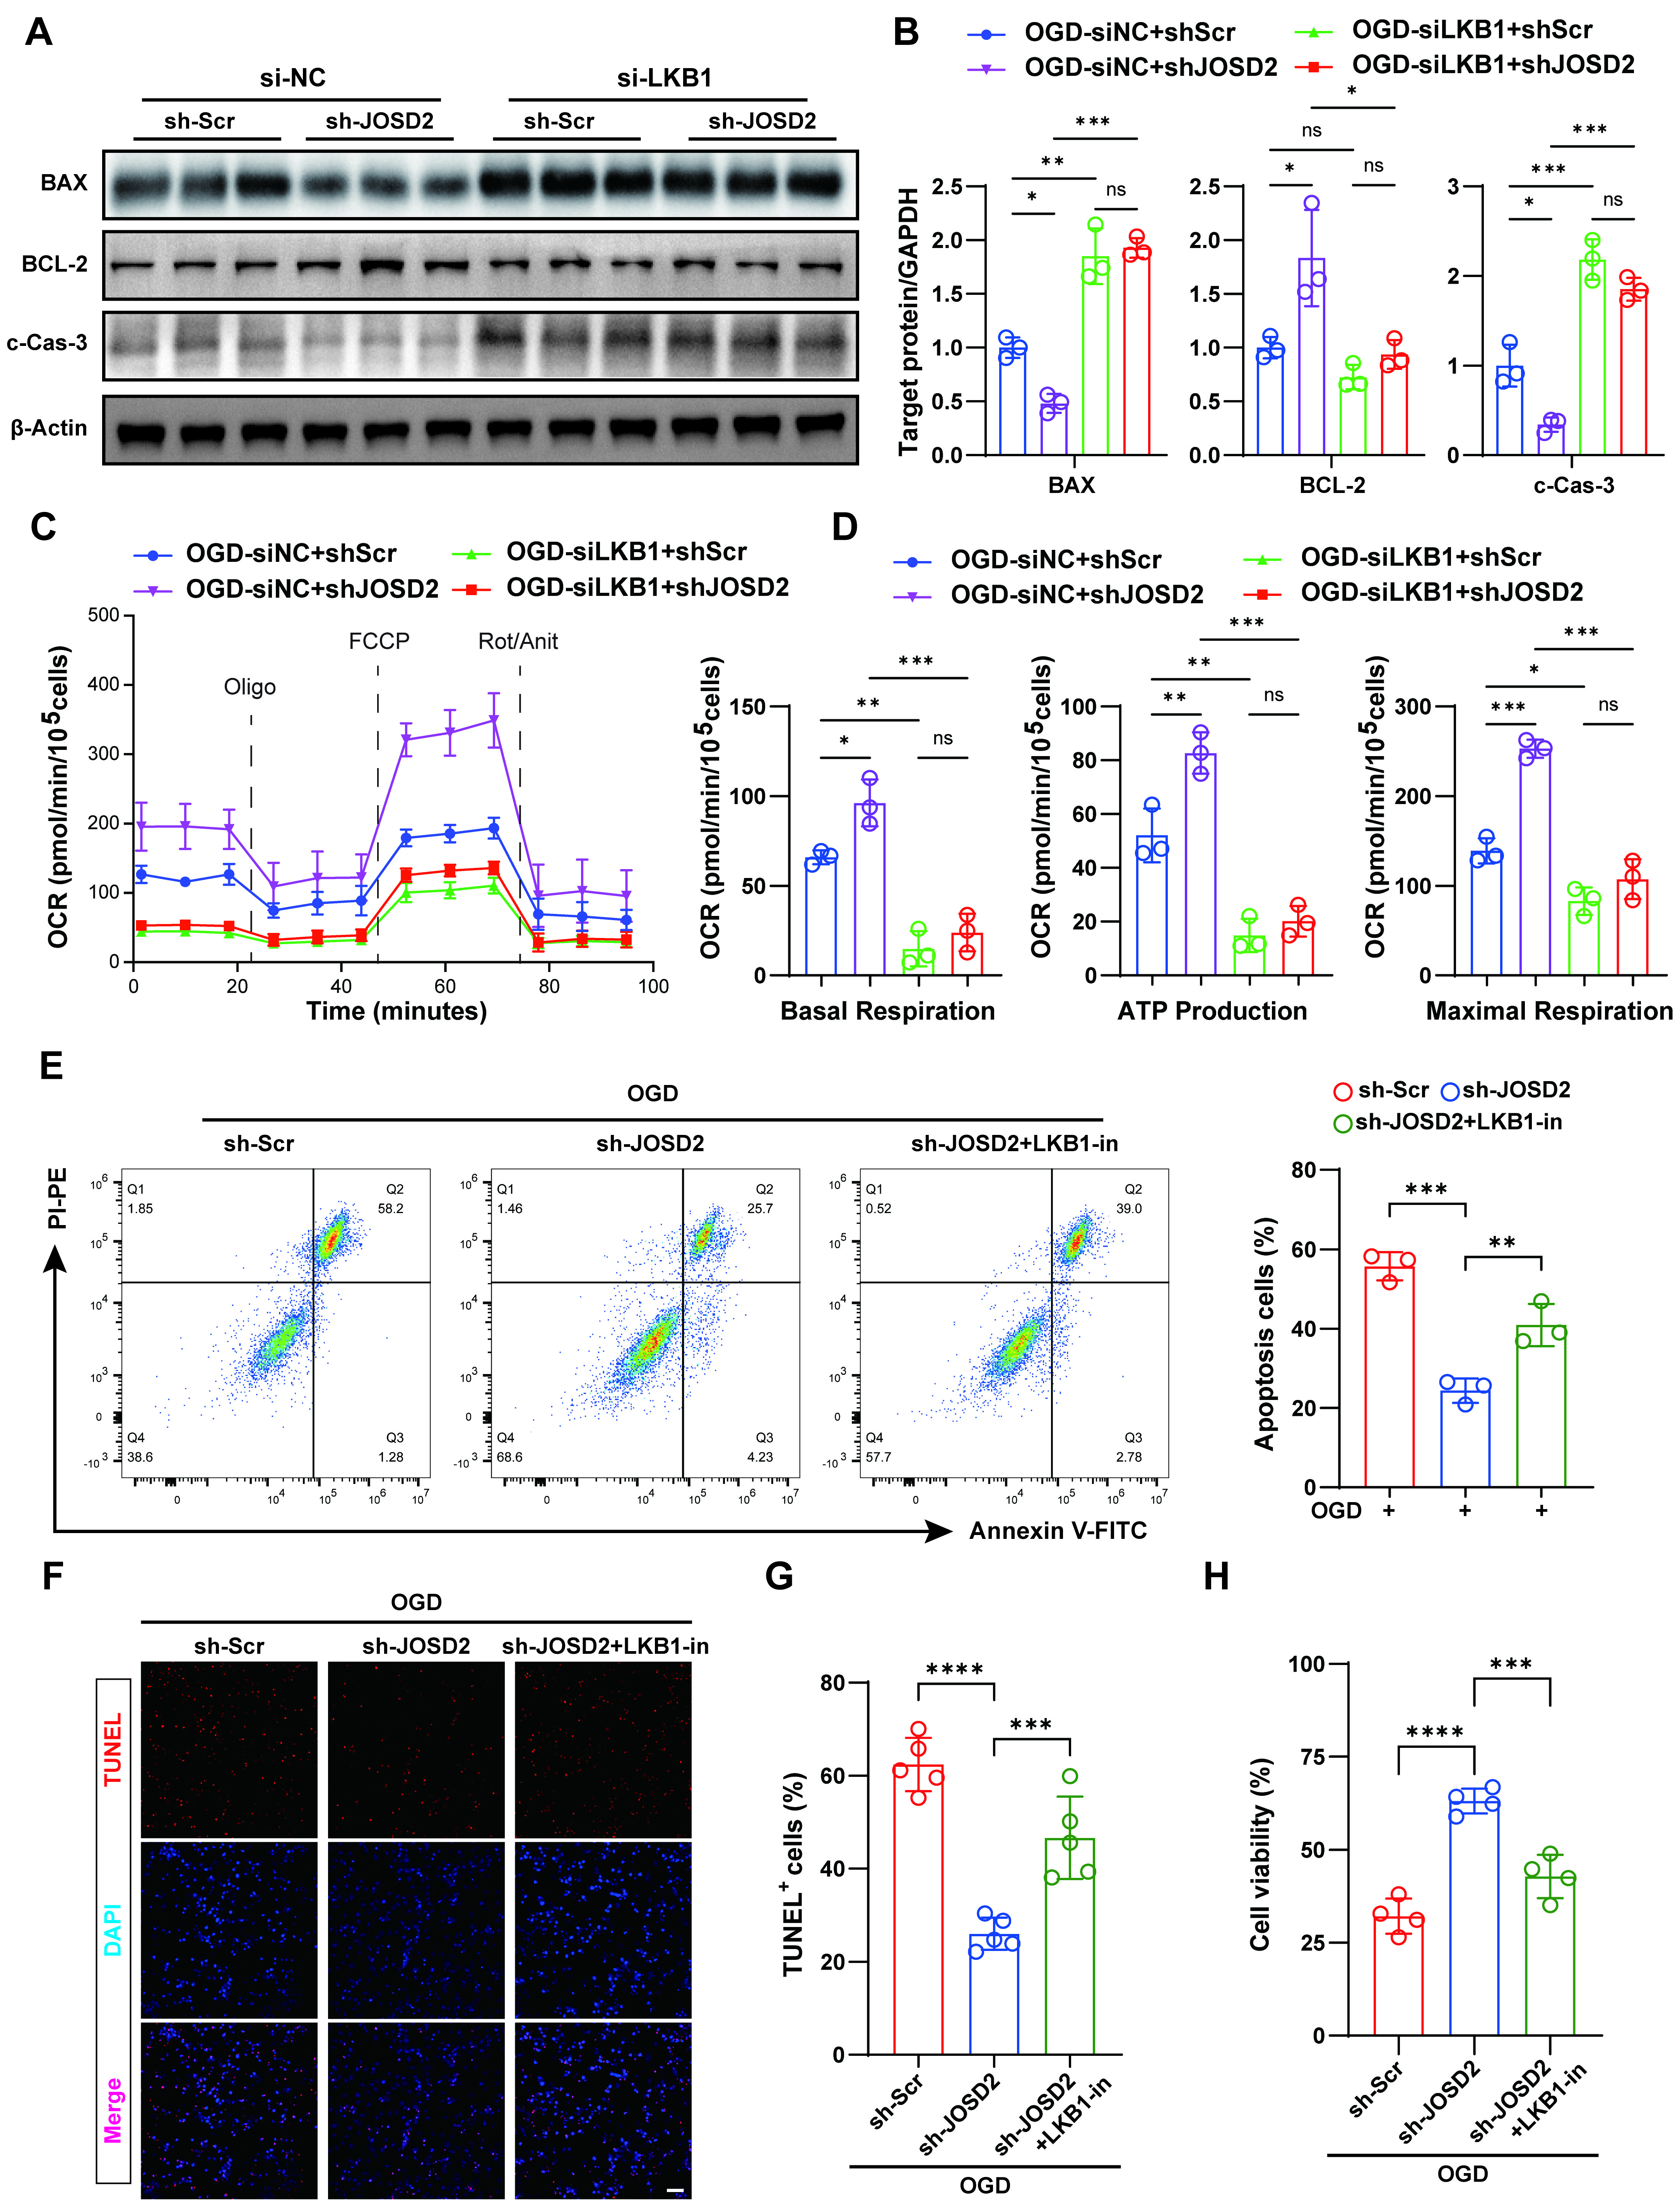
Figure 6. Requirement of LKB1 for the protective effect of JOSD2 knockdown under OGD. (A) Western blots of apoptosis-associated proteins (BAX, BCL-2, cleaved caspase-3) in siNC + sh-Scr, siNC + sh-JOSD2, siLKB1 + sh-Scr, and siLKB1 + sh-JOSD2 AC16 cells under OGD; (B) Densitometric quantification of apoptosis-associated proteins (n = 3); (C and D) OCR measurements and quantification by Seahorse analysis in siNC + sh-Scr, siNC + sh-JOSD2, siLKB1 + sh-Scr, and siLKB1 + sh-JOSD2 AC16 cells following OGD exposure; (E) Representative flow cytometry plots and quantification of apoptotic cells in sh-Scr, sh-JOSD2, and sh-JOSD2 + LKB1-in AC16 cells under OGD (n = 3); (F) Representative TUNEL staining images in sh-Scr, sh-JOSD2, and sh-JOSD2 + LKB1-in AC16 cells under OGD. Scale bar, 50 μm; (G) Quantification of TUNEL+ cells (n = 5); (H) CCK-8 assay showing cell viability in sh-Scr, sh-JOSD2, and sh-JOSD2 + LKB1-in AC16 cells under OGD (n = 4). All results are representative of at least three independent experiments. Data are presented as mean ± SD. Statistical analyses were performed using two-way ANOVA with Tukey’s post hoc test for (B) and (D) and one-way ANOVA with Tukey’s post hoc test for (E), (G), and (H). ns, not significant. *P < 0.05, **P < 0.01, ***P < 0.001, ****P < 0.0001. JOSD2: Josephin domain-containing protein 2; LKB1: liver kinase B1; SD: standard deviation; OGD: oxygen-glucose deprivation; OCR: oxygen consumption rate; ANOVA: analysis of variance; SD: standard deviation; TUNEL: transferase dUTP nick-end labeling; BAX: BCL-2-associated X protein; BCL-2: B-cell lymphoma 2; FCCP: carbonyl cyanide 4-(trifluoromethoxy)phenylhydrazone; PI-PE: propidium iodide-P-phycoerythrin; Annexin V-FITC: annexin V-fluorescein isothiocyanate; DAPI: 4’,6-diamidino-2-phenylindol.