


fig5
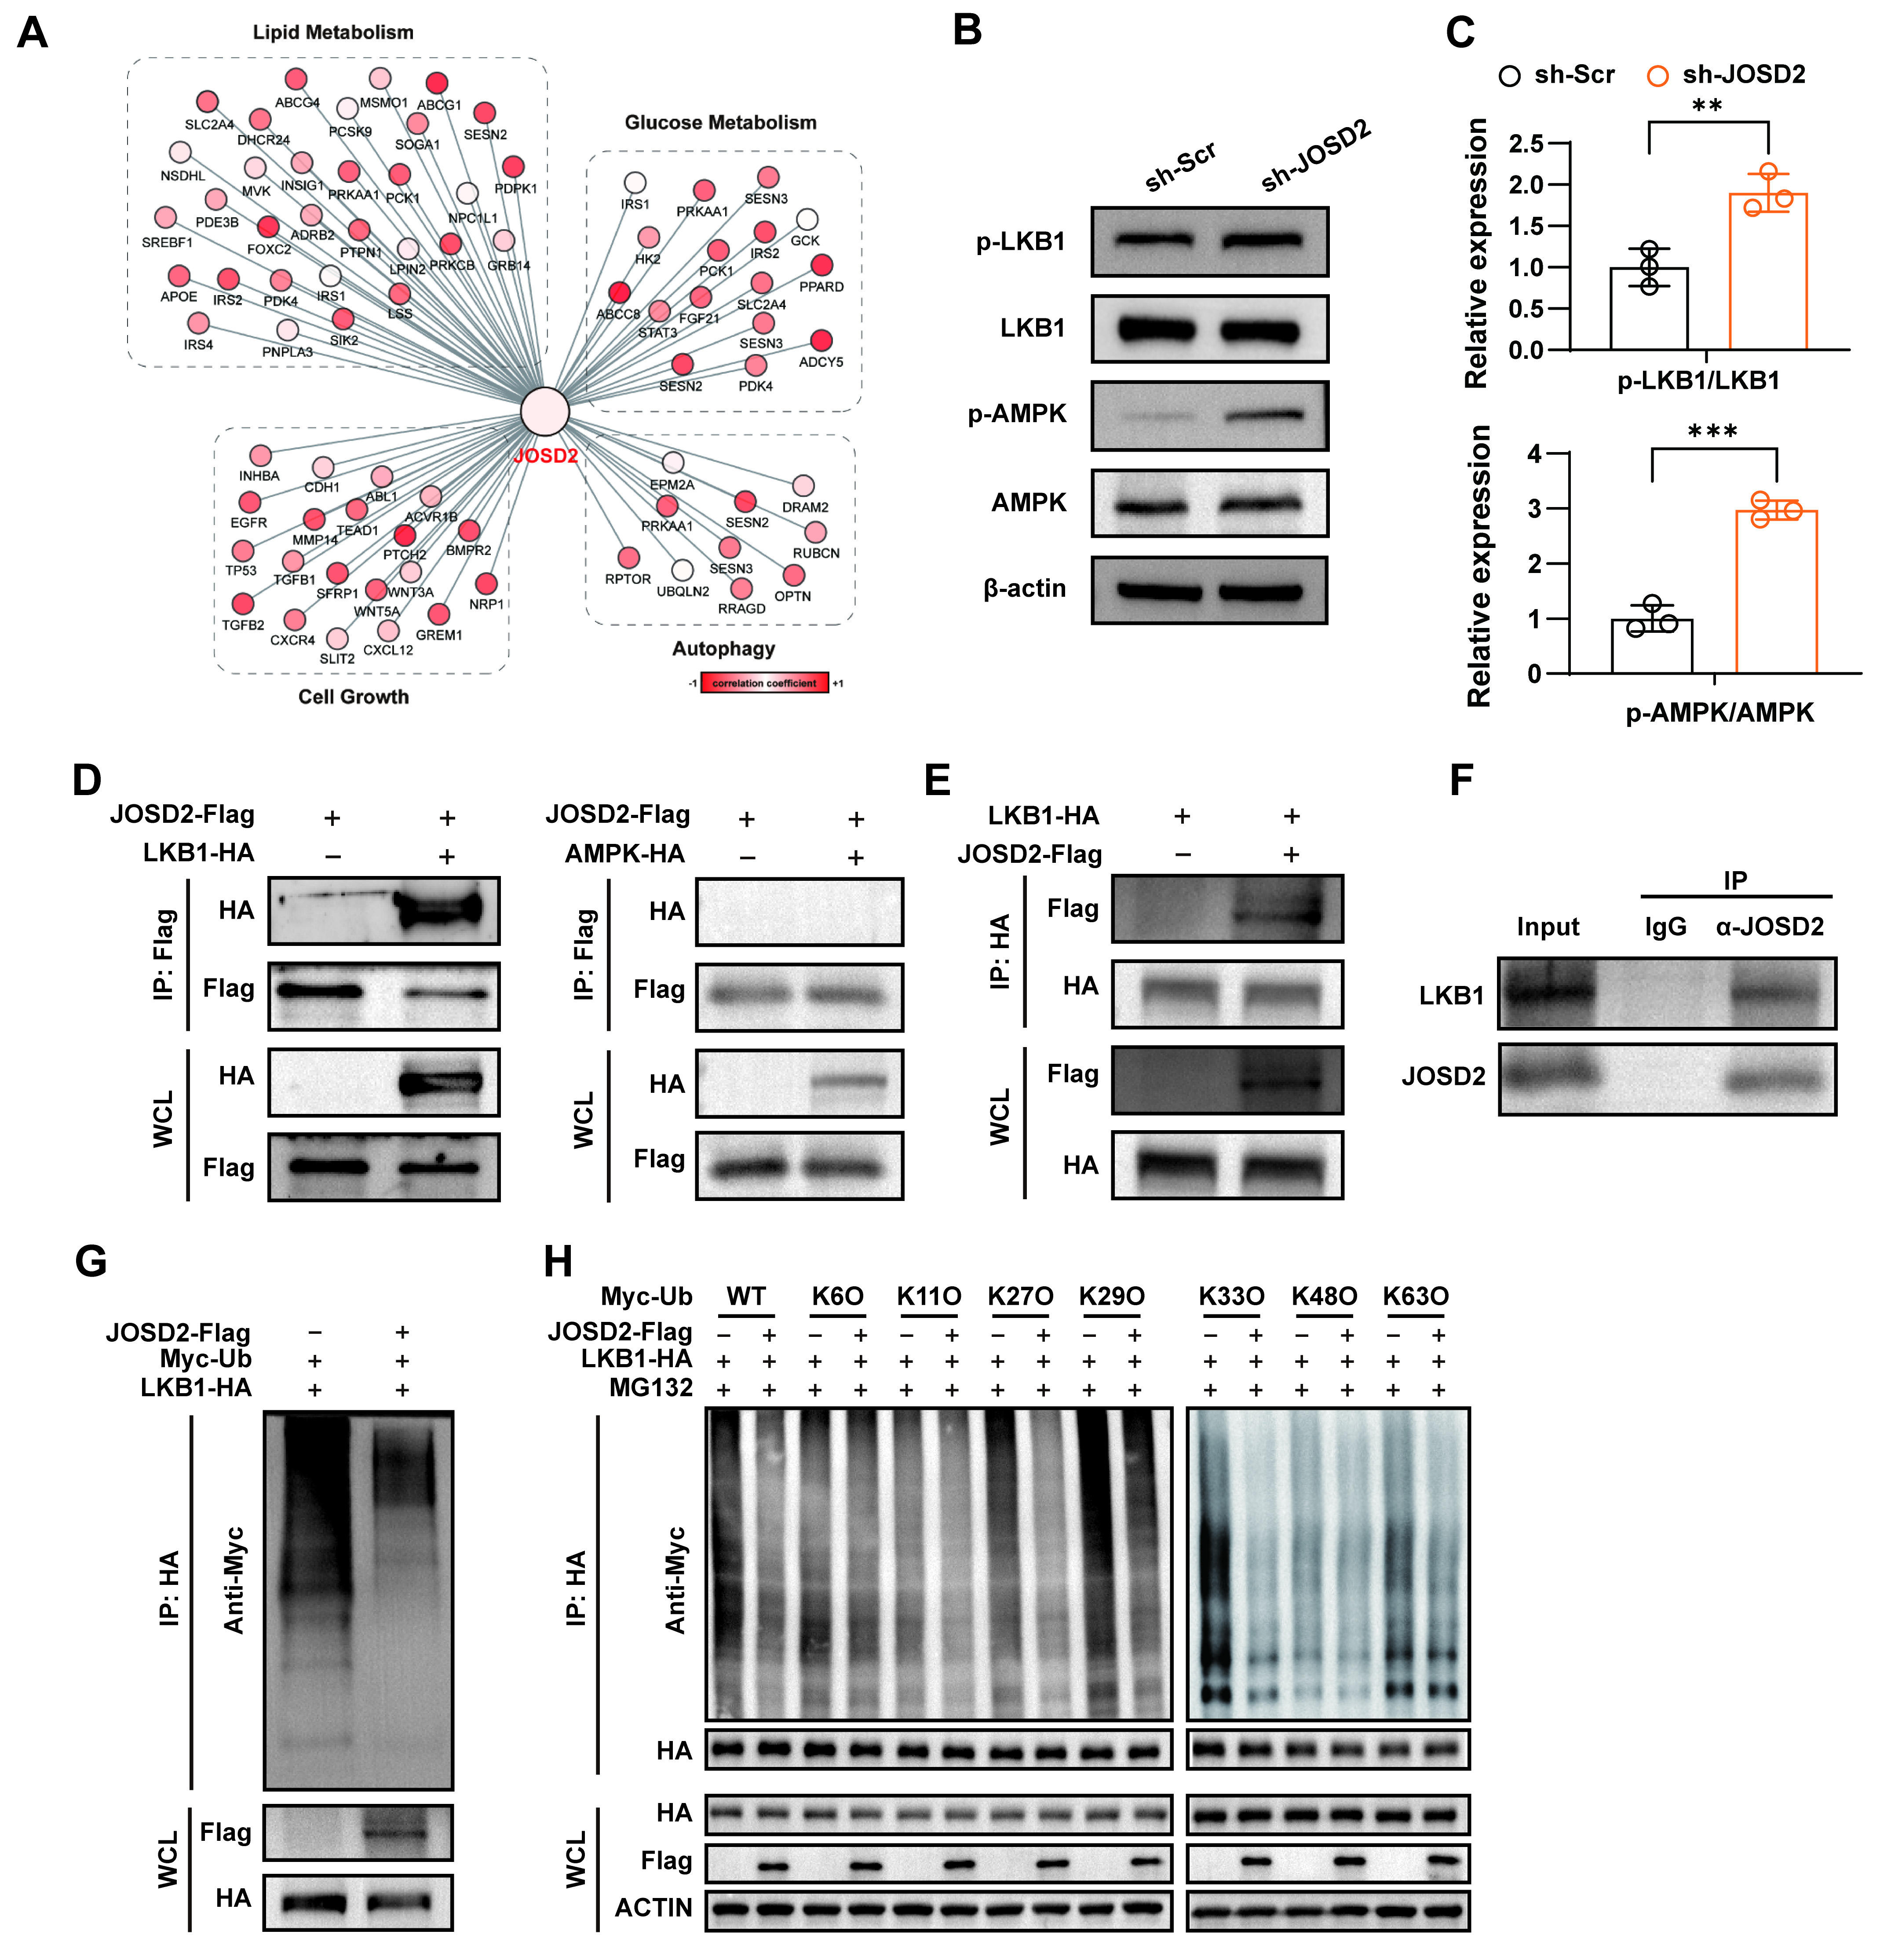
Figure 5. Interaction of JOSD2 with LKB1 and promotion of LKB1 deubiquitination. (A) Correlation of JOSD2 expression with the expression profiles of genes related to lipid metabolism, glucose metabolism, cell growth, and autophagy based on RNA-seq data; (B) Western blots showing levels of phosphorylated and total LKB1 and AMPK in sh-Scr and sh-JOSD2 AC16 cells; (C) Quantification of p-LKB1/LKB1 and p-AMPK/AMPK ratios (n = 3); (D) Co-immunoprecipitation of JOSD2-Flag with LKB1-HA or AMPK-HA in HEK293T cells; (E) Reciprocal co-IP of LKB1-HA with JOSD2-Flag in HEK293T cells; (F) Endogenous co-IP of JOSD2 and LKB1 in AC16 cells; (G) Ubiquitination assay of LKB1 in AC16 cells transfected with LKB1-HA and Myc-Ub, with or without JOSD2 overexpression; (H) Linkage-specific ubiquitination assay of LKB1 in AC16 cells. Cells were co-transfected with LKB1-HA and the indicated Myc-tagged ubiquitin mutants (WT, K6O, K11O, K27O, K29O, K33O, K48O, or K63O), with or without JOSD2-Flag, and treated with MG132. All results are representative of three independent experiments. Data are presented as mean ± SD. Statistical analysis was performed using an unpaired two-tailed Student’s t-test for (C). **P < 0.01, ***P < 0.001. JOSD2: Josephin domain-containing protein 2; LKB1: liver kinase B1; SD: standard deviation; AMPK: AMP-activated protein kinase; p-AMPK: phosphorylation of AMPK; p-LKB1: phosphorylation of LKB1; WT: wild type; HA: human influenza hemagglutinin; WCL: whole cell lysate.


