


fig1
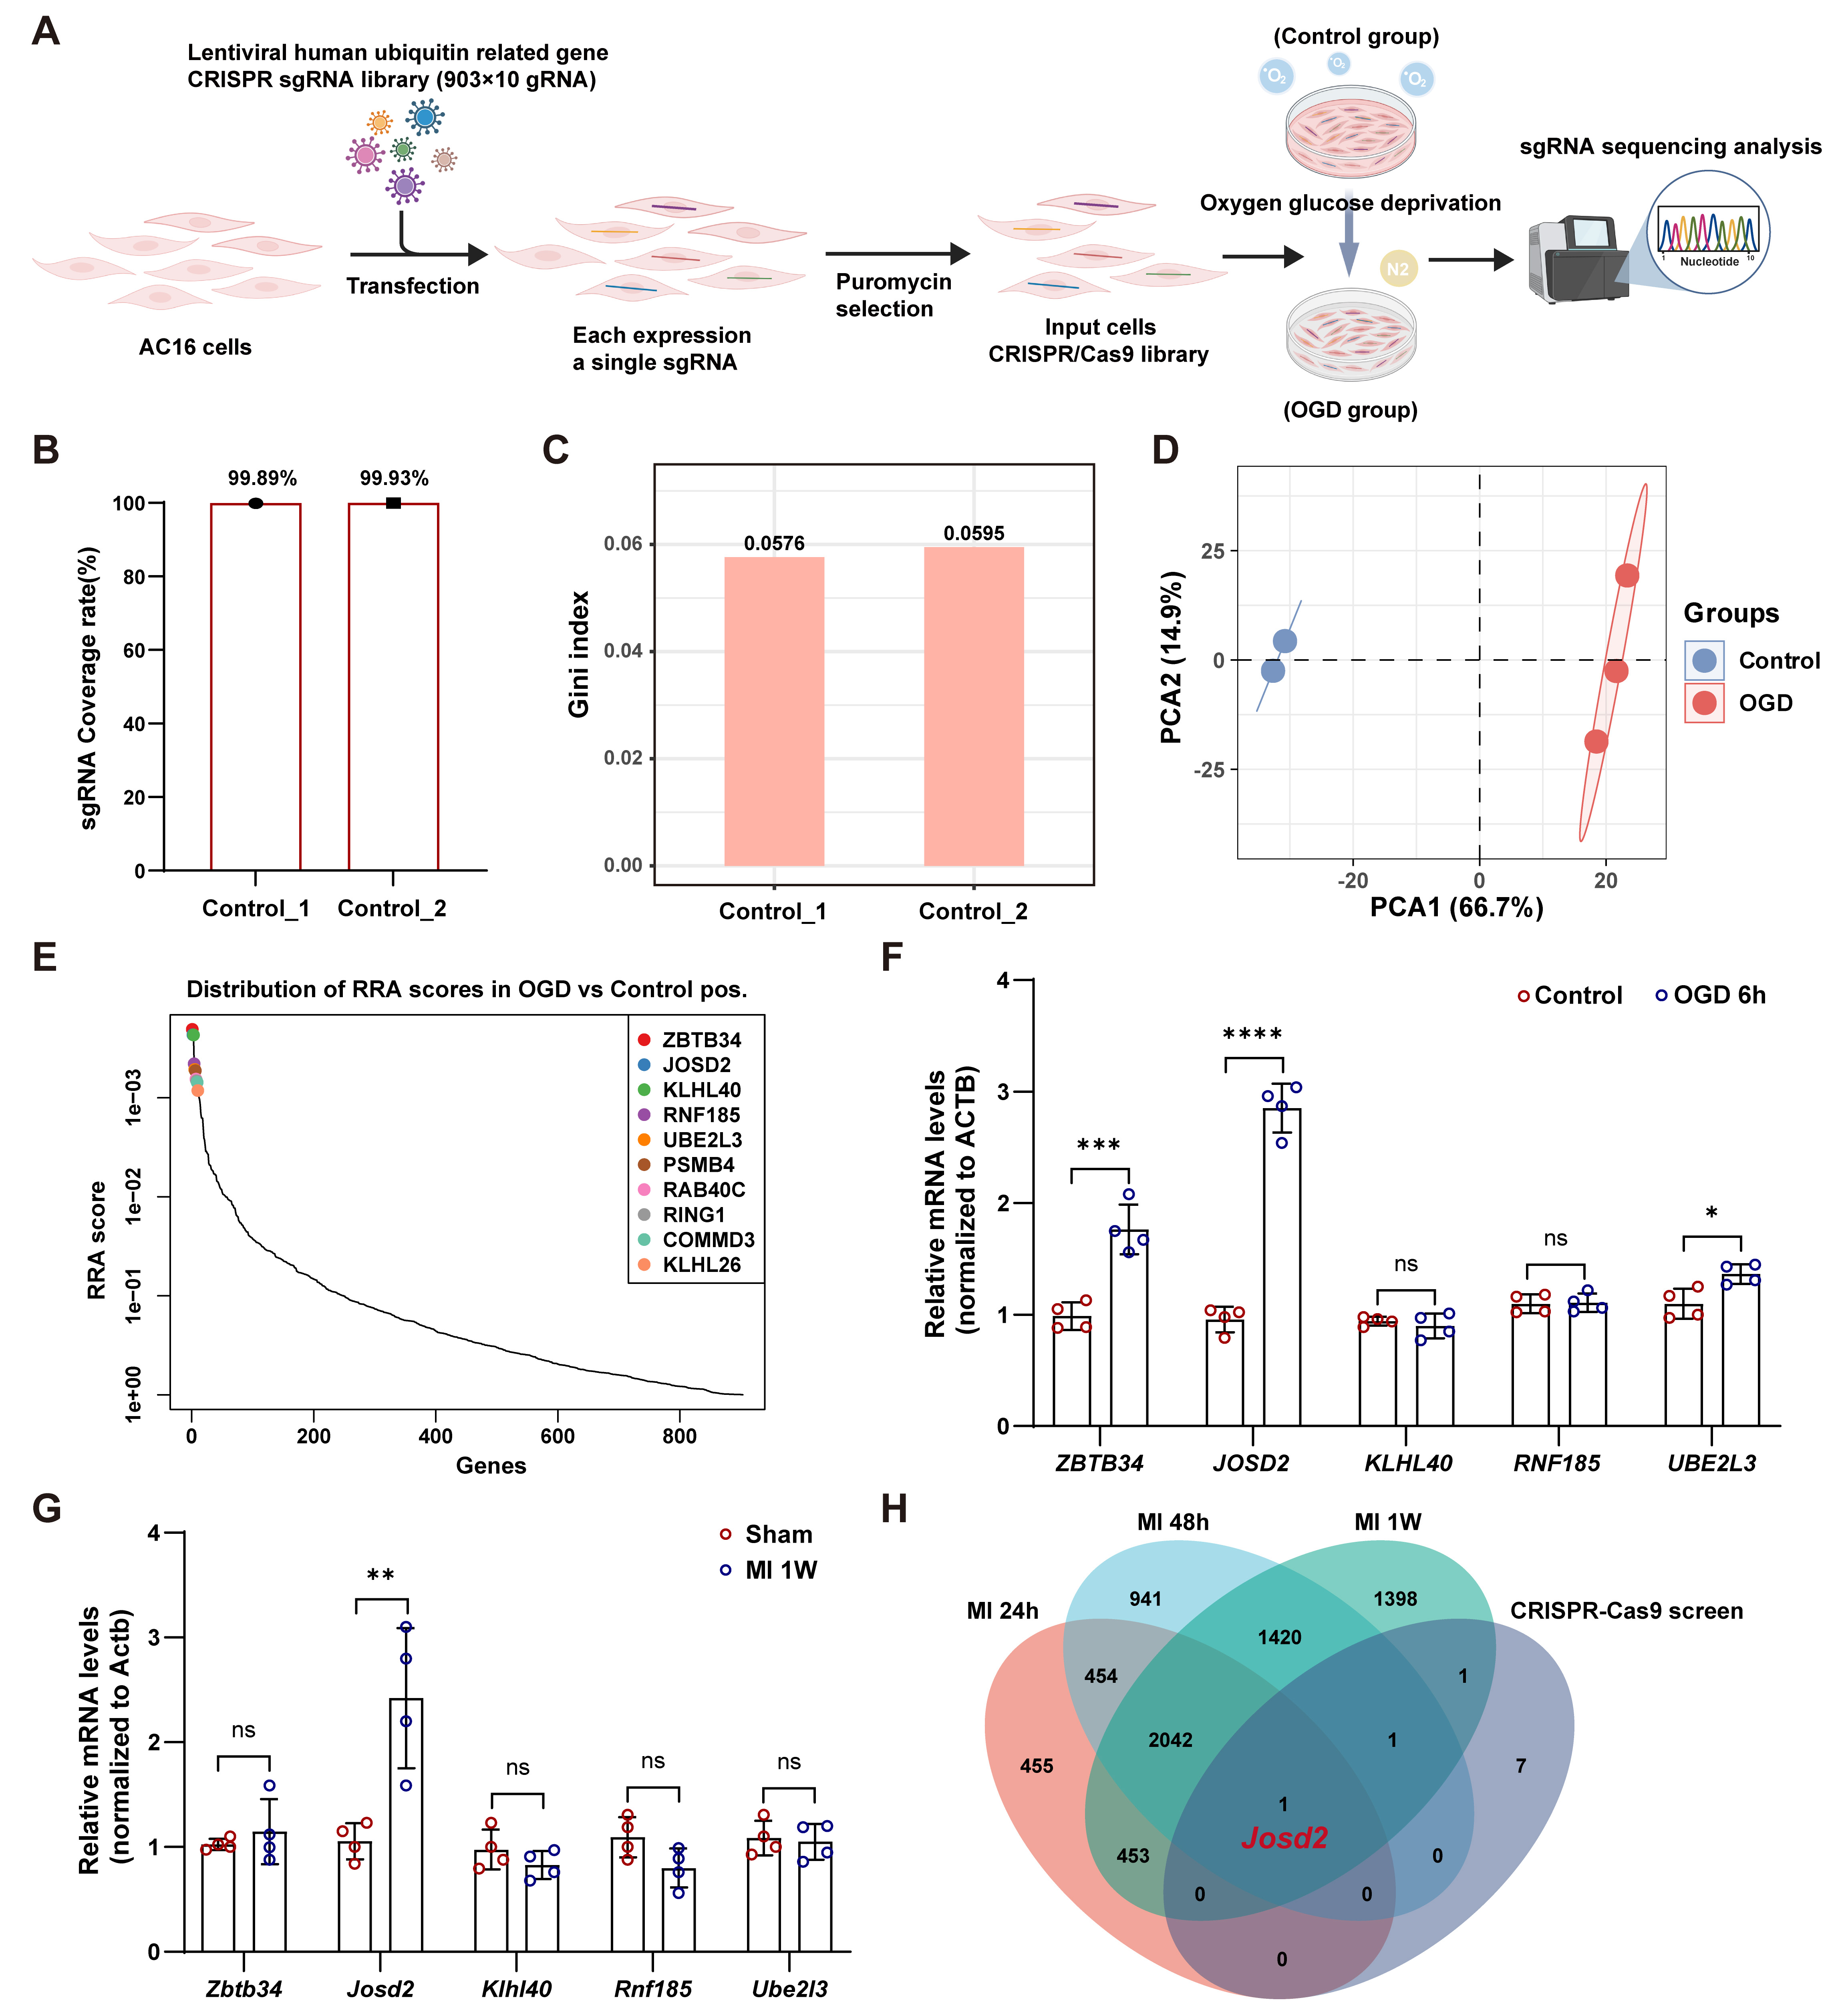
Figure 1. Ubiquitin-related pooled CRISPR-Cas9 screen under OGD. (A) Schematic of the pooled CRISPR-Cas9 screen in AC16 cells; (B) sgRNA coverage rate (%) in two independent control input libraries (Control_1 and Control_2); (C) Gini index of sgRNA read-count distribution in Control_1 and Control_2; (D) PCA of sgRNA abundance profiles in controls (n = 2) and OGD-selected samples (n = 3); (E) Rank-based distribution of RRA scores from the positive-selection CRISPR screen (OGD vs. control). Top-ranked candidate genes are highlighted; (F) RT-qPCR validation of the top five candidate genes in AC16 cells after 6 h of OGD vs control conditions; mRNA levels were normalized to ACTB; (G) RT-qPCR analysis of the corresponding genes in murine hearts 1 week after MI versus sham; mRNA levels were normalized to Actb; (H) Venn diagram showing overlap between genes from the CRISPR-Cas9 screen and genes identified from a published MI transcriptome time-course dataset at 24 h, 48 h, and 1-week post-MI (GSE775); Data in (F) and (G) are representative of four independent experiments and are presented as mean ± SD. Statistical significance was determined using an unpaired two-tailed Student’s t-test. ns, not significant; *P < 0.05, **P < 0.01, ***P < 0.001, ****P < 0.0001. OGD: Oxygen-glucose deprivation; SD: standard deviation; PCA: principal component analysis; sgRNA: single-guide RNA; RRA: robust rank aggregation; RT-qPCR: reverse transcription quantitative polymerase chain reaction; MI: myocardial infarction.


