

fig2
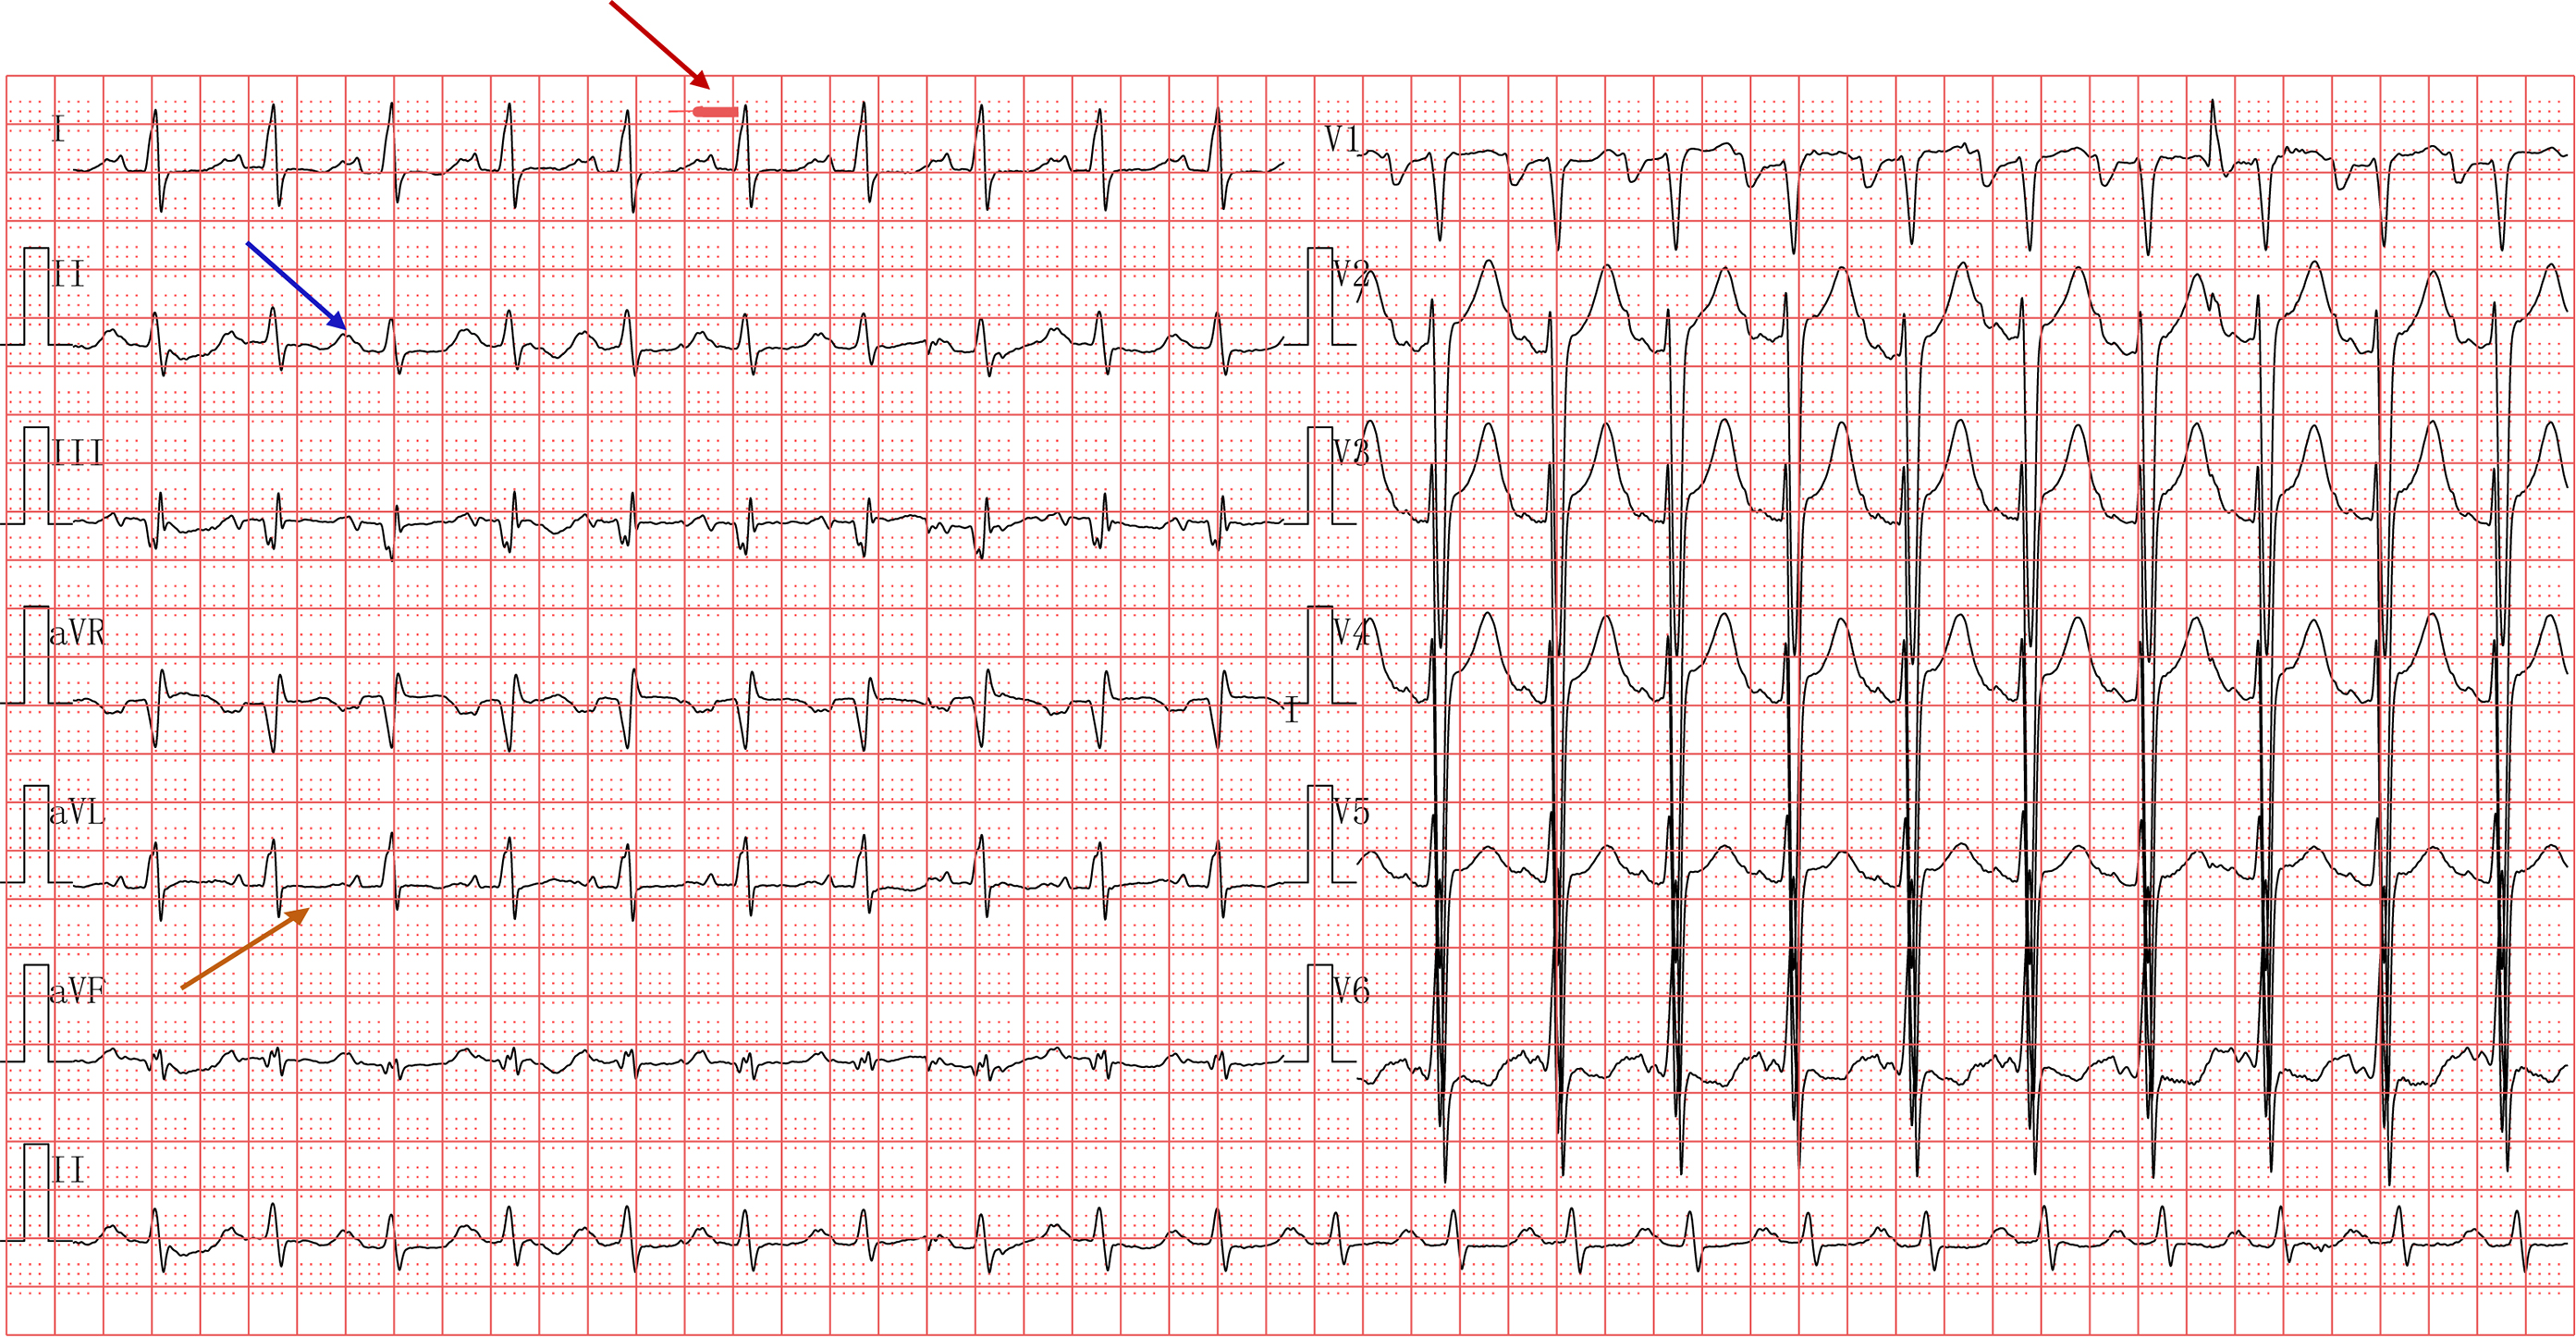
Figure 2. Electrocardiogram (paper speed 25 mm/s, sensitivity 10 mm/mV, 15 Hz) on the first day of hospitalization shows: sinus rhythm, clockwise rotation, prolonged PR interval (red arrow), left atrial abnormality (blue arrow) and T-wave changes (orange arrow).




