

fig5
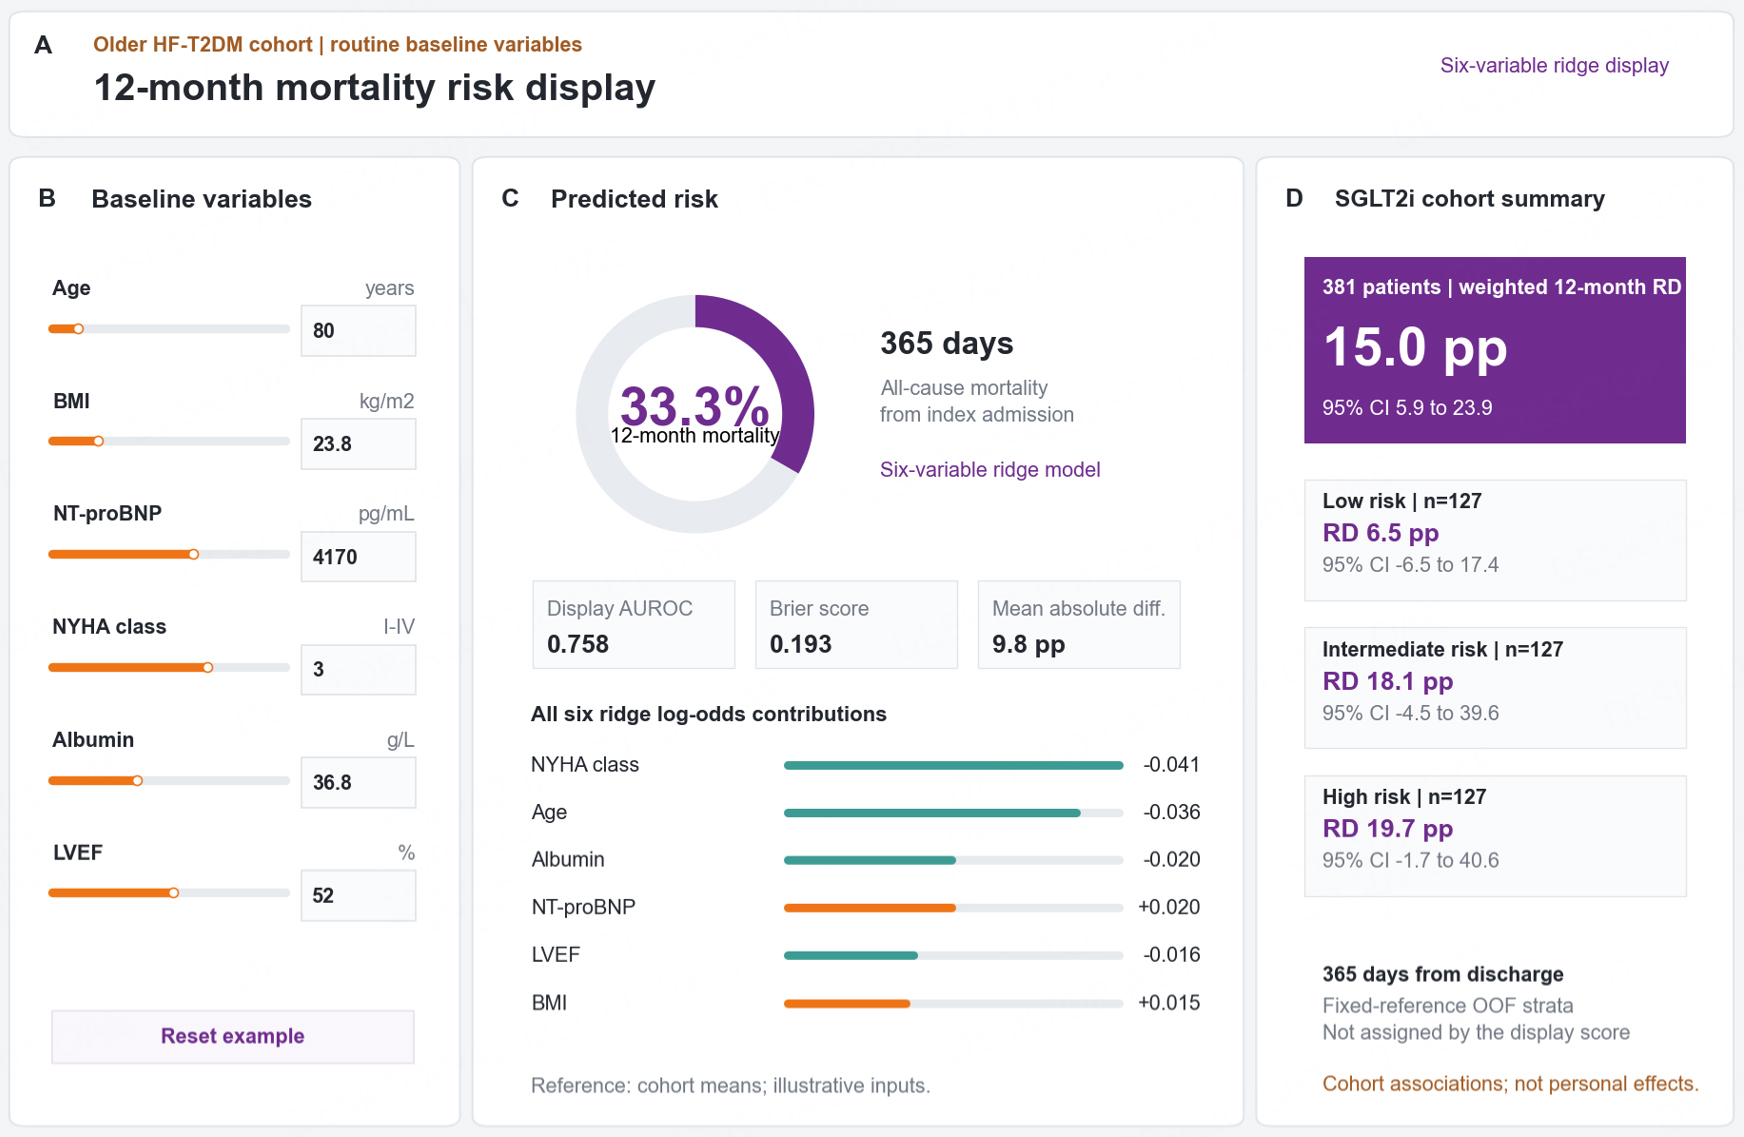
Figure 5. Interactive six-variable mortality-risk display and adjusted cohort summary. Editable schematic rendering of the digital interface. (A) Target population and six-variable ridge-model context. (B) Age, BMI, NT-proBNP, NYHA functional class, albumin and LVEF inputs. (C) Illustrative 365-day admission-origin mortality estimate, held-out performance summaries and all six standardized log-odds contributions to the ridge model. Contributions are relative to cohort means and are distinct from full-reference permutation importance. Mean absolute difference refers to surrogate vs. fixed-reference probabilities. (D) Overall and risk-stratified overlap-weighted 12-month post-discharge mortality differences from the 381-patient cohort, with 95% confidence intervals. Those strata use fixed-reference out-of-sample scores and are not assigned by the illustrated six-variable prediction. The inputs are illustrative, not a patient record; cohort treatment differences are not individual treatment-effect predictions. NYHA: New York Heart Association; BMI: body mass index; LVEF: left ventricular ejection fraction; NT-proBNP: N-terminal pro-B-type natriuretic peptide; AUROC: area under the receiver operating characteristic curve; OOF: out-of-fold; RD: non-user minus user mortality; CI: confidence interval; pp: percentage points; SGLT2i: sodium-glucose cotransporter 2 inhibitor.