

fig3
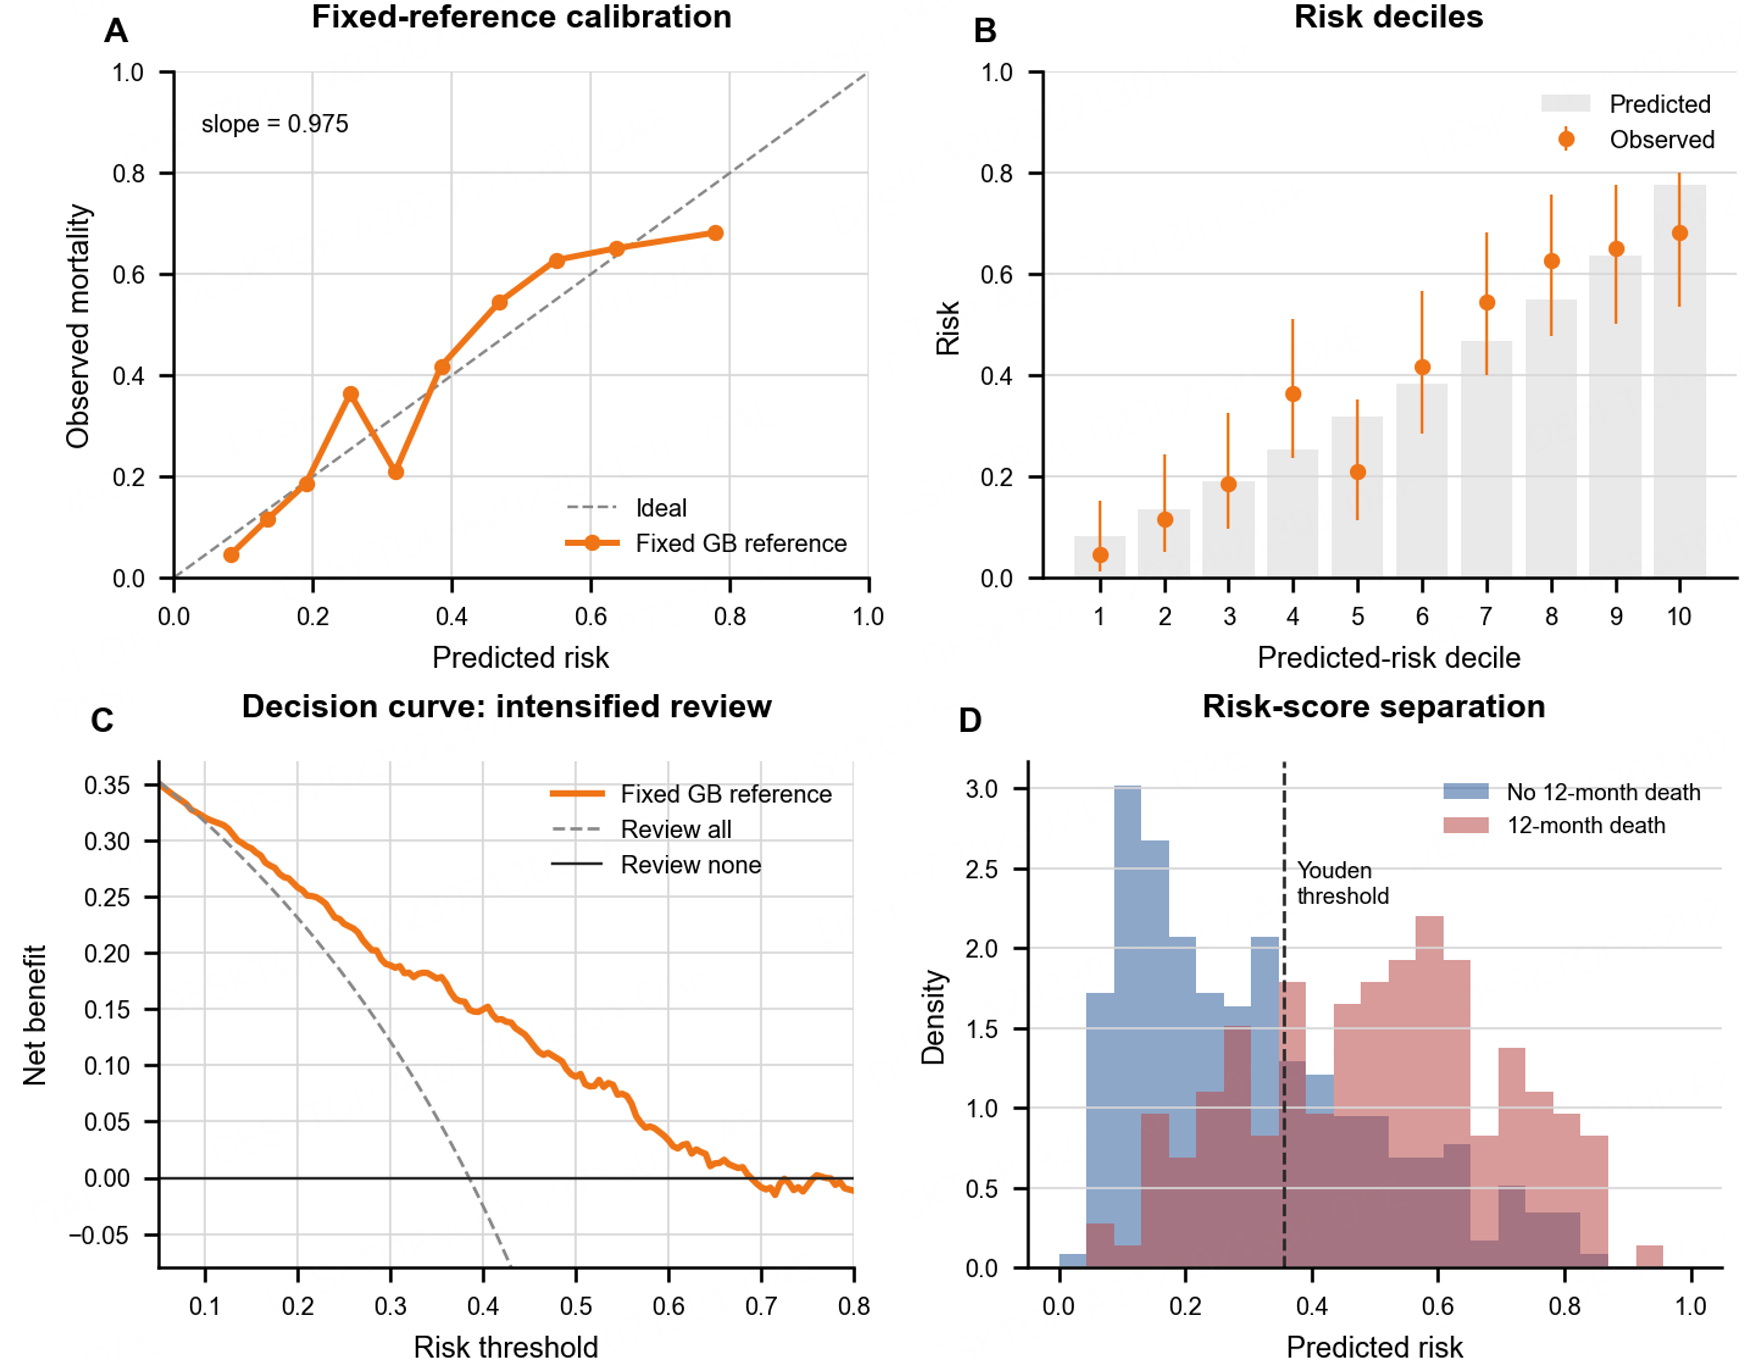
Figure 3. Calibration, decision utility and risk separation of the fixed gradient-boosting reference model. (A) Calibration curve; the dashed line denotes ideal calibration. (B) Mean predicted risk and observed mortality by predicted-risk decile; error bars show Wilson 95% confidence intervals. (C) Decision-curve analysis of hypothetical intensified review or follow-up, comparing the fixed reference with review-all and review-none strategies over thresholds of 0.05-0.80. This is a descriptive display range, not a validated intervention cutoff. (D) Risk distributions among patients with and without death within 365 days of admission; the dashed vertical line marks the descriptive maximum-Youden-index threshold. N = 434, including 167 deaths. Panels use each patient’s averaged held-out probability. Density is not a patient count. These fixed-reference plots are separate from the principal nested-workflow estimates in Table 2. GB: Gradient boosting.