

fig2
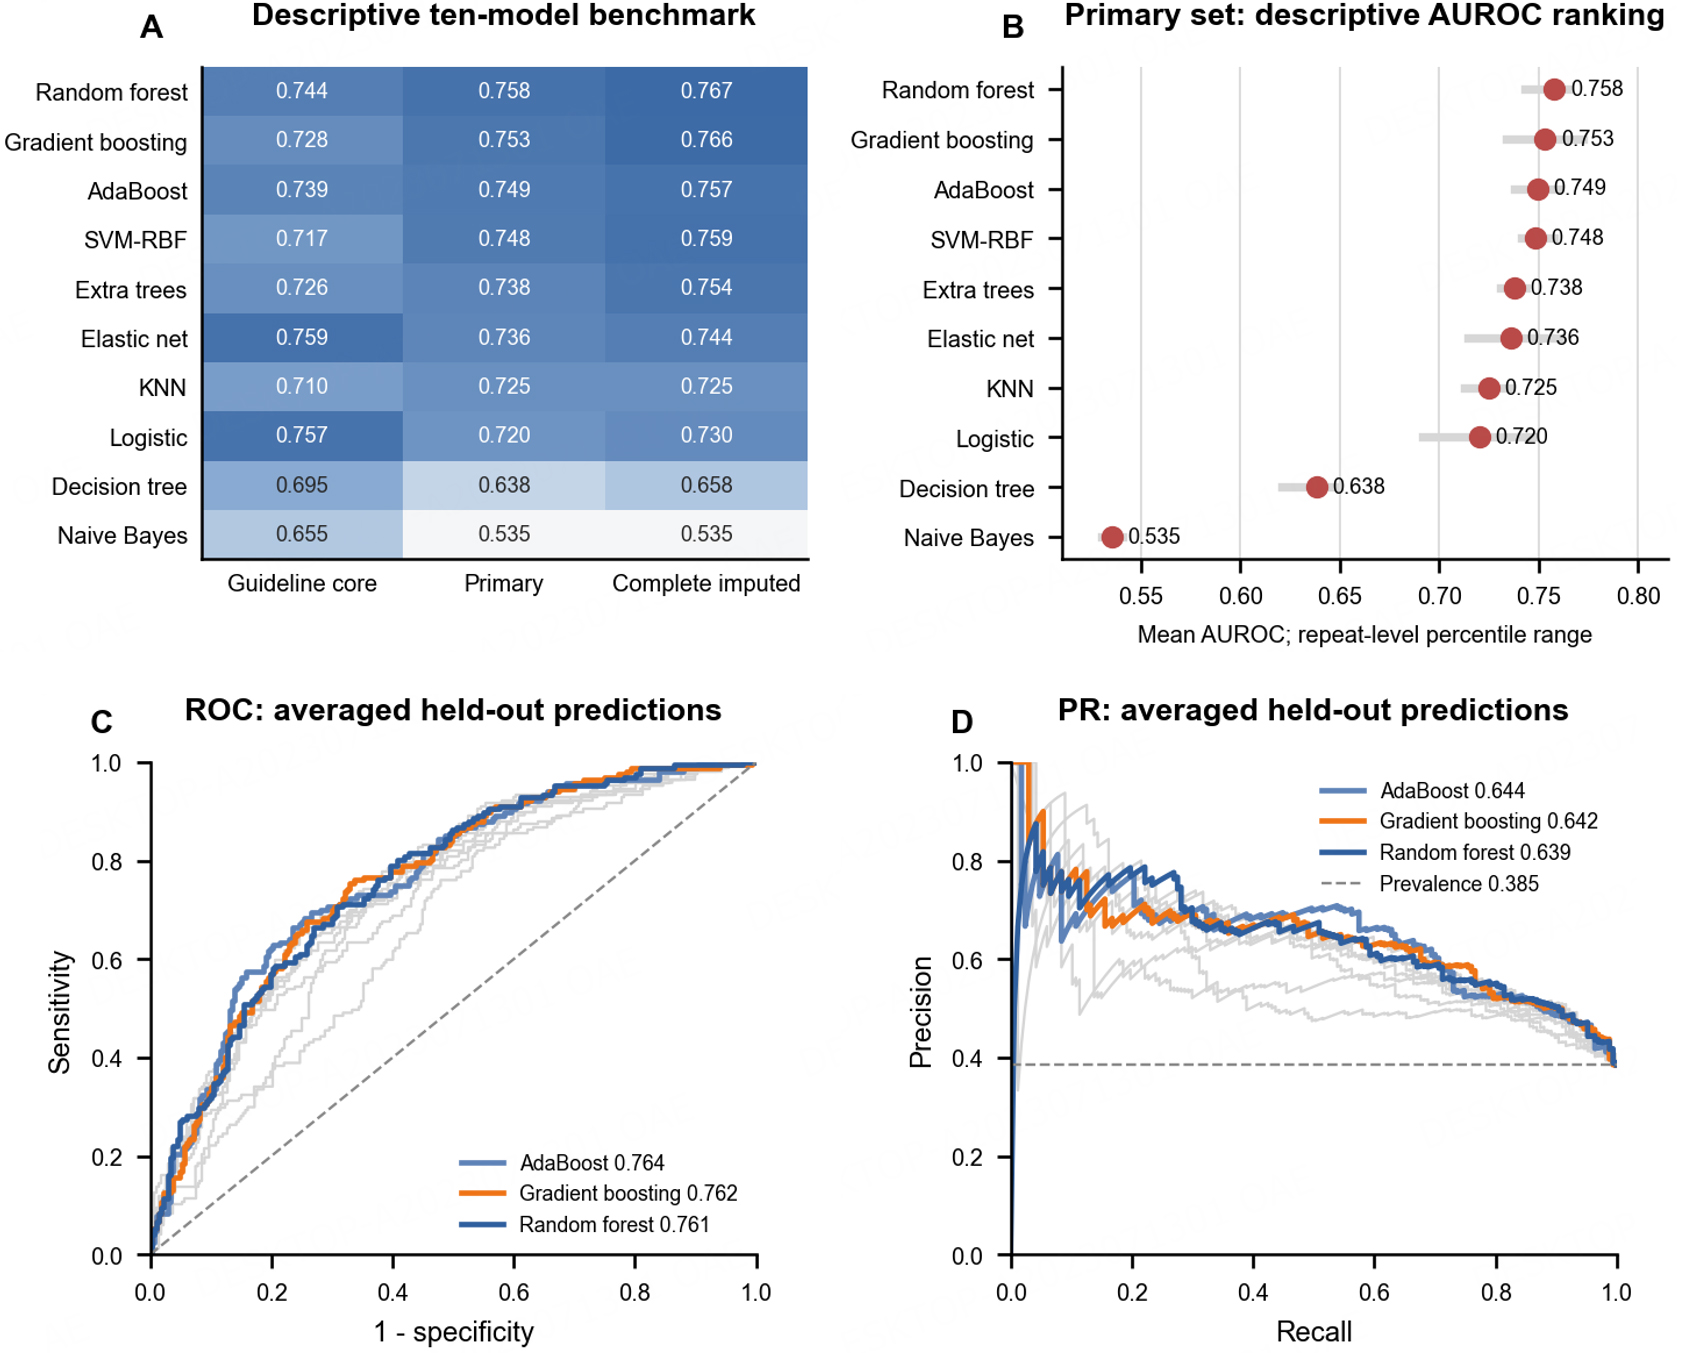
Figure 2. Comparison of ten algorithms across three feature sets. (A) Mean AUROC for each algorithm-feature-set combination across repeated five-fold cross-validation. (B) AUROC ranking within the primary analysis feature set; points show the repeat-level mean and horizontal lines show the 2.5-97.5th percentile range. (C) Receiver operating characteristic curves from stored out-of-fold predictions for the leading models. (D) Precision-recall curves for the same models; the dashed horizontal line indicates the event prevalence. The displayed percentile ranges across five repeats are not confidence intervals. Curves use averaged patient-held-out probabilities. Core: guideline-informed 7-variable comparator; Primary: 51-variable analysis roster; Complete imputed: 58-variable roster, completed within training folds. AUROC: area under the receiver operating characteristic curve; SVM-RBF: radial-basis support vector machine; KNN: k-nearest neighbors.