


fig2
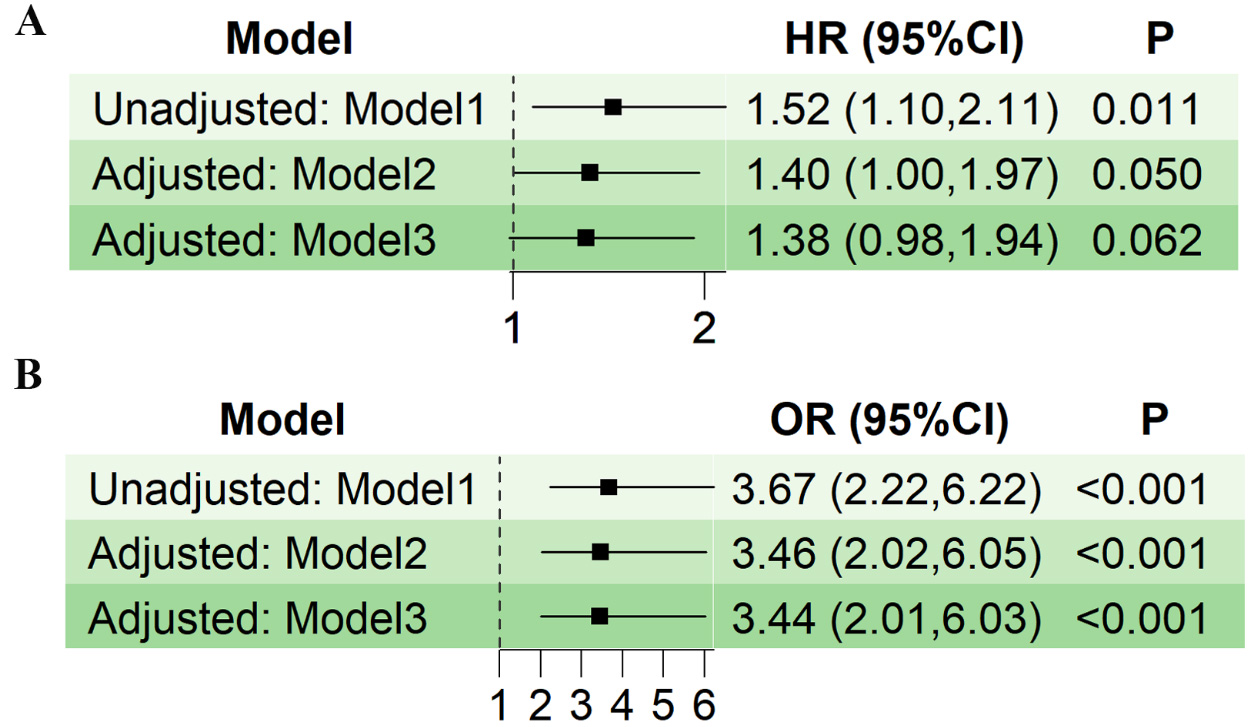
Figure 2. Forest plots comparing outcomes between fulminant and non-fulminant myocarditis using progressively adjusted models. Model 1 shows unadjusted associations, Model 2 adjusts for age and sex, and Model 3 additionally incorporates time from symptom onset to hospitalization. Analyses employed marginal effect Cox regression (for time-to-event outcomes) and logistic regression (for binary endpoints), with robust variance estimation to account for study-level clustering. Results are presented as hazard ratio (HR) or odds ratio (OR) with 95% confidence interval (CI). (A) The primary outcome is examined in the entirety of the patient population; (B) The secondary outcome is evaluated in the entirety of the patient population.


