

fig1
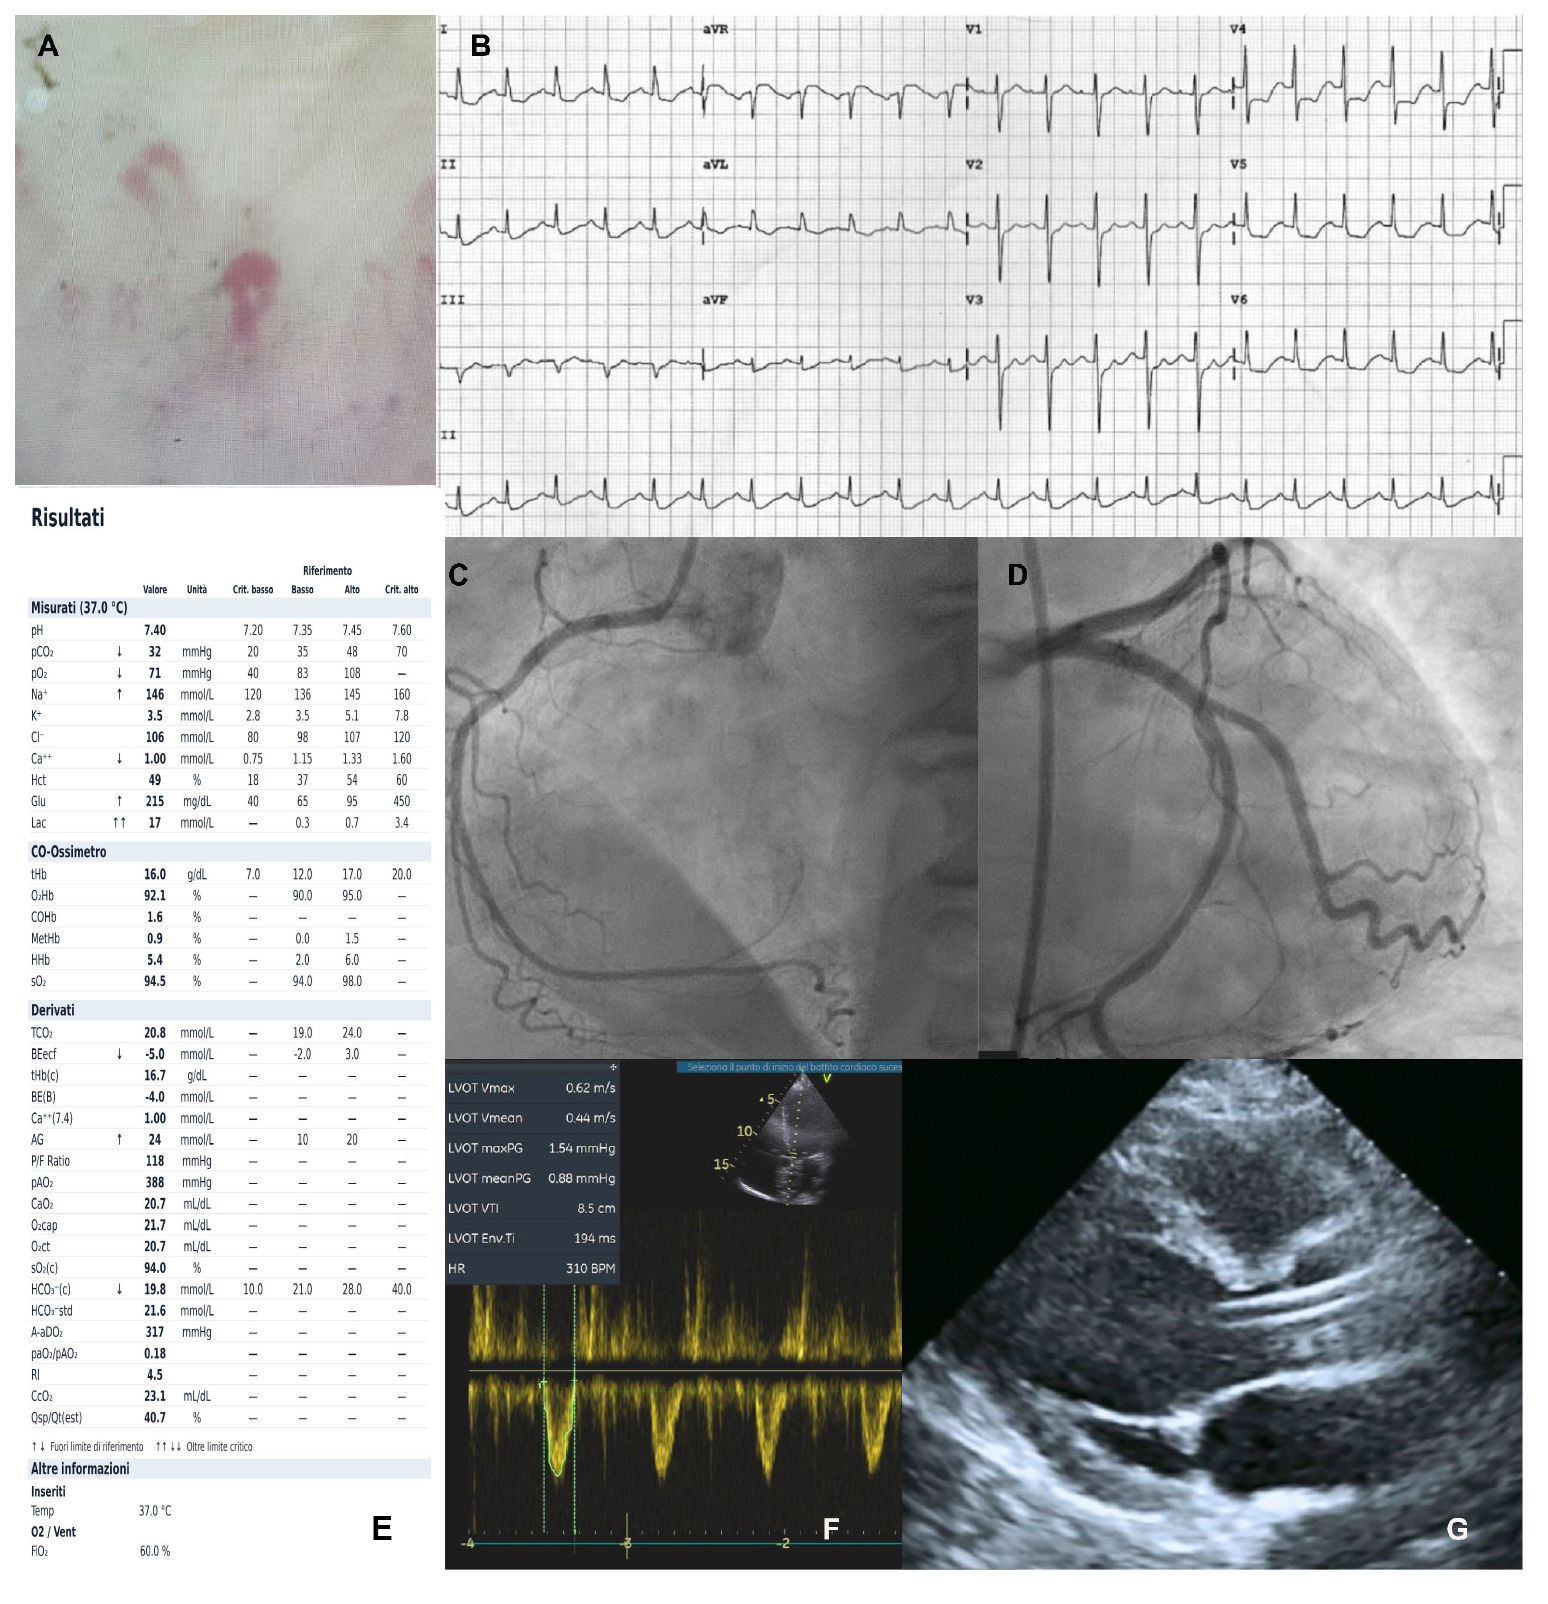
Figure 1. (A) Capillaroscopy showing a scleroderma-like pattern. (B) ECG demonstrating sinus tachycardia and ST-segment depression in the inferior and lateral leads. (C and D) Coronary angiography revealing no significant coronary artery disease. (E) Arterial blood gas (ABG) analysis during cardiogenic shock showing elevated lactate levels. (F) Pulsed-wave Doppler in the acute phase of cardiogenic shock, demonstrating a low cardiac output state with a LVOT VTI of 8 cm. (G) TTE parasternal long-axis view during mechanical circulatory support with ECMO and Impella.