


fig3
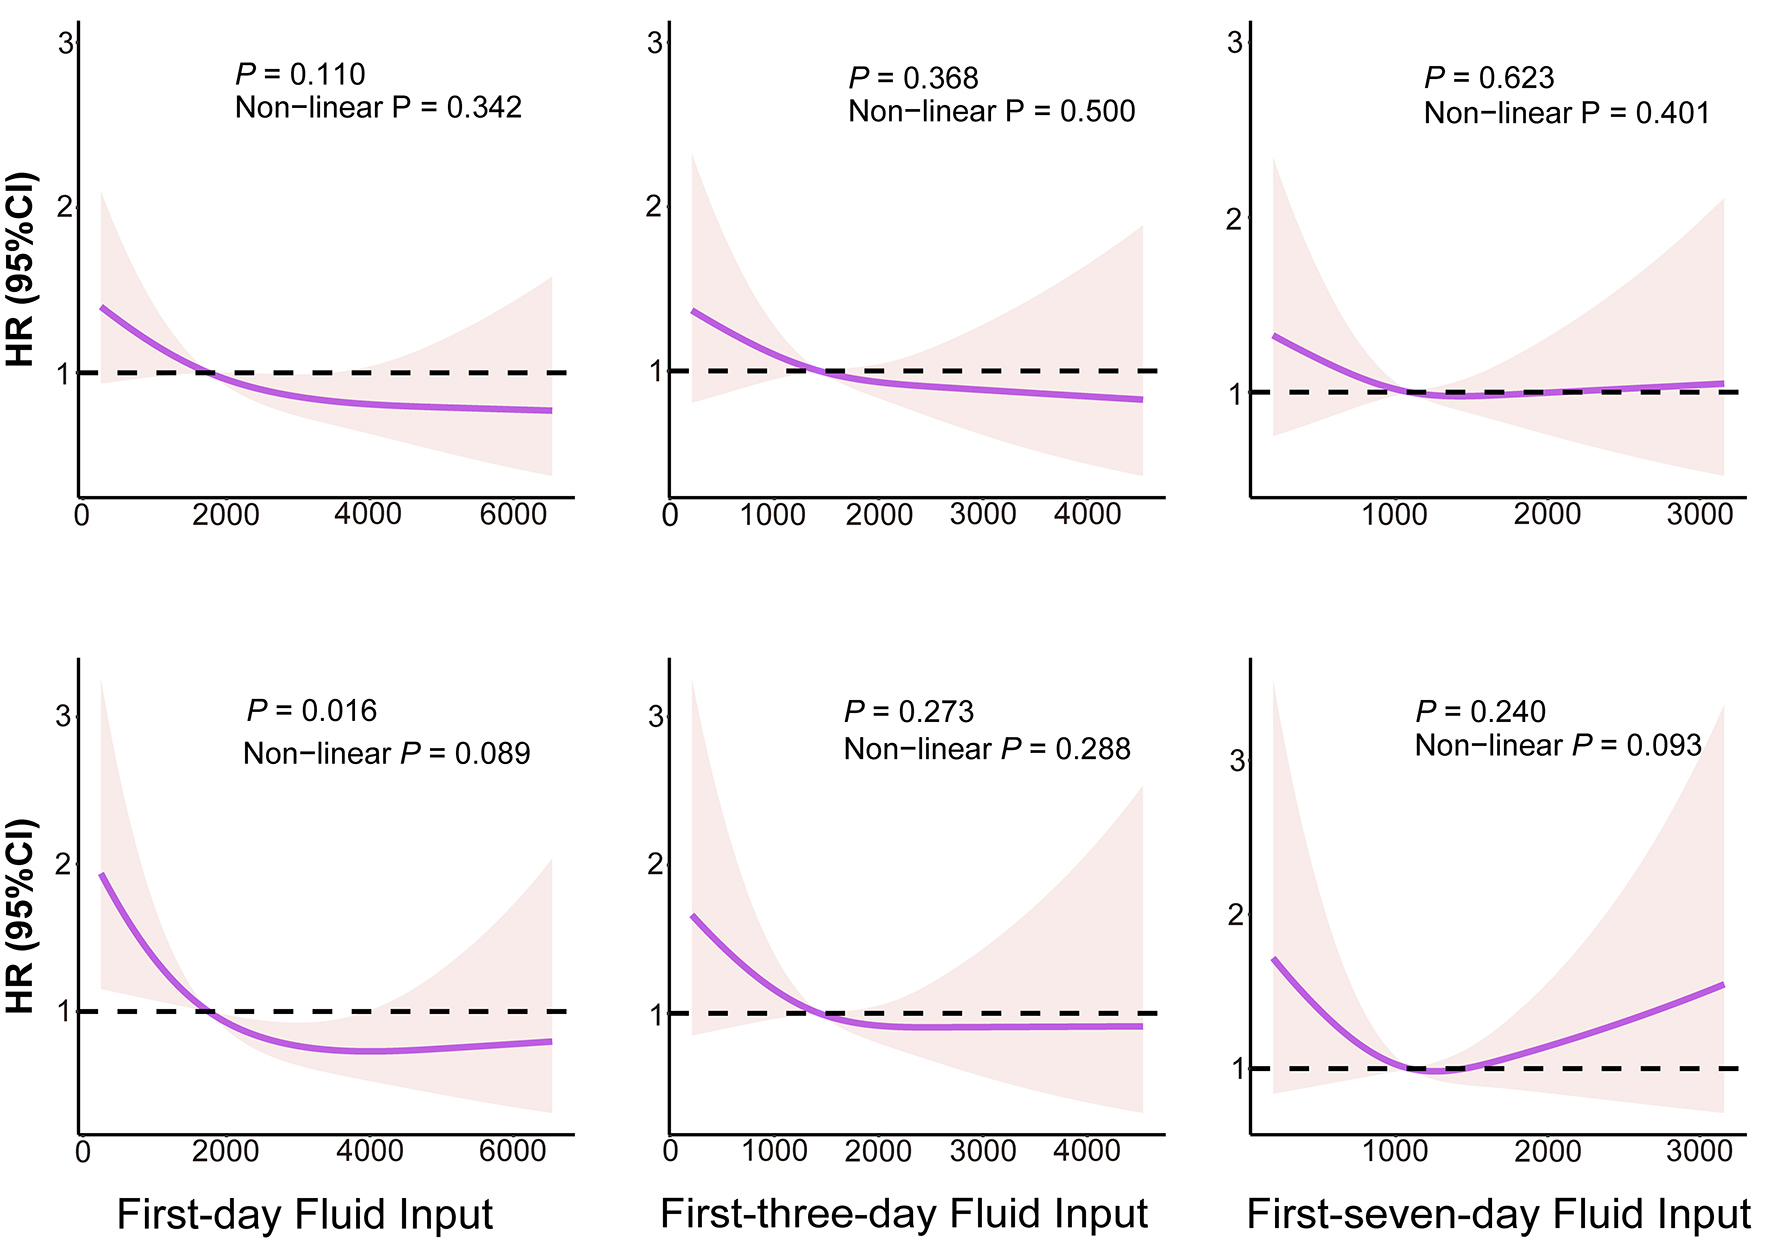
Figure 3. Exposure-response associations between F1, F3 or F7 and mortality risk in RVMI participants. Figures in the top row show the associations of F1, F3, and F7 with all-cause mortality, whereas figures in the bottom row show the associations of F1, F3, and F7 with cardiac mortality. HR: Hazard ratio; CI: confidence interval; F1: first-day fluid input; F3: first-three-day fluid input; F7: first-seven-day fluid input. P for non-linearity was calculated by likelihood ratio tests (LRTs).


