


Association between fluid input and mortality in patients with acute right ventricular myocardial infarction
 0
0  ,
, Abstract
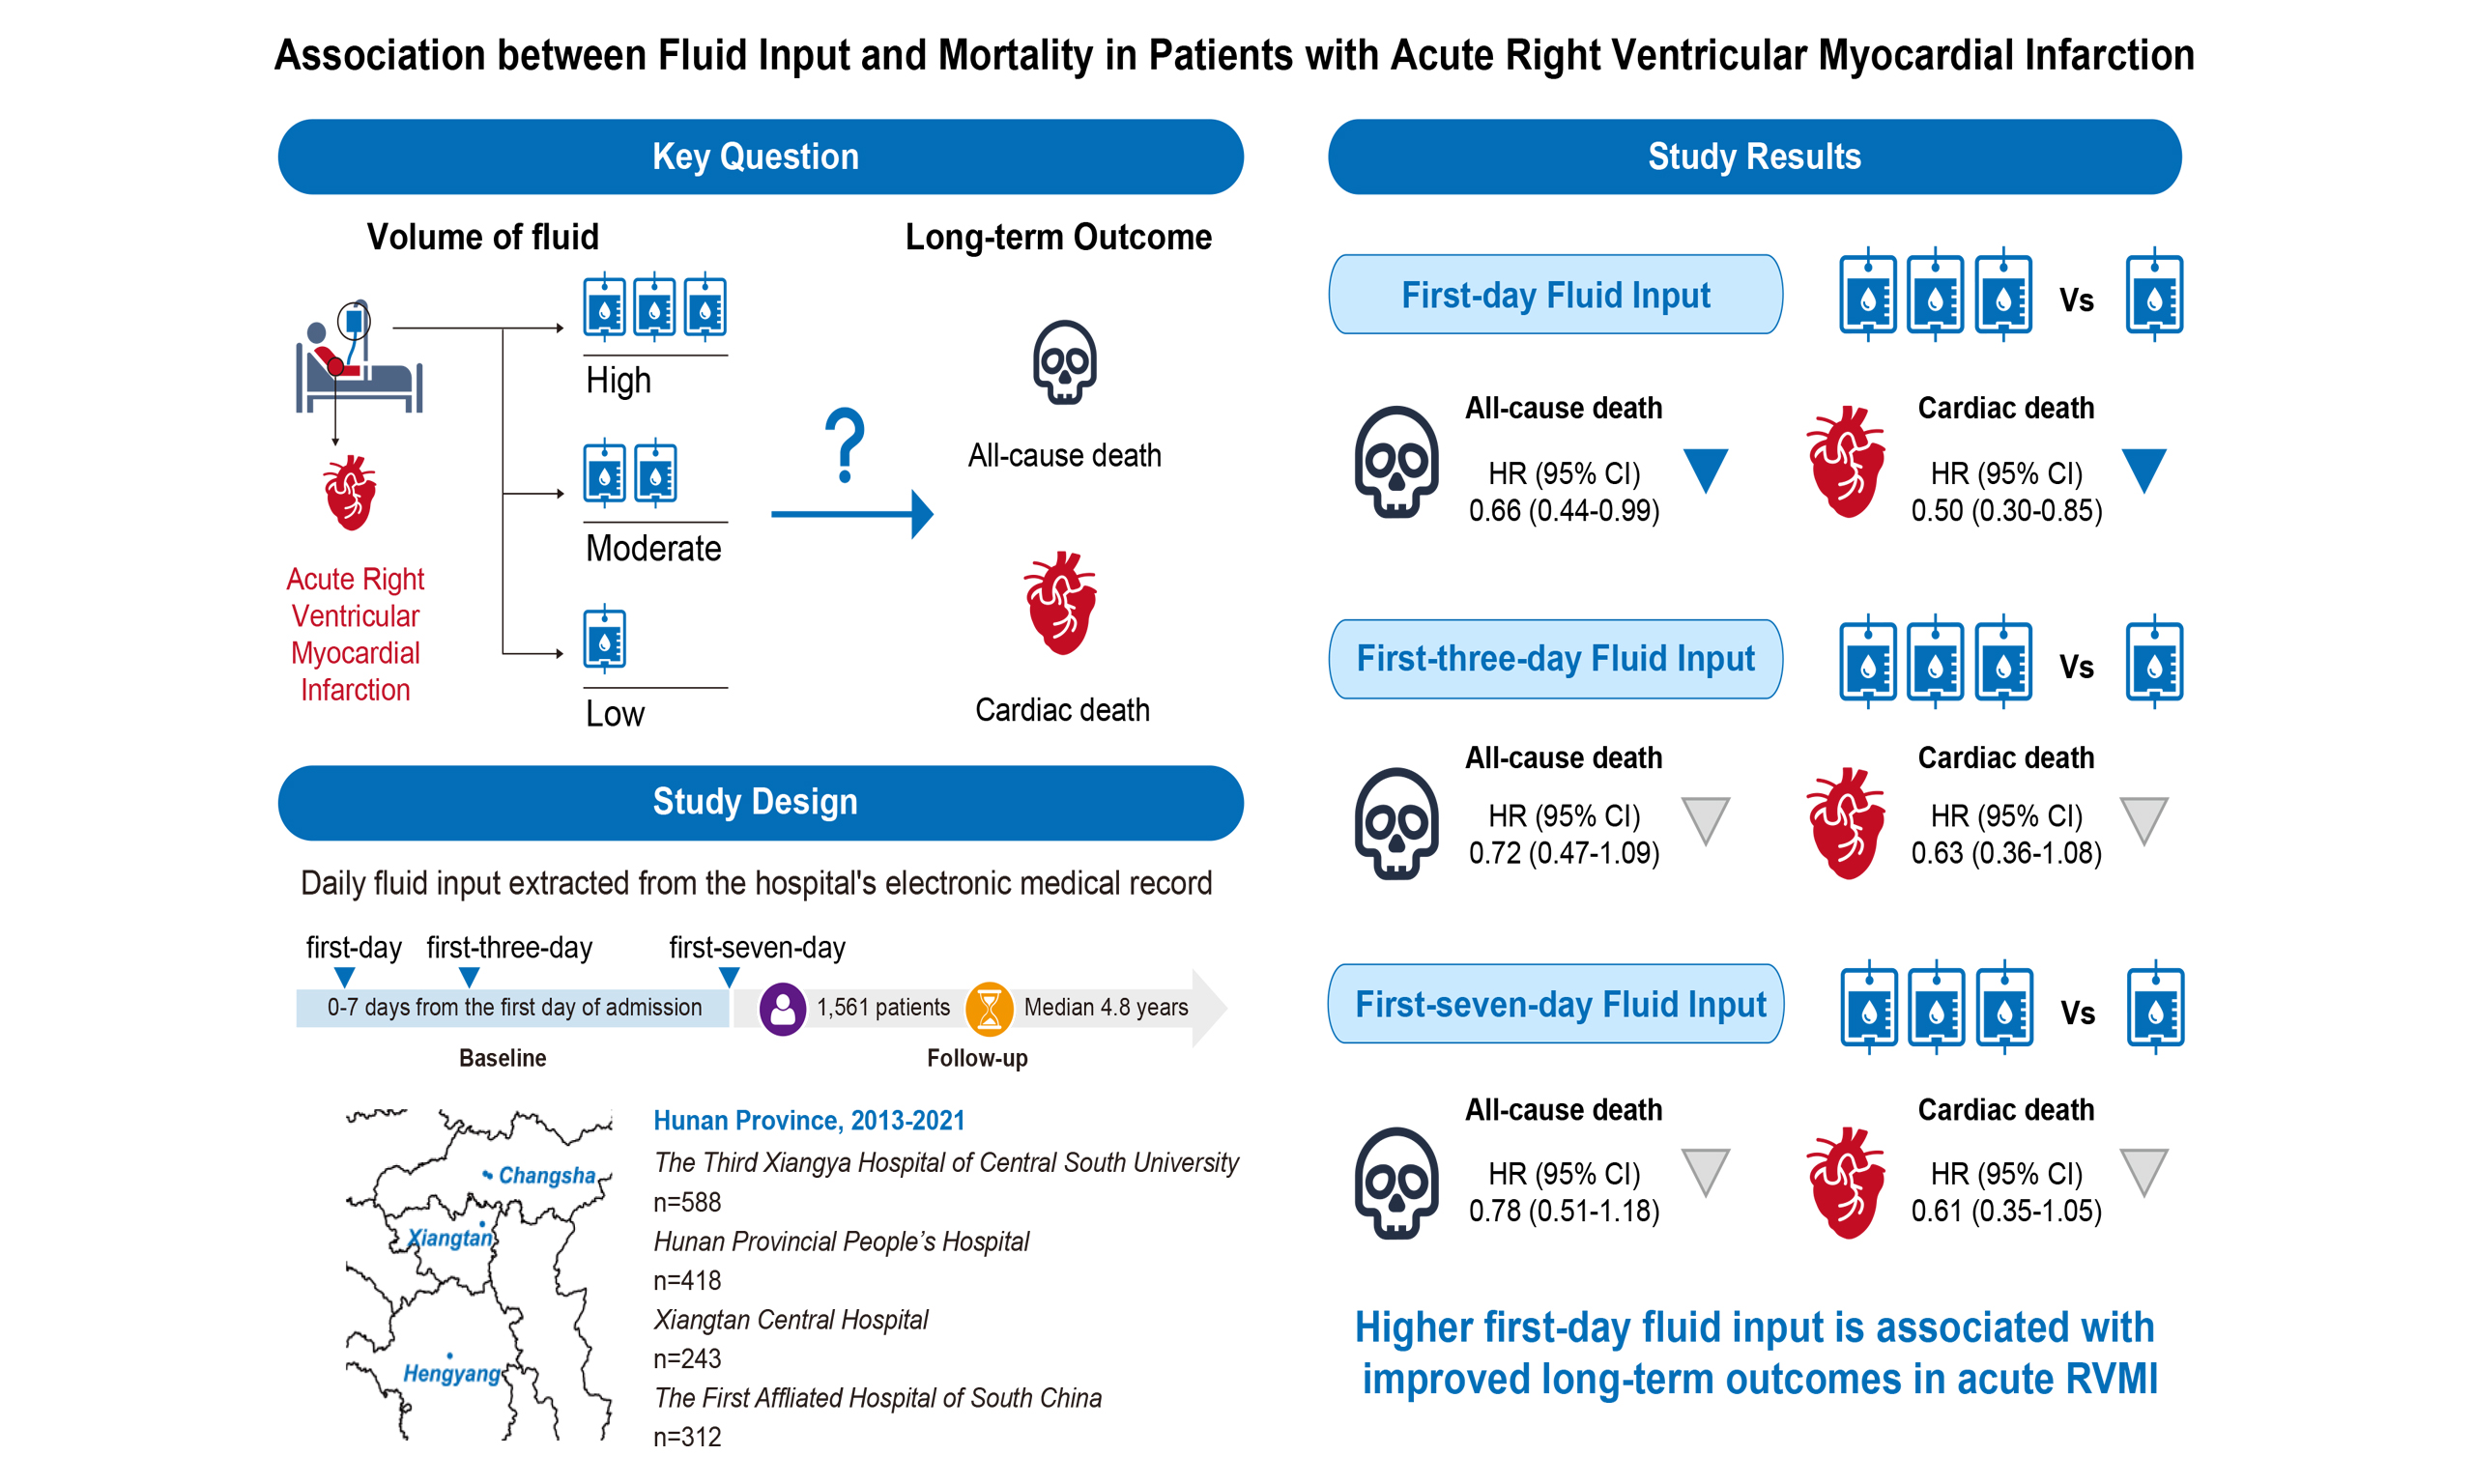
Aim: To investigate the association between fluid input volume and long-term outcomes, including all-cause mortality, cardiac mortality, and in-hospital hypotension, in patients with right ventricular myocardial infarction (RVMI).
Methods: This retrospective multicenter study included 1,561 patients with RVMI from four hospitals between 1 January 2013 and 30 June 2021. Fluid input volume was assessed on the first day and as the average over 3 and 7 days. Cox proportional hazards models were used to evaluate associations with all-cause mortality, cardiac mortality, and in-hospital hypotension.
Results: The median follow-up was 4.8 years (interquartile range: 2.7-6.4). We found a significantly lower all-cause mortality risk with higher first-day fluid input (median tertile hazard ratio (HR): 0.64, 95% confidence interval (CI): 0.44-0.94; highest tertile HR: 0.66, 95%CI: 0.44-0.99) compared with the lowest input tertile. Similar reductions were observed for cardiac mortality (median tertile HR: 0.52, 95%CI: 0.31-0.85; highest tertile HR: 0.50, 95%CI: 0.30-0.85). However, average fluid input over three or seven days was not associated with long-term mortality risk. Higher first-day input was associated with reduced in-hospital hypotension risk (HR: 0.68, 95%CI: 0.46-1.00; P = 0.049) after confounder adjustment.
Conclusion: Sufficient early fluid input is associated with improved long-term outcomes (all-cause and cardiac mortality) and lower in-hospital hypotension risk in patients with RVMI.
Keywords
INTRODUCTION
Recent advances in ischemic heart disease management have reduced the mortality rate, but the number of deaths continues to rise, especially in developing countries[1]. Current research has found that when an acute myocardial infarction involves the right ventricle, patients' overall mortality risk increases by two to threefold[2]. Right ventricular myocardial infarction (RVMI) may reduce left ventricular preload and decrease cardiac output[3]. Therefore, maintaining an appropriate cardiac output is a key clinical challenge in the management of RVMI.
In this scenario, fluid resuscitation to increase blood volume and right ventricular preload is a logical intervention. Increasing right ventricular preload through the Frank-Starling mechanism can boost right ventricular output, thereby increasing left ventricular preload and maintaining cardiac output to support blood pressure. An animal study demonstrated that increasing volume loading in dogs with experimental RVMI increased cardiac output[4]. Similarly, in a clinical study, 25 patients with RVMI were observed to have higher left and right ventricular filling pressures and cardiac index after receiving 1,000-1,500 mL of intravenous rehydration[5]. Another study also reported the therapeutic effect of intravenous rehydration in RVMI[6]. According to the European Society of Cardiology guidelines for acute right heart failure management, volume loading is considered an optional intervention in patients with low blood pressure and normal central venous pressure[7]. However, the available evidence also suggests heterogeneity in the effects of fluid resuscitation. Current guidelines and expert consensus generally recommend that prompt consideration of fluid administration in patients with RVMI who exhibit hypotension or hypoperfusion suggestive of inadequate right ventricular preload, provided there is no clear evidence of pulmonary congestion or volume overload. In clinical practice, these abnormalities commonly occur on the first hospital day, particularly within the first few hours after admission; accordingly, fluid resuscitation is usually implemented early in the acute phase. Nevertheless, some studies have reported that volume loading does not improve cardiac output in patients with RVMI and that excessive fluid administration may reduce cardiac output by causing right ventricular overdistension[8,9]. Therefore, current evidence remains insufficient to determine whether fluid resuscitation improves outcomes in patients with RVMI, particularly long-term outcomes.
In this retrospective cohort study, we examined the association between fluid resuscitation in the acute phase after RVMI and long-term outcomes, including all-cause and cardiac mortality. Moreover, the association between different rehydration strategies and in-hospital hypotension was also analyzed.
METHODS
Study design and oversight
This retrospective cohort study included 1,729 consecutive patients with RVMI and inferior wall myocardial dysfunction who were treated between January 1st, 2013, and June 30th, 2021. The cohort comprised 629 patients from the Third Xiangya Hospital of Central South University, 359 patients from The First Affiliated Hospital of the University of South China, 304 from Xiangtan Central Hospital, and 437 from Hunan Provincial People’s Hospital. Acute myocardial infarction was defined using the International Classification of Diseases (ICD) codes (ICD 9: 410-411; ICD 10: I21-24). To confirm RVMI, we included only patients with documented 18-lead ECG and coronary angiography findings. RVMI was diagnosed by experienced clinicians on the basis of combined 18-lead clinical electrocardiogram (ECG) and coronary angiography. This study complied with the ethical guidelines of the 1975 Declaration of Helsinki. The study protocol was approved by the Third Xiangya Hospital of Central South University ethics committee (No. 2019-S489) and by the corresponding ethics committee of each collaborating hospital. The requirement for informed consent was waived because the study posed minimal risk to participants, and data anonymization procedures have been implemented to safeguard participant privacy.
For the long-term outcomes analysis, patients meeting any of the following criteria were excluded: age ≤ 18 years or ≥ 90 years; hospital stay < 24 h; no recorded fluid input on the first hospital day; severe renal impairment (estimated glomerular filtration rate (eGFR)< 15 mL/min); severe hepatic impairment (Alanine Transaminase > 400 U/L); active malignancy; active infection; autoimmune diseases; or trauma [Figure 1]. A total of 1,561 patients were included in the analysis. To analyze the association between first-day fluid input volume and the risk of hypotension during hospitalization, we further excluded patients who developed hypotension on admission or on the first day after admission, resulting in 1,061 participants included in this analysis [Figure 1].
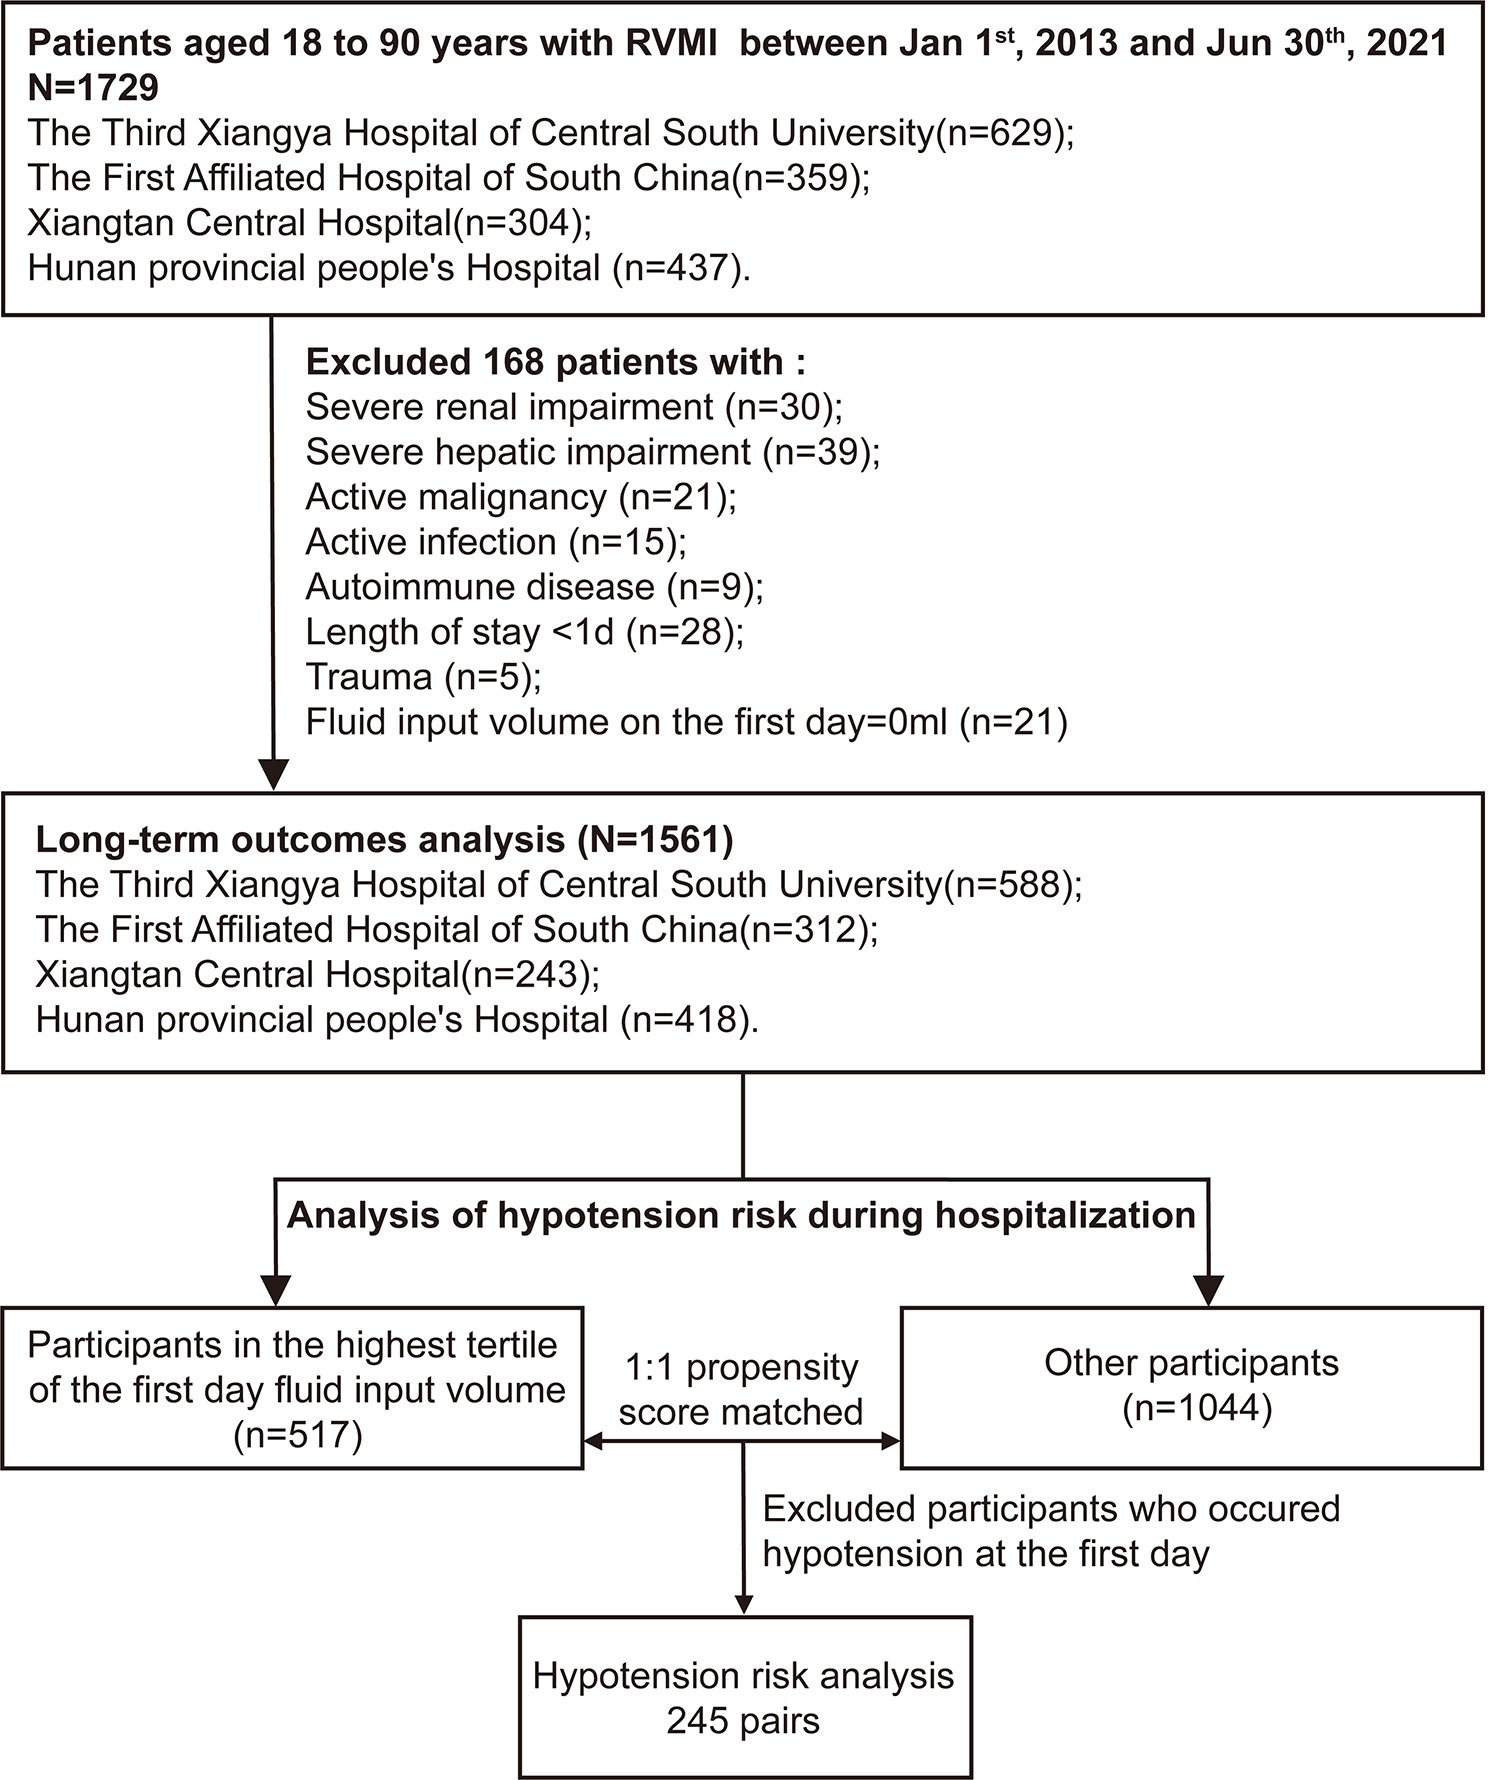
Figure 1. Flow chart of patient recruitment for this study.
Calculation of fluid input volume
Daily fluid input is defined as the sum of intravenous and oral fluid intake, as recorded in the hospital's electronic medical record. Daily fluid input was collected from the first day of admission through hospital day 7. If a patient was hospitalized for less than 7 days, daily fluid input was calculated from the day of admission to the day of discharge. The daily fluid input was calculated independently by two investigators, and any discrepancies were resolved by a third dedicated person. Patients were divided into F1-T1, F1-T2, and F1-T3 groups, from the lowest to the highest tertile, based on their first-day fluid input. When patients were classified into tertiles based on fluid input over the first three days, the groups were labeled F3-T1, F3-T2, and F3-T3, from lowest to highest tertile. Patients were similarly grouped into tertiles based on the fluid input over the first seven days: F7-T1, F7-T2, and F7-T3.
Clinical assessments
The demographic and clinical characteristics, medical history, laboratory test results, examination findings, and treatment during hospitalization were extracted from the electronic medical record system. The demographic and clinical characteristics included sex, age, smoking status, insurance status, body mass index (BMI), heart rate (HR), systolic blood pressure (SBP), diastolic blood pressure (DBP), and presenting symptoms (chest pain, chest stuffiness, shortness of breath, cardiogenic shock, Killip classification, and syncope). Smoking status and medical history were self-reported upon admission. Blood pressure, heart rate, and BMI were measured at admission. Medical history, including diabetes, hypertension, stroke, chronic heart failure, angina pectoris, and chronic obstructive pulmonary disease (COPD) or asthma, was self-reported at admission. The laboratory test results include hemoglobin (Hb), white blood cell (WBC), platelet count (PLT), cardiac troponin I (cTnI), fasting blood glucose (FBG), alanine transaminase (ALT), low-density lipoprotein cholesterol (LDL-C), creatinine (Cr), and serum potassium. All laboratory findings were obtained from the first examination after admission. Examinations included electrocardiography and echocardiography.
We also collected information on the main in-hospital interventions, including drugs (angiotensin-converting enzyme inhibitors [ACEIs] or angiotensin receptor blockers [ARBs], β-blockers, calcium channel blockers [CCBs], statins, aspirin, clopidogrel, ticagrelor, intravenous nitrates, and inotropes) and coronary revascularization.
Additionally, eGFR was calculated using the first available serum creatinine measured after admission with the 2021 Chronic Kidney Disease Epidemiology Collaboration (CKD-EPI) equation. Concomitant left-sided heart failure was defined as left ventricular ejection fraction (LVEF) < 50%.
Missing data and imputation
A total of 42 variables were used as covariates in this study. The average missing rate of these variables was 1.92%. Missing data were imputed using a random forest method based on the R package "randomForest".
Outcomes
In the analysis of long-term outcomes, the primary outcome was all-cause death before the end of the follow-up. The secondary outcome was cardiac death, which includes myocardial infarction-induced death, heart failure-induced death, and malignant arrhythmia-induced death. Survival status and primary cause of death for patients were acquired from the National Center for Disease Control and Prevention and further verified by telephone follow-up.
Hypotension in the in-hospital hypotension analysis was defined as SBP < 90 mmHg, DBP < 60 mmHg, or in-hospital use of vasopressors. Vasopressors included metaraminol, dopamine, norepinephrine, epinephrine, and dobutamine. Information on in-hospital hypotension, as diagnosed by professional doctors, was extracted from the electronic medical record.
Statistical analysis
Median and interquartile ranges (IQRs) were used to describe continuous variables, and numbers and percentages were used to describe categorical variables. The Kruskal-Wallis test was used to assess differences in continuous variables across patients with different fluid input volumes. Chi-square tests were used to compare categorical variables.
Cox proportional hazards models were used to examine the association between long-term mortality and fluid input volume. We fitted independent models for different outcomes and fluid input volumes across different periods. The covariables of the model include gender, age, BMI, smoking status, insurance, hazard ratio (HR), FBG, LDL-C, cTnI, N-terminal pro b-type natriuretic peptide (NT-proBNP), SBP, DBP, eGFR, concomitant left-sided heart failure, multivessel coronary lesions, Killip classification, cardiogenic shock on admission, coronary revascularization, statins, inotropes, hypotensive drugs (ACEIs or ARBs, CCBs, and β-blockers), anti-platelet medications (aspirin, clopidogrel, and ticagrelor) and medical history (diabetes, hypertension, stroke, chronic heart failure, angina pectoris, and COPD or asthma). P values for covariates in the Cox proportional hazards models, including all sensitivity analyses, were calculated using Wald tests (two-sided, based on z statistics from the estimated regression coefficients and their standard errors). The cumulative death rates were compared using the Kaplan-Meier method.
Based on the findings of long-term outcomes analysis, we further explored the association between the first-day fluid input and the incidence of in-hospital hypotension in patients with RVMI. We conducted propensity score matching to reduce confounding between participants with high and low fluid intake. The high-volume of fluid input group was defined as patients in the highest tertile of fluid input volume on the first day (i.e., F1-T3). Other patients (i.e., F1-T1 and F1-T2) were classified as the low-volume fluid input group [Figure 1]. Two groups were matched on propensity scores using a caliper of 0.2 times the standard deviation of the propensity scores (0.035). The variables, including gender, age, BMI, smoking status, insurance, HR, FBG, LDL-C, cTnI, NT-proBNP, SBP, DBP, multivessel coronary lesions, Killip classification, coronary revascularization, statins, inotropes, hypotensive drugs (ACEIs or ARBs, CCBs, and β-blockers), anti-platelet medications (aspirin, clopidogrel, and ticagrelor), and medical history (diabetes, hypertension, stroke, chronic heart failure, angina pectoris, and COPD or asthma), were used to construct propensity scores. The matching ratio was 1:1. Group differences in variables after matching were assessed using standardized mean differences (SMDs). A variable with an SMD less than 0.1 was considered undifferentiated between the two groups. Cox models were employed to explore the association between first-day fluid input volume and hypotension during hospitalization.
Subgroup analysis
Stratified analyses were performed to evaluate potential effect modification by baseline characteristics, including sex (female, male), age (≤ 65 years, > 65 years), BMI (≤ 24 kg/m2, > 24 kg/m2), smoking status, NT-proBNP quintile groups (≤ 80, 80-221, 221-459, 459-1,006, ≥ 1,006), diabetes, hypertension, stroke, cardiogenic shock, COPD, Killip classification, multivessel lesions, chronic heart failure, and revascularization. Within each subgroup, Cox proportional hazards regression models were used to estimate HRs and 95% confidence intervals (CIs) for the associations between the fluid input on the first day, over the first three days, or over the first seven days and all-cause death and cardiovascular death. Differences in effects across subgroups were formally tested using likelihood ratio tests that included interaction terms between the stratification variables and the medians of fluid input on the first day, over the first three days, or over the first seven days. P for interaction was calculated using the Wald test for the interaction terms.
Sensitivity analysis
To evaluate the robustness of the relationship between fluid input volume and all-cause and cardiac mortality, we performed five sensitivity analyses. In the first analysis, we additionally adjusted for ventricular internal diameters (left and right ventricular end-diastolic diameters), comorbid arrhythmias (atrial fibrillation, atrioventricular block, bundle branch block, and bradycardia), the use of nitroglycerin or isosorbide mononitrate, and other laboratory markers (ALT, PLT, Cr, Hb, and serum potassium) when examining the association between rehydration volume and long-term outcomes. The second analysis involved a mixed-effects Cox model, incorporating the patient’s in-hospital coronary revascularization status and Killip classification as random effects. This model was adjusted for variables including sex, age, BMI, smoking status, medical insurance, HR, FBG, LDL-C, cTnI, NT-proBNP, SBP, DBP, eGFR, presence of left-sided heart failure, cardiogenic shock at admission, multivessel lesions, use of hypotensive drugs (ACEIs or ARBs, CCBs, β-blockers), anti-platelet agents (aspirin, clopidogrel, ticagrelor), other medications (inotropes and statins), and medical history (diabetes, hypertension, stroke, chronic heart failure, angina pectoris, COPD or asthma). In the third analysis, we limited the model to baseline confounders by excluding post-admission treatments such as ACE inhibitors or ARBs, β-blockers, CCBs, statins, aspirin, clopidogrel, ticagrelor, intravenous nitrates, inotropes, and coronary revascularization status. We then refitted Cox proportional hazards models to assess the relationship between fluid input during the first day and the average fluid input over the first 3 days and first 7 days with all-cause and cardiovascular mortality. The fourth analysis aimed to enhance comparability in baseline management and reduce potential bias from post-admission treatments. It involved analyzing a restricted cohort excluding all patients who received therapies such as ACEIs or ARBs, β-blockers, CCBs, statins, aspirin, clopidogrel, ticagrelor, intravenous nitrates, and inotropes, as well as those who underwent coronary revascularization. Within this cohort, Cox models were used to examine the associations between fluid input during the first day, over the first 3 days, and over the first 7 days and mortality outcomes. The fifth analysis used a complete-case approach, including only participants with complete data for treatment variables such as ACEIs or ARBs, β-blockers, CCBs, statins, aspirin, clopidogrel, ticagrelor, intravenous nitrates, inotropes, and coronary revascularization status. Cox models were then refitted to evaluate the relationships between fluid input during these periods and all-cause or cardiovascular death.
All analyses were conducted in R version 4.2.0 (R Foundation for Statistical Computing, Vienna, Austria). A P-value of less than 0.05 was considered statistically significant.
RESULTS
Baseline characteristics and in-hospital treatment
A total of 1,561 patients were included in the final analysis. The median follow-up was 4.8 years (interquartile range (IQR): 2.7-6.4). These patients had a median age of 64 years (IQR: 54-71), and 76.5% were male. The median BMI was 23.8 kg/m2, and 55.8% were smokers. Hypertension (47.9%) and diabetes (22.7%) were the most prevalent comorbidities [Table 1]. Consistent with previous research, right dominance was the most common coronary vessel pattern (63.1%)[10]. However, compared with another study, a higher proportion of participants had balanced dominance (32.7%), with the lowest percentage being left-dominant (4.3%)[10]. In this study, 594 patients (44.6%) had multivessel coronary lesions. The incidence of cardiogenic shock at admission was 7.7% [Table 2].
Demographic and baseline characteristics of the patients by fluid input volume on the first day
| Parameters | Overall N = 1,561 | F1-T1 N = 521 | F1-T2 N = 523 | F1-T3 N = 517 | P-value | P for trend |
| Fluid input volume, median [IQR], mL | ||||||
| First day | 1,750 [806, 2,750] | 600 [400, 806] | 1,765 [1,500, 2,050] | 3,800 [2,750, 5,350] | < 0.001 | < 0.001 |
| Average volume for the first 3 days | 1,433 [926, 1,977] | 707 [483, 1,080] | 1,400 [1,150, 1,648] | 2,150 [1,733, 2,647] | < 0.001 | < 0.001 |
| Average volume for the first 7 days | 1,093 [733, 1,383] | 663 [452, 1,034] | 1,100 [875, 1,277] | 1,357 [1,126, 1,650] | < 0.001 | < 0.001 |
| Clinical characteristics on admission | ||||||
| Male, n (%) | 1,194 (76.5%) | 395 (75.8%) | 401 (76.7%) | 398 (77.0%) | 0.900 | 0.657 |
| Age, median [IQR], years | 64.0 [54.0, 71.0] | 64.0 [56.0, 71.0] | 64.0 [54.0, 72.0] | 64.0 [53.0, 71.0] | 0.656 | 0.448 |
| BMI, median [IQR], kg/m2 | 23.8 [22.4, 26.0] | 24.4 [22.6, 26.5] | 23.4 [22.0, 25.3] | 23.8 [22.5, 26.1] | 0.005 | 0.400 |
| Smoke, n (%) | 871 (55.8%) | 290 (55.7%) | 282 (53.9%) | 299 (57.8%) | 0.445 | 0.483 |
| HR, median [IQR], bpm | 75.0 [64.0, 85.0] | 75.0 [65.0, 86.0] | 75.0 [64.0, 85.0] | 74.0 [62.0, 84.0] | 0.199 | 0.072 |
| SBP, median [IQR], mmHg | 120.0 [105.0, 139.0] | 120.0 [108.0, 136.0] | 120.0 [106.0, 140.0] | 120.0 [101.0, 139.0] | 0.053 | 0.143 |
| DBP, median [IQR], mmHg | 73.0 [64.0, 82.0] | 75.0 [65.0, 82.0] | 74.0 [64.0, 82.0] | 72.0 [62.0, 81.0] | 0.041 | 0.025 |
| LDL-c, median [IQR], mmol/L | 2.6 [2.0, 3.1] | 2.6 [2.0, 3.1] | 2.7 [2.1, 3.2] | 2.5 [1.9, 3.0] | 0.006 | 0.078 |
| FBG, median [IQR], mmol/L | 6.6 [5.4, 8.4] | 6.0 [5.0, 7.8] | 6.7 [5.4, 8.4] | 7.0 [6.0, 8.9] | < 0.001 | < 0.001 |
| White blood cell, median [IQR], 109/L | 9.9 [8.0, 12.3] | 9.3 [7.5, 11.9] | 10.0 [8.0, 12.3] | 10.3 [8.5, 13.2] | < 0.001 | < 0.001 |
| Hemoglobin, median [IQR], g/L | 128.0 [117.0, 140.0] | 128.0 [115.0, 142.0] | 127.0 [117.0, 139.0] | 127.0 [117.0, 140.0] | 0.874 | 0.889 |
| Platelets count median [IQR], 109/L | 199.0 [164.0, 238.0] | 200.0 [169.0, 240.0] | 196.0 [157.0, 238.0] | 203.0 [163.0, 238.0] | 0.257 | 0.677 |
| Potassium, median [IQR], mmol/L | 4.0 [3.7, 4.3] | 4.0 [3.7, 4.3] | 4.0 [3.7, 4.3] | 4.0 [3.7, 4.4] | 0.494 | 0.390 |
| Cr, median [IQR], μmol/L | 82.0 [68.0-98.0] | 80.0 [68.0-99.0] | 82.0 [67.0-95.0] | 83.0 [69.0-101] | 0.176 | 0.189 |
| Coronary dominance, n (%) | < 0.001 | < 0.001 | ||||
| Balanced | 436 (32.7%) | 103 (23.6%) | 175 (36.8%) | 158 (37.3%) | ||
| Left coronary dominance | 57 (4.3%) | 19 (4.4%) | 23 (4.8%) | 15 (3.5%) | ||
| Right coronary dominance | 842 (63.1%) | 314 (72.0%) | 277 (58.3%) | 251 (59.2%) | ||
| Insurance, n (%) | < 0.001 | 0.01 | ||||
| None | 263 (16.9%) | 141 (27.2%) | 59 (11.3%) | 63 (12.2%) | ||
| URBMI | 530 (34.0%) | 163 (31.4%) | 183 (35.0%) | 184 (35.6%) | ||
| UEBMI | 316 (20.3%) | 78 (15.0%) | 87 (16.6%) | 151 (29.2%) | ||
| NRCMS | 398 (25.5%) | 111 (21.4%) | 172 (32.9%) | 115 (22.2%) | ||
| Others | 52 (3.3%) | 26 (5.0%) | 22 (4.2%) | 4 (0.8%) | ||
| Comorbidities on admission | ||||||
| Diabetes, n (%) | 355 (22.7%) | 137 (26.3%) | 106 (20.3%) | 112 (21.7%) | 0.052 | 0.075 |
| Stroke, n (%) | 133 (8.5%) | 35 (6.7%) | 38 (7.2%) | 60 (11.6%) | 0.008 | 0.005 |
| Chronic heart failure | 28 (1.8%) | 17 (3.3%) | 4 (0.8%) | 7 (1.4%) | 0.006 | 0.020 |
| COPD | 84 (5.4%) | 40 (7.7%) | 25 (4.8%) | 19 (3.7%) | 0.013 | 0.004 |
| Hypertension, n (%) | 748 (47.9%) | 291 (55.9%) | 221 (42.3%) | 236 (45.6%) | < 0.001 | 0.001 |
Patients were categorized into three groups (F1-T1, F1-T2, and F1-T3) based on the tertile of the first-day fluid input volume. On the initial day, average fluid input volumes were 600, 1,765, and 3,800 mL in the F1-T1, F1-T2, and F1-T3 groups, respectively [Table 1]. Median ages in the F1-T1, F1-T2, and F1-T3 groups were 64 (IQR 56-71), 64 (IQR 54-72), and 64 (IQR 53-71), respectively [Table 1]. Patients in the F1-T1 group showed higher NT-proBNP levels (F1-T1 vs. F1-T2 vs. F1-T3: 1,248 vs. 923 vs. 216 pg/mL, P < 0.001) and higher cTnI levels (2.90 vs. 1.90 vs. 2.50 μg/L, P = 0.001) [Table 2]. Meanwhile, the F1-T3 group had a higher rate of cardiogenic shock at admission (4.8% vs. 6.3% vs. 12.0%, P < 0.001). Regarding in-hospital treatment, most patients in the F1-T1 group received ACEIs/ARBs (74.7% vs. 67.3% vs. 62.9%, P < 0.001) and β-blockers (77.9% vs. 63.7% vs. 62.7%, P < 0.001). Conversely, most patients in the F1-T3 group were treated with inotropes (31.1% vs. 27.2% vs. 43.3%, P < 0.001) and underwent coronary revascularization (76.2% vs. 83.7% vs. 93.0%, P < 0.001) [Table 2].
Severity assessment of RVMI and in-hospital treatment of the patients
| Parameters | Overall N = 1,561 | F1-T1 N = 521 | F1-T2 N = 523 | F1-T3 N = 517 | P-value | P for trend |
| Severity assessment | ||||||
| cTnI, median [IQR], μg/L | 2.5 [0.4, 9.5] | 2.9 [0.6, 12.5] | 1.9 [0.3, 6.4] | 2.5 [0.4, 9.5] | 0.001 | 0.030 |
| NT-proBNP, median [IQR], pg/mL | 742.0 [136.0, 2,425.0] | 1,248.0 [419.0, 2,639.0] | 923.0 [238.0, 2,639.0] | 216.0 [4.5, 1,344.0] | < 0.001 | < 0.001 |
| Multivessel lesion, n (%) | 594 (44.6%) | 311 (64.5%) | 181 (36.5%) | 102 (28.8%) | < 0.001 | < 0.001 |
| Killip classification, n (%) | 0.001 | 0.338 | ||||
| I | 1059 (67.9%) | 342 (65.6%) | 361 (69.2%) | 356 (69.0%) | ||
| II | 321 (20.6%) | 124 (23.8%) | 107 (20.5%) | 90 (17.4%) | ||
| III | 55 (3.5%) | 28 (5.4%) | 13 (2.5%) | 14 (2.7%) | ||
| IV | 124 (8.0%) | 27 (5.2%) | 41 (7.9%) | 56 (10.9%) | ||
| Complications on admission | ||||||
| Angina | 58 (3.7%) | 26 (5.0%) | 12 (2.3%) | 20 (3.9%) | 0.069 | 0.337 |
| Cardiogenic shock, n (%) | 120 (7.7%) | 25 (4.8%) | 33 (6.3%) | 62 (12.0%) | < 0.001 | < 0.001 |
| Sinus bradycardia, n (%) | 271 (17.4%) | 81 (15.5%) | 90 (17.2%) | 100 (19.3%) | 0.270 | 0.107 |
| Echocardiography | ||||||
| LV ejection fraction, median [IQR], % | 55.0 [49.0, 60.0] | 54.0 [45.5, 61.0] | 55.0 [50.0, 60.0] | 55.0 [50.0, 61.0] | 0.122 | 0.041 |
| LV diameter, median [IQR], mm | 48.0 [45.0, 51.0] | 48.0 [44.0, 52.0] | 48.0 [45.0, 50.0] | 48.0 [44.0, 50.0] | 0.158 | 0.055 |
| RV diameter, median [IQR], mm | 28.0 [25.0, 31.0] | 29.0 [26.0, 31.0] | 28.0 [21.0, 30.0] | 28.0 [25.0, 31.0] | < 0.001 | 0.016 |
| Electrocardiogram | ||||||
| Atrial fibrillation, n (%) | 58 (3.72%) | 20 (3.84%) | 17 (3.25%) | 21 (4.06%) | 0.774 | 0.851 |
| Atrioventricular block, n (%) | 221 (14.2%) | 72 (13.8%) | 63 (12.0%) | 86 (16.6%) | 0.101 | 0.195 |
| Bundle branch block, n (%) | 55 (3.52%) | 18 (3.45%) | 19 (3.63%) | 18 (3.48%) | 0.986 | 0.981 |
| Bradycardia, n (%) | 271 (17.4%) | 81 (15.5%) | 90 (17.2%) | 100 (19.3%) | 0.270 | 0.107 |
| Treatments during hospitalization | ||||||
| Revascularization, n (%) | 1316 (84.3%) | 397 (76.2%) | 438 (83.7%) | 481 (93.0%) | < 0.001 | < 0.001 |
| ACEI/ARB, n (%) | 1066 (68.3%) | 389 (74.7%) | 352 (67.3%) | 325 (62.9%) | < 0.001 | < 0.001 |
| Calcium channel blockers, n (%) | 200 (12.8%) | 68 (13.1%) | 60 (11.5%) | 72 (13.9%) | 0.486 | 0.675 |
| β-blockers, n (%) | 1063 (68.1%) | 406 (77.9%) | 333 (63.7%) | 324 (62.7%) | < 0.001 | < 0.001 |
| Statins, n (%) | 1517 (97.2%) | 510 (97.9%) | 504 (96.4%) | 503 (97.3%) | 0.326 | 0.560 |
| Aspirin, n (%) | 1518 (97.2%) | 507 (97.3%) | 508 (97.1%) | 503 (97.3%) | 0.981 | 0.983 |
| Clopidogrel, n (%) | 1057 (67.7%) | 348 (66.8%) | 383 (73.2%) | 326 (63.1%) | 0.002 | 0.200 |
| Ticagrelor, n (%) | 497 (31.8%) | 188 (36.1%) | 112 (21.4%) | 197 (38.1%) | < 0.001 | 0.494 |
| Intravenous nitrates, n (%) | 974 (62.4%) | 342 (65.6%) | 303 (57.9%) | 329 (63.6%) | 0.028 | 0.501 |
| Inotropes, n (%) | 528 (33.8%) | 162 (31.1%) | 142 (27.2%) | 224 (43.3%) | < 0.001 | < 0.001 |
The first-day fluid input was inversely associated with mortality in patients with RVMI
During the follow-up, the all-cause mortality rates were 15.2%, 10.7%, and 10.2%, whereas the cardiac mortality rates were 10.2%, 6.1%, and 6.0% in the F1-T1, F1-T2, and F1-T3 groups, respectively. Compared with patients in the F1-T1 group, those in F1-T2 and F1-T3 had significantly reduced risks of all-cause mortality, with adjusted HRs of 0.64 (95%CI: 0.44-0.94) and 0.66 (95%CI: 0.44-0.99), respectively. Patients in the F1-T2 and F1-T3 groups also had a lower risk of cardiac mortality than those in the F1-T1 group, with adjusted HRs of 0.52 (95%CI: 0.31-0.85) and 0.50 (95%CI: 0.30-0.85), respectively [Table 3 and Figure 2]. Notably, patients in the F1-T1 group had a higher risk of death during the first three years of follow-up compared to the other two groups. However, at later follow-up, the survival rates declined at approximately the same rate across all groups [Figure 2]. By contrast, the average fluid input during the first three and seven days was not associated with all-cause mortality or cardiac death during follow-up [Table 3]. Additionally, restricted cubic spline analyses showed no evidence of non-linear associations between fluid input and either outcome across the three exposure windows (all P for non-linearity > 0.05) [Figure 3].
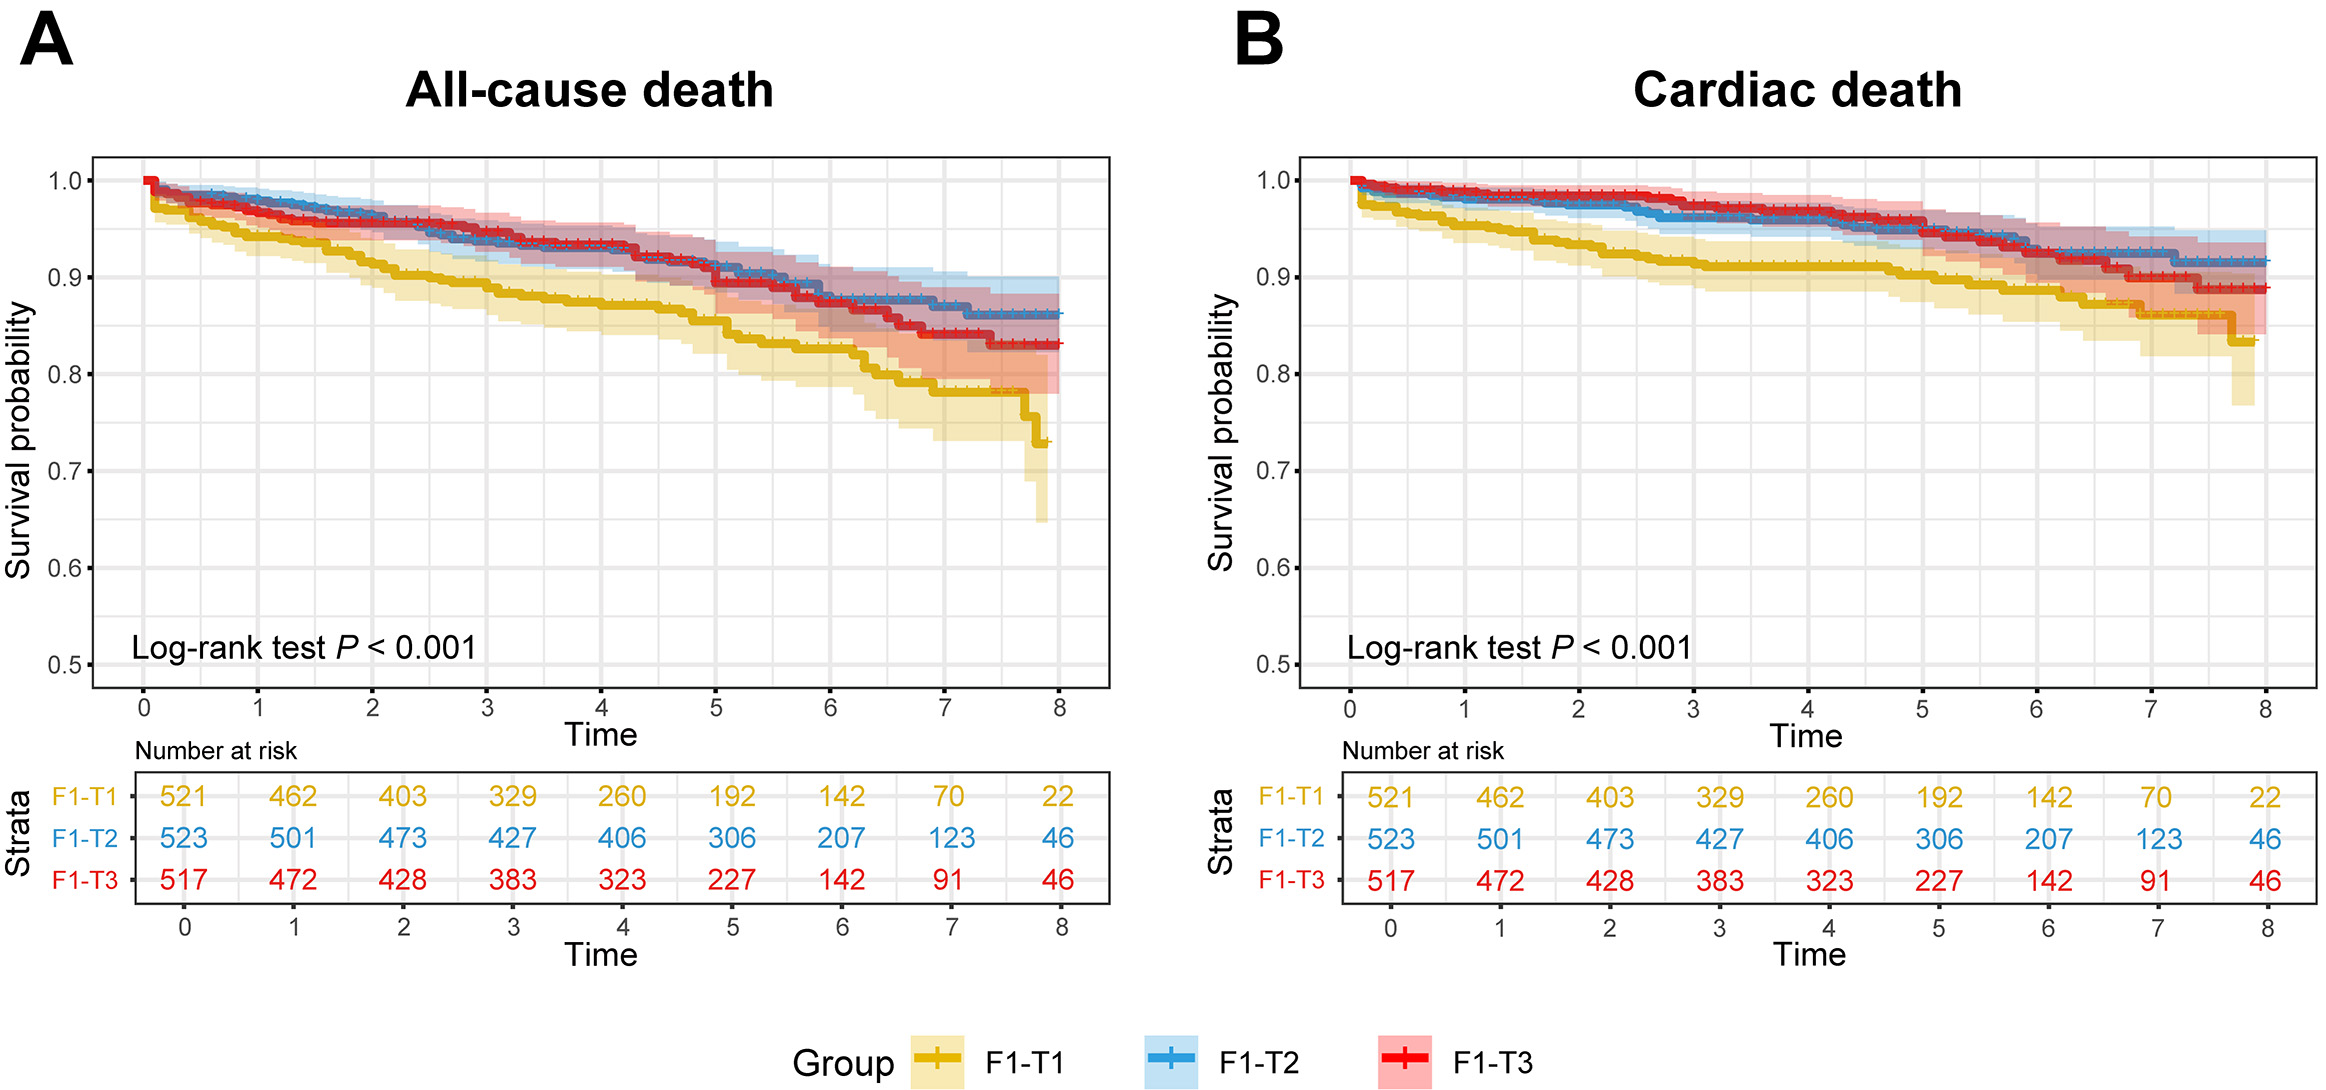
Figure 2. The mortality risk based on different fluid input volumes in patients with right ventricular myocardial infarction. Notes: Kaplan-Meier curves for all-cause mortality (A) and cardiac mortality (B) across different fluid input volume groups in patients with right ventricular myocardial infarction.
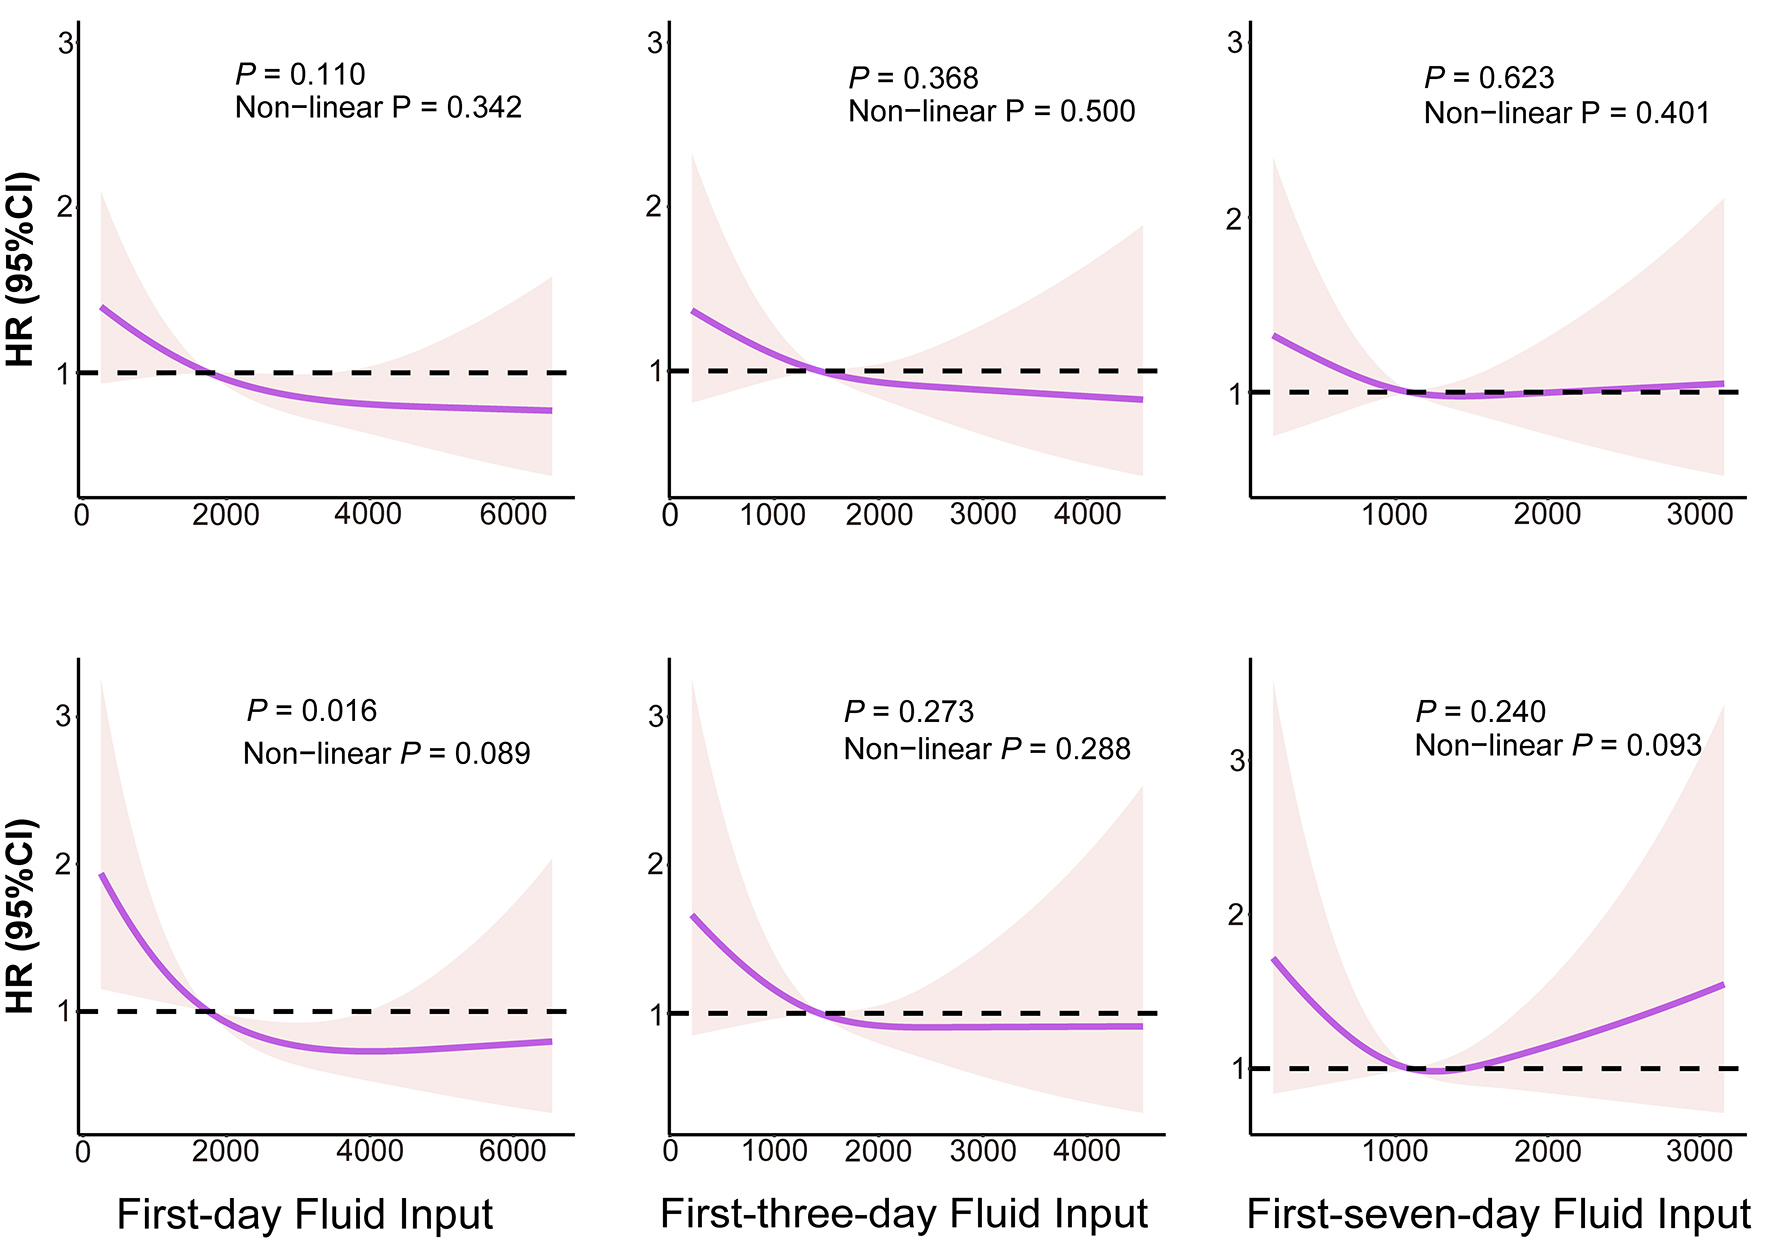
Figure 3. Exposure-response associations between F1, F3 or F7 and mortality risk in RVMI participants. Figures in the top row show the associations of F1, F3, and F7 with all-cause mortality, whereas figures in the bottom row show the associations of F1, F3, and F7 with cardiac mortality. HR: Hazard ratio; CI: confidence interval; F1: first-day fluid input; F3: first-three-day fluid input; F7: first-seven-day fluid input. P for non-linearity was calculated by likelihood ratio tests (LRTs).
Association of the fluid input volume with long-term outcomes
| Endpoint | Fluid input volume | Crude | Adjusteda | ||
| HR (95%CI) | P-value | HR (95%CI) | P-value | ||
| First day | |||||
| All-cause death | F1-T1 | Reference | |||
| F1-T2 | 0.55 (0.39-0.78) | < 0.001 | 0.64 (0.44-0.94) | 0.022 | |
| F1-T3 | 0.60 (0.42-0.85) | 0.004 | 0.66 (0.44-0.99) | 0.044 | |
| Cardiac death | F1-T1 | Reference | |||
| F1-T2 | 0.47 (0.30-0.73) | 0.001 | 0.52 (0.31-0.85) | 0.010 | |
| F1-T3 | 0.52 (0.33-0.81) | 0.004 | 0.50 (0.30-0.85) | 0.010 | |
| First 3 days | |||||
| All-cause death | F3-T1 | Reference | |||
| F3-T2 | 0.72 (0.51-1.01) | 0.054 | 0.91 (0.63-1.31) | 0.604 | |
| F3-T3 | 0.65 (0.45-0.94) | 0.021 | 0.72 (0.47-1.09) | 0.123 | |
| Cardiac death | F3-T1 | Reference | |||
| F3-T2 | 0.69 (0.45-1.05) | 0.083 | 0.89 (0.56-1.42) | 0.632 | |
| F3-T3 | 0.60 (0.38-0.95) | 0.031 | 0.63 (0.36-1.08) | 0.094 | |
| First 7 days | |||||
| All-cause death | F7-T1 | Reference | |||
| F7-T2 | 1.08 (0.76-1.54) | 0.651 | 1.05 (0.73-1.53) | 0.788 | |
| F7-T3 | 0.87 (0.60-1.26) | 0.455 | 0.78 (0.51-1.18) | 0.238 | |
| Cardiac death | F7-T1 | Reference | |||
| F7-T2 | 0.99 (0.64-1.53) | 0.969 | 0.96 (0.60-1.54) | 0.865 | |
| F7-T3 | 0.70 (0.44-1.12) | 0.140 | 0.61 (0.35-1.05) | 0.074 | |
A restricted cubic spline with four knots was analyzed. Models were adjusted for sex, age, BMI, smoking status, medical insurance, HR, FBG, LDL-C, cTnI, NT-proBNP, SBP, DBP, eGFR, concomitant left-sided heart failure, multivessel coronary lesions, Killip classification, cardiogenic shock on admission, coronary revascularization, hypotensive drugs (ACEIs or ARBs, CCBs, and β-blockers), anti-platelet medications (aspirin, clopidogrel, and ticagrelor), other medications (inotropes and statins), and medical history (diabetes, hypertension, stroke, chronic heart failure, angina pectoris, and COPD or asthma) in Cox proportional hazards models.
Subgroup analysis
Stratified analyses were performed to assess whether the association between day-1 fluid input and all-cause and cardiovascular death was consistent across key demographic and clinical subgroups. For all-cause mortality, significant effect modification was observed for NT-proBNP categories (P for interaction = 0.046) and revascularization status (P for interaction = 0.033), suggesting that the association between day-1 fluid input and all-cause mortality differed across levels of baseline cardiac dysfunction and by revascularization status. No significant interactions were identified for sex, age, BMI, smoking status, diabetes, hypertension, stroke, cardiogenic shock, COPD, Killip class, multivessel disease, or chronic heart failure (all P for interaction > 0.05) [Figure 4]. For cardiovascular death, a significant interaction was observed for revascularization status (P for interaction = 0.017), whereas interactions for the other subgroup variables were not statistically significant (all P for interaction > 0.05) [Figure 5].
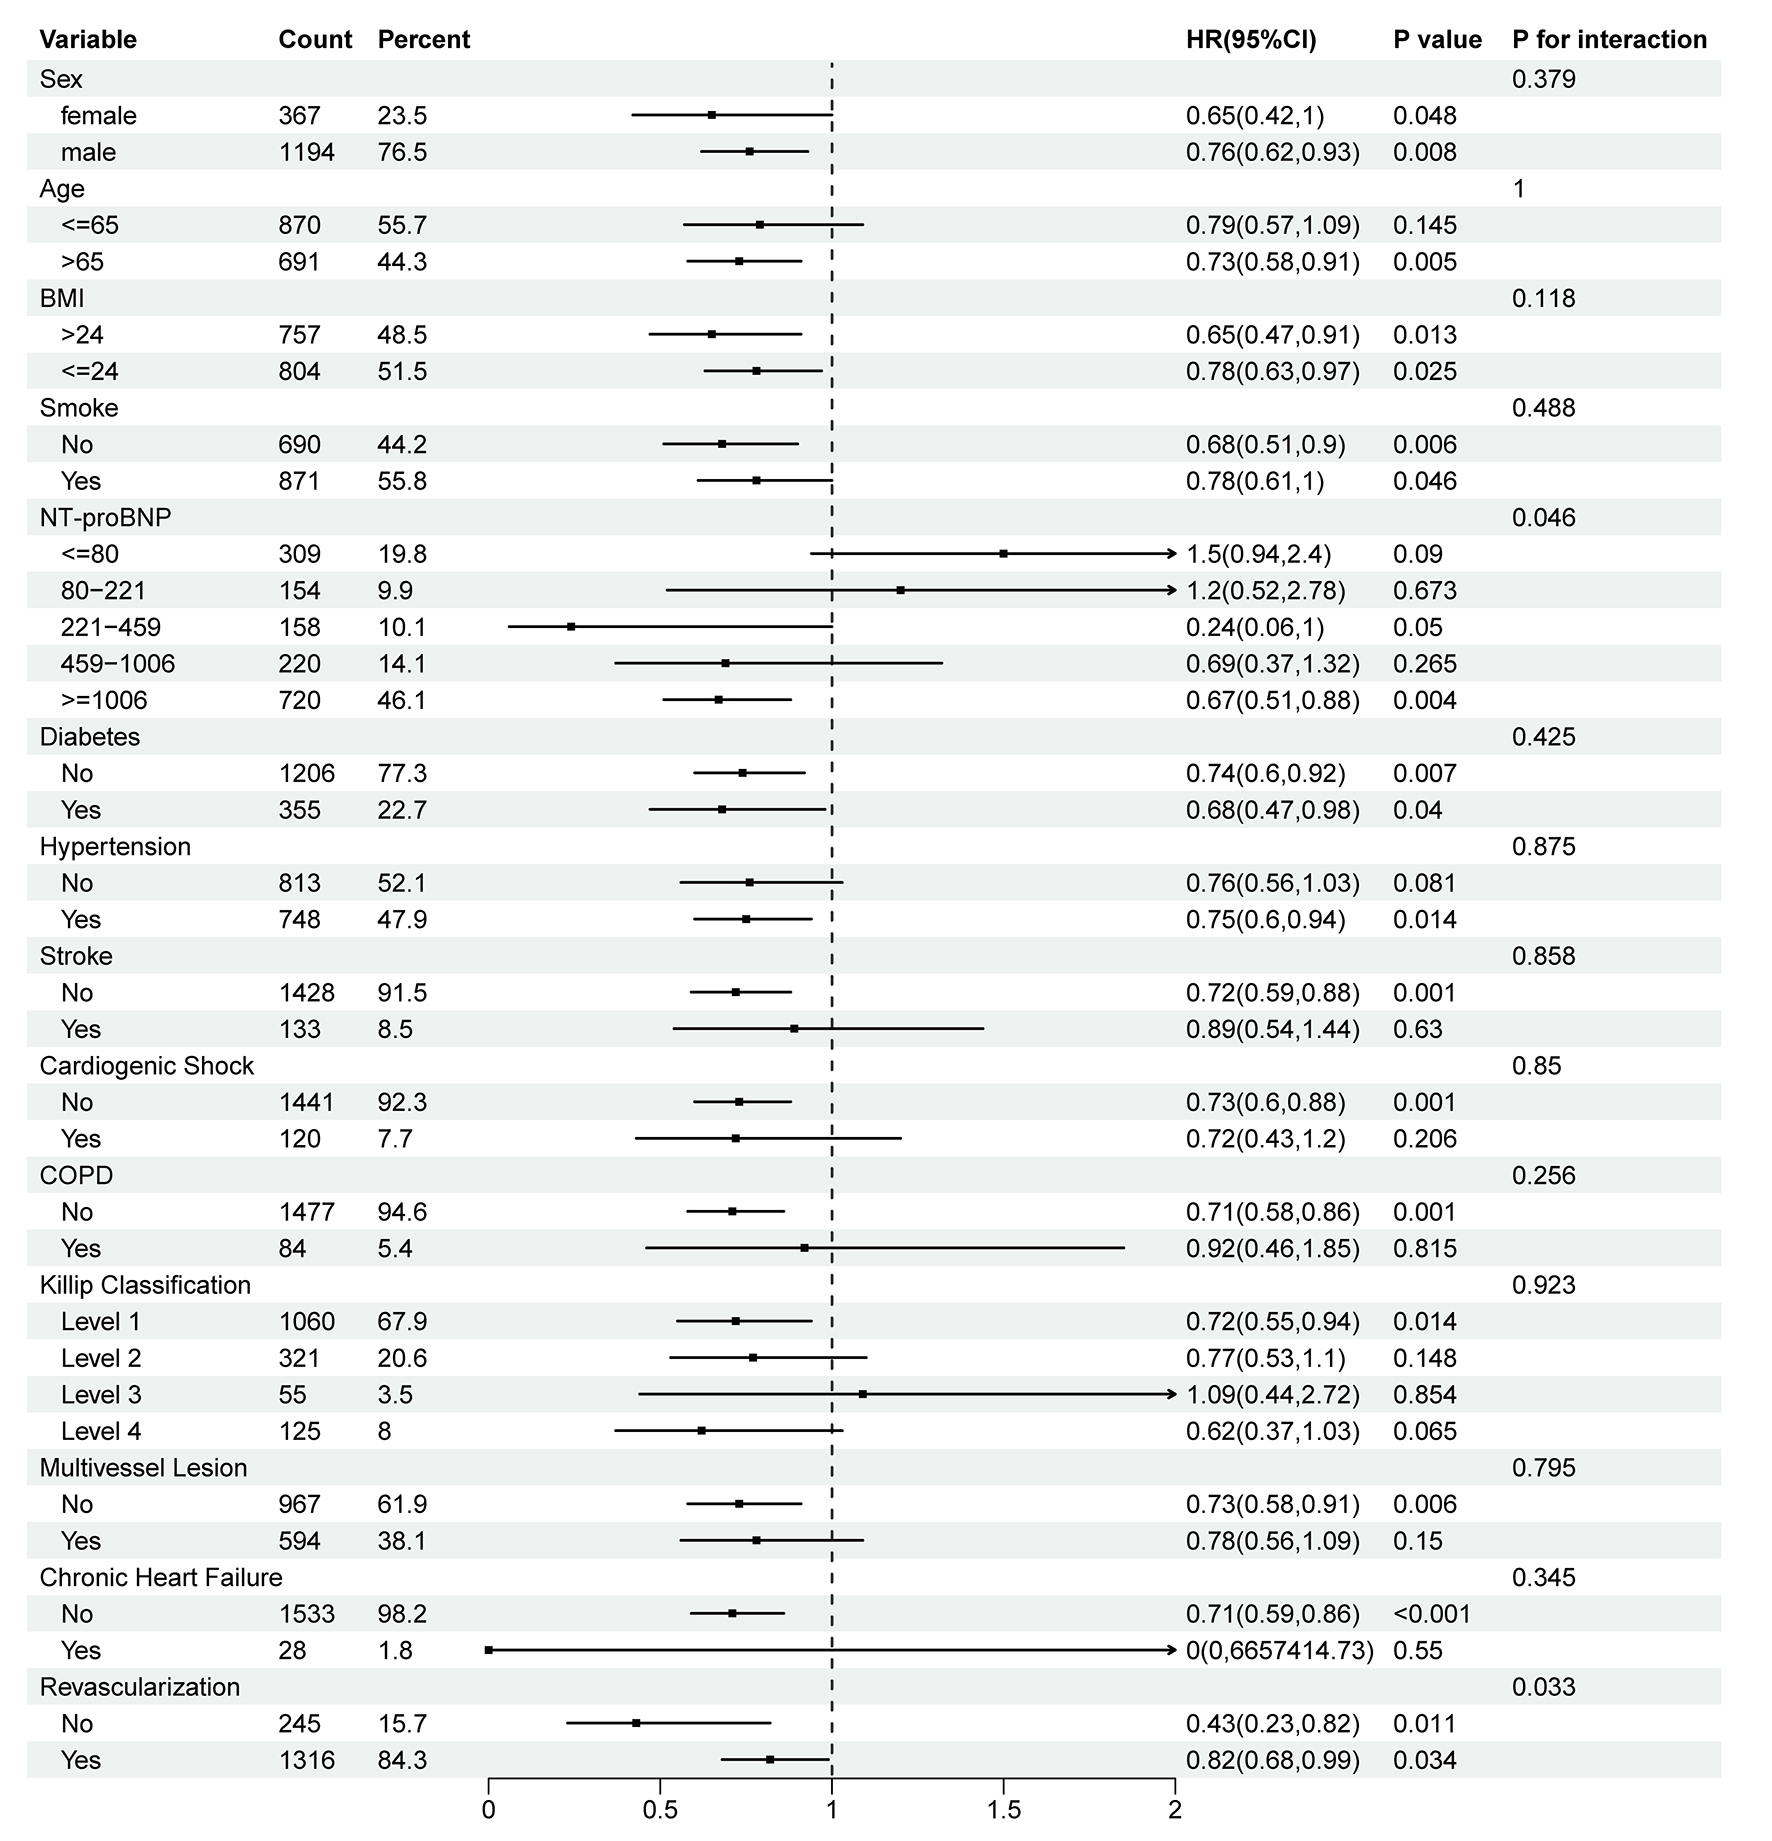
Figure 4. Subgroup analysis of the association between day-1 fluid input and all-cause mortality. BMI: Body mass index; NT-proBNP: N-terminal pro b-type natriuretic peptide; COPD: chronic obstructive pulmonary disease; HR: hazard ratio; CI: confidence interval. P for interaction was calculated from Wald tests.
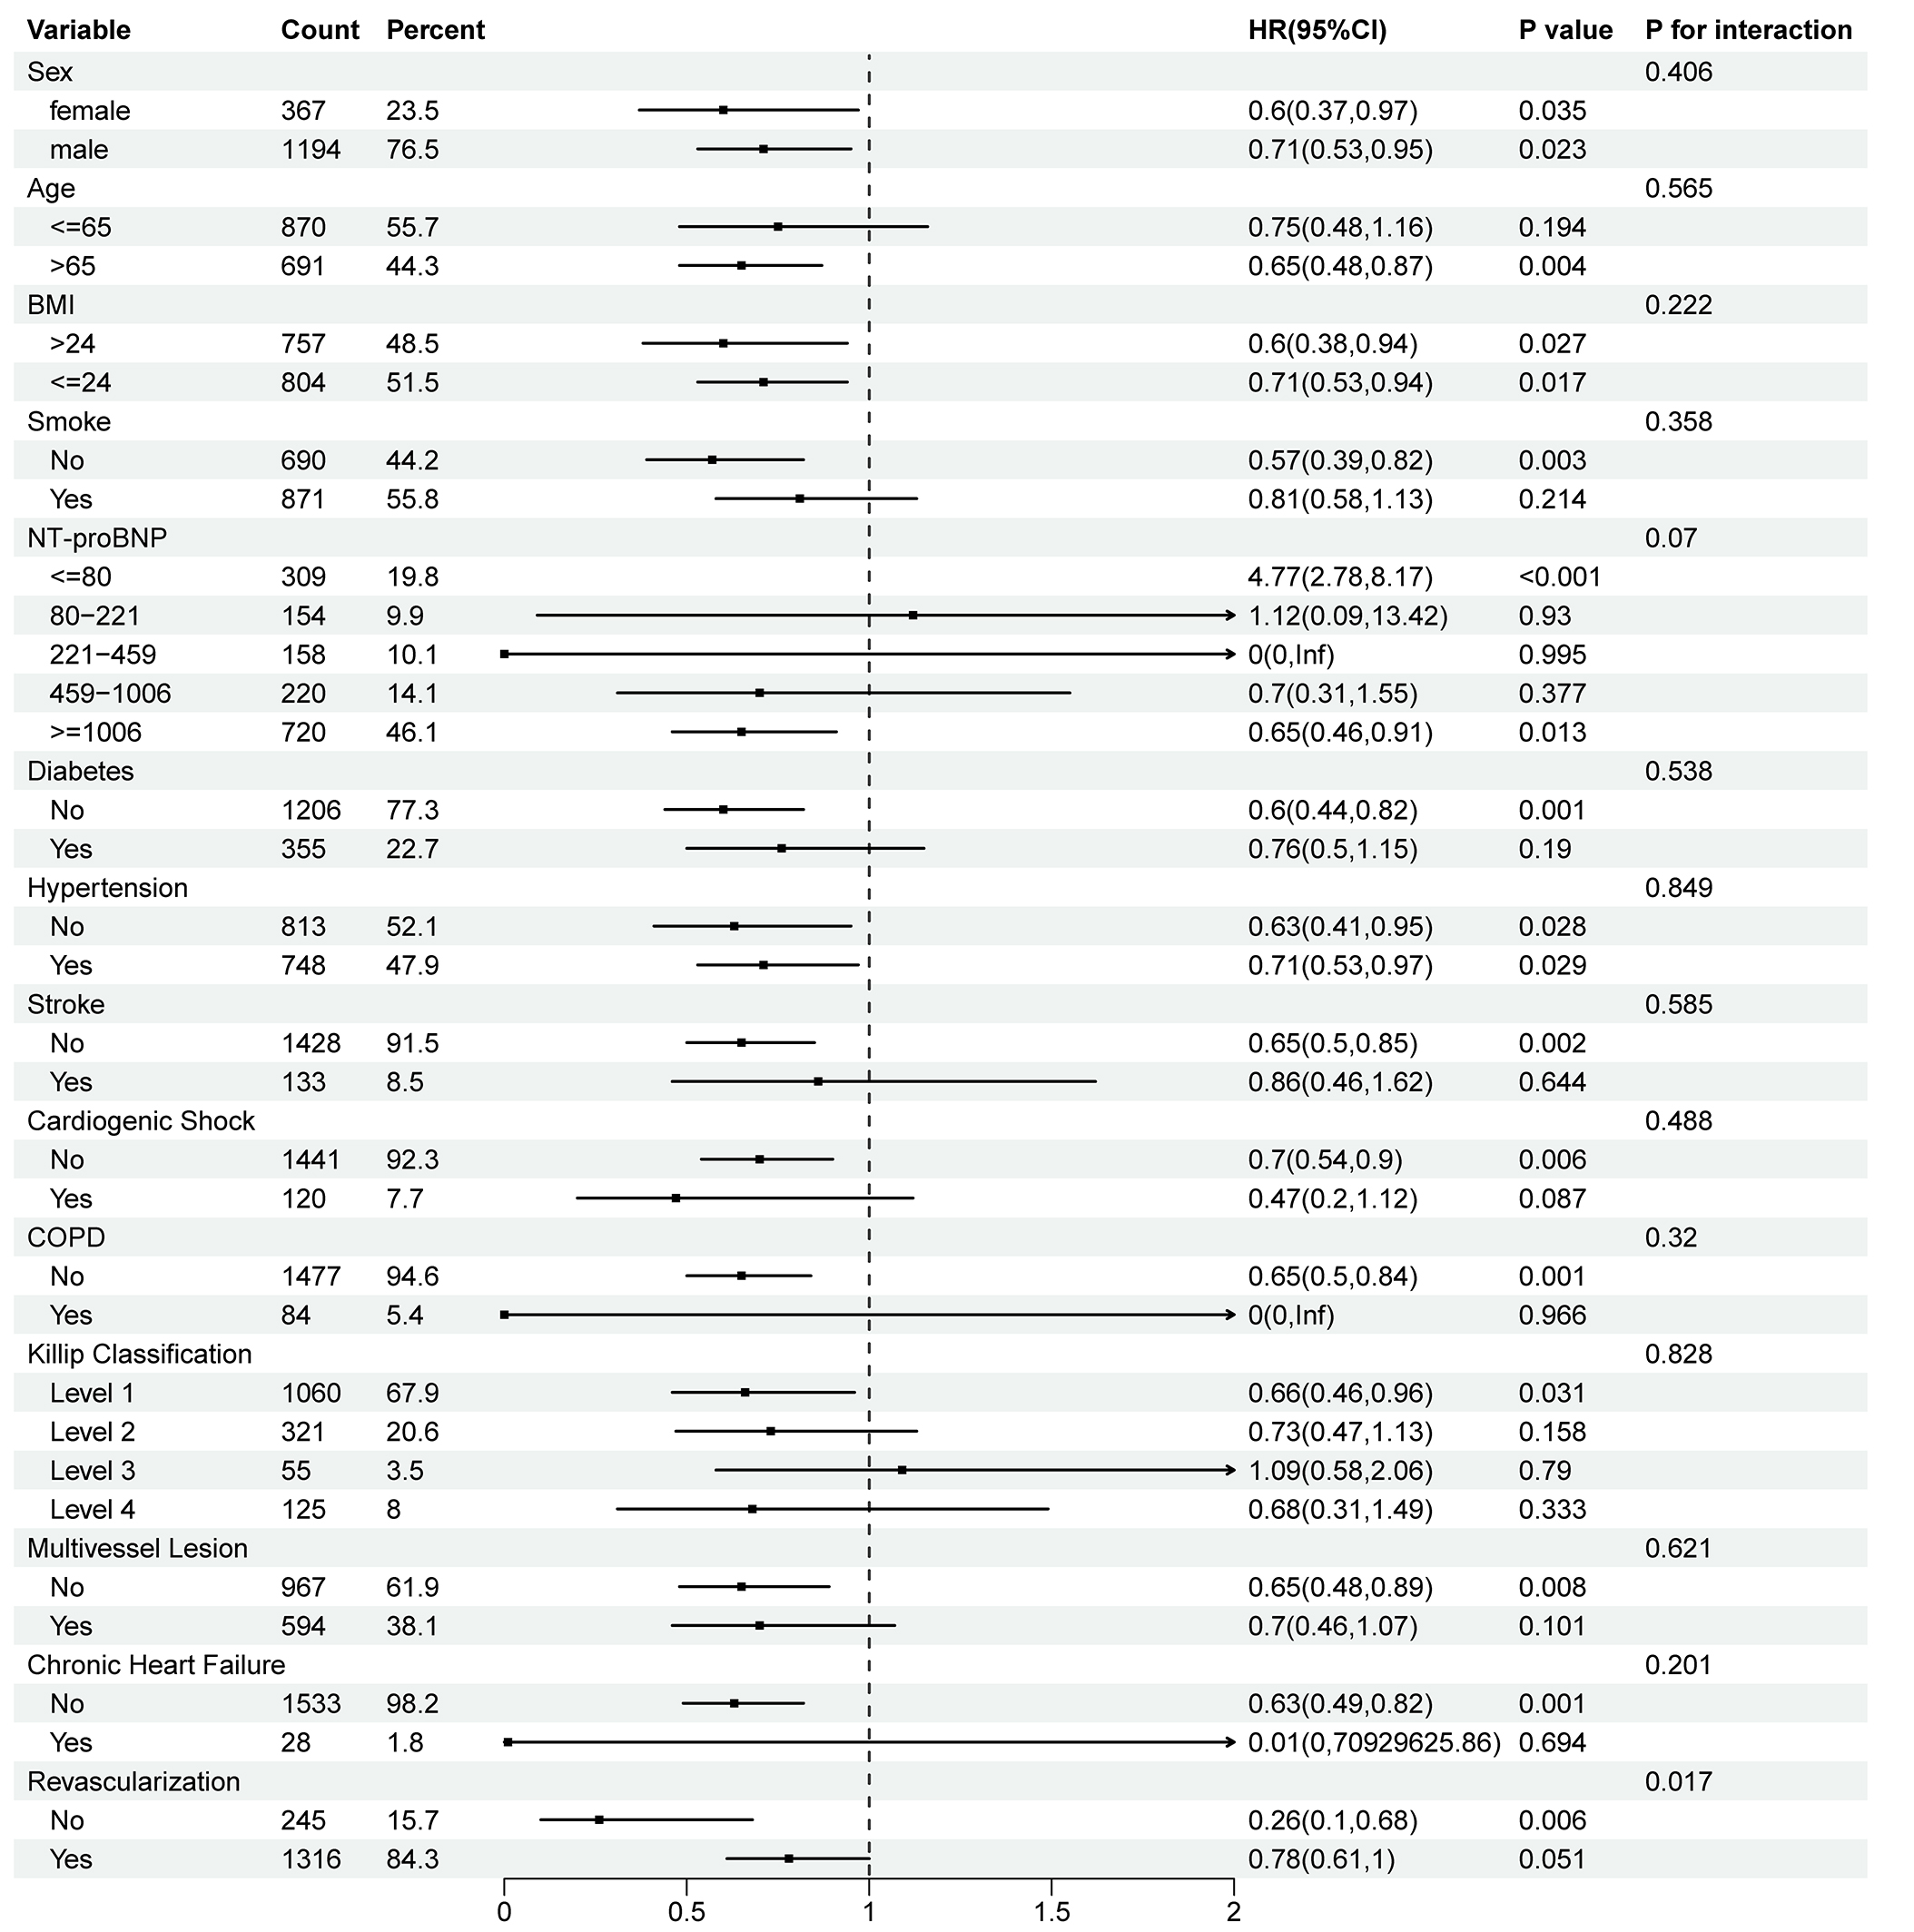
Figure 5. Subgroup analysis of the association between day-1 fluid input and cardiovascular mortality. BMI: Body mass index; NT-proBNP: N-terminal pro b-type natriuretic peptide; COPD: chronic obstructive pulmonary disease; HR: hazard ratio; CI: confidence interval. P-values for interactions were calculated using Wald test.
Data are presented as HRs (95%CIs) for the association between day-1 fluid input, modeled as a continuous variable, and all-cause mortality within each subgroup, as estimated by using Cox proportional hazards models. Effect modification was assessed using likelihood ratio tests by comparing models with and without interaction terms between the subgroup variable and continuous day-1 fluid input; P-values for interaction are shown. Models were adjusted for sex, age, BMI, smoking status, medical insurance, heart rate, FBG, LDL-C, cTnI, NT-proBNP, SBP, DBP, eGFR, concomitant left-sided heart failure, multivessel coronary lesions, Killip classification, cardiogenic shock on admission, coronary revascularization, hypotensive drugs (ACEIs/ARBs, CCBs, and β-blockers), anti-platelet medications (aspirin, clopidogrel, and ticagrelor), other drugs (inotropes and statins), and medical history (diabetes, hypertension, stroke, chronic heart failure, angina pectoris, and COPD or asthma).
Data are presented as HRs (95%CIs) for the association between day-1 fluid input, modeled as a continuous variable, and cardiovascular death within each subgroup, as estimated by using Cox proportional hazards models. Effect modification was assessed using likelihood ratio tests by comparing models with vs. without interaction terms between the subgroup variable and continuous day-1 fluid input; P-values for interaction are shown. Models were adjusted for sex, age, BMI, smoking status, medical insurance, heart rate, FBG, LDL-C, cTnI, NT-proBNP, SBP, DBP, eGFR, concomitant left-sided heart failure, multivessel coronary lesions, Killip classification, cardiogenic shock on admission, coronary revascularization, hypotensive drugs (ACEIs/ARBs, CCBs, and β-blockers), anti-platelet medications (aspirin, clopidogrel, and ticagrelor), other drugs (inotropes and statins), and medical history (diabetes, hypertension, stroke, chronic heart failure, angina pectoris, and COPD or asthma).
Sensitivity analyses
The results of the sensitivity analyses are shown in Table 4. In the first sensitivity analysis, the higher first-day fluid input volume was inversely associated with all-cause mortality (F1-T2: HR 0.66, 95%CI: 0.45-0.97; F1-T3: HR 0.67, 95%CI: 0.44-1.02) and cardiac death (F1-T2: HR 0.54, 95%CI: 0.33-0.90; F1-T3: HR 0.55, 95%CI: 0.32-0.93) after additional adjustment for nitroglycerin or isosorbide mononitrate injection, ALT, platelet count, serum creatinine, hemoglobin, potassium levels, arrhythmias (including atrial fibrillation, atrioventricular block, bundle branch block, and bradycardia), and left ventricular internal diameter. In the second sensitivity test, the first-day fluid input volume was associated with a lower risk of all-cause mortality (F1-T2: HR 0.60, 95%CI: 0.41-0.88; F1-T3: HR 0.60, 95%CI: 0.41-0.89) and cardiac mortality (F1-T2: HR 0.49, 95%CI: 0.30-0.80; F1-T3: HR 0.47, 95%CI: 0.28-0.78) when hospitals, multivessel lesion, and Killip classification were treated as random effects. In the third sensitivity analysis, after limiting adjustments to baseline confounders by removing post-admission treatments such as ACEIs/ARBs, β-blockers, CCBs, statins, aspirin, clopidogrel, ticagrelor, intravenous nitrates, inotropes, and revascularization procedures, the first-day fluid input volume showed an inverse relationship with all-cause mortality (F1-T2: HR 0.63, 95%CI: 0.44-0.91; F1-T3: HR 0.67, 95%CI: 0.46-0.98) and cardiac mortality (F1-T2: HR 0.50, 95%CI: 0.31-0.81; F1-T3: HR 0.54, 95%CI: 0.33-0.88). Conversely, the average fluid input volume over the first 3 or 7 days was not significantly associated with all-cause or cardiac death in this model (all P > 0.05). In the fourth sensitivity analysis, to maintain consistency in baseline treatment approaches, we excluded patients who received any of the aforementioned medications or underwent revascularization. Under this restriction, higher first-day fluid input still correlated with reduced risk of both all-cause mortality (F1-T2: HR 0.55, 95%CI: 0.36-0.85; F1-T3: HR 0.55, 95%CI: 0.36-0.85) and cardiac mortality (F1-T2: HR 0.40, 95%CI: 0.23-0.71; F1-T3: HR 0.39, 95%CI: 0.23-0.69). For the average fluid input over the first 3 days, the association with cardiac death became statistically significant in the highest tertile (F3-T3: HR 0.47, 95%CI: 0.26-0.85), while remaining associations for the first 3-day and 7-day averages were not statistically significant (most P > 0.05). In the fifth sensitivity analysis (complete-case analysis), the inverse association between first-day fluid input and cardiac death remained statistically significant (F1-T2: HR 0.31, 95%CI: 0.12-0.79; F1-T3: HR 0.27, 95%CI: 0.09-0.79). For all-cause mortality, the point estimates indicated a protective trend, but the associations were not statistically significant (F1-T2: HR 0.71, 95%CI: 0.37-1.35; F1-T3: HR 0.50, 95%CI: 0.24-1.03). No significant associations were observed for the first 3-day or 7-day average fluid input volumes with either endpoint in the complete-case data (all P > 0.05).
Results of sensitivity analysis
| Endpoint | Fluid input volume | Model 1a | Model 2b | Model 3c | Model 4d | Model 5e | |||||
| HR (95%CI) | P-value | HR (95%CI) | P-value | HR (95%CI) | P-value | HR (95%CI) | P-value | HR (95%CI) | P-value | ||
| First day | |||||||||||
| All-cause death | F1-T1 | Reference | |||||||||
| F1-T2 | 0.66 (0.45-0.97) | 0.033 | 0.60 (0.41-0.88) | 0.008 | 0.63 (0.44-0.91) | 0.015 | 0.55 (0.36-0.85) | 0.007 | 0.71 (0.37-1.35) | 0.296 | |
| F1-T3 | 0.67 (0.44-1.02) | 0.060 | 0.60 (0.41-0.89) | 0.011 | 0.67 (0.46-0.98) | 0.041 | 0.55 (0.36-0.85) | 0.007 | 0.50 (0.24-1.03) | 0.062 | |
| Cardiac death | F1-T1 | Reference | |||||||||
| F1-T2 | 0.54 (0.33-0.90) | 0.018 | 0.49 (0.30-0.80) | 0.004 | 0.50 (0.31-0.81) | 0.005 | 0.40 (0.23-0.71) | 0.002 | 0.31 (0.12-0.79) | 0.014 | |
| F1-T3 | 0.55 (0.32-0.93) | 0.027 | 0.47 (0.28-0.78) | 0.003 | 0.54 (0.33-0.88) | 0.013 | 0.39 (0.23-0.69) | 0.001 | 0.27 (0.09-0.79) | 0.016 | |
| First 3 days | |||||||||||
| All-cause death | F3-T1 | Reference | |||||||||
| F3-T2 | 0.91 (0.63-1.31) | 0.598 | 0.91 (0.63-1.30) | 0.590 | 0.90 (0.63-1.28) | 0.551 | 0.75 (0.50-1.13) | 0.172 | 0.63 (0.33-1.20) | 0.161 | |
| F3-T3 | 0.68 (0.44-1.05) | 0.082 | 0.70 (0.46-1.06) | 0.091 | 0.78 (0.52-1.16) | 0.226 | 0.65 (0.41-1.03) | 0.065 | 0.65 (0.32-1.32) | 0.236 | |
| Cardiac death | F3-T1 | Reference | |||||||||
| F3-T2 | 0.88 (0.55-1.42) | 0.611 | 0.88 (0.56-1.38) | 0.499 | 0.87 (0.56-1.37) | 0.556 | 0.63 (0.73-1.07) | 0.089 | 0.54 (0.23-1.30) | 0.169 | |
| F3-T3 | 0.63 (0.35-1.11) | 0.111 | 0.58 (0.34-1.00) | 0.049 | 0.69 (0.41-1.16) | 0.165 | 0.47 (0.26-0.85) | 0.013 | 0.40 (0.14-1.15) | 0.088 | |
| First 7 days | |||||||||||
| All-cause death | F7-T1 | Reference | |||||||||
| F7-T2 | 1.06 (0.72-1.54) | 0.780 | 1.05 (0.72-1.52) | 0.799 | 1.12 (0.77-1.61) | 0.562 | 1.03 (0.66-1.58) | 0.910 | 0.67 (0.34-1.32) | 0.251 | |
| F7-T3 | 0.77 (0.50-1.18) | 0.231 | 0.77 (0.51-1.16) | 0.216 | 0.85 (0.57-1.27) | 0.436 | 0.74 (0.46-1.20) | 0.223 | 0.89 (0.45-1.77) | 0.740 | |
| Cardiac death | F7-T1 | Reference | |||||||||
| F7-T2 | 0.97 (0.60-1.57) | 0.911 | 0.93 (0.58-1.50) | 0.769 | 1.04 (0.65-1.66) | 0.867 | 0.94 (0.55-1.63) | 0.831 | 0.45 (0.17-1.18) | 0.103 | |
| F7-T3 | 0.64 (0.37-1.12) | 0.118 | 0.57 (0.33-0.98) | 0.041 | 0.68 (0.40-1.14) | 0.138 | 0.58 (0.31-1.09) | 0.089 | 0.70 (0.27-1.78) | 0.452 | |
High fluid input was associated with a lower incidence of in-hospital hypotension
Based on these findings, we further examined whether day-1 fluid input was associated with a reduced risk of hypotension. Participants in the highest tertile of day-1 fluid input were classified as the high fluid input group, while the remaining participants were classified as the low fluid input group. After propensity score matching, 245 patients in the high fluid input group were matched 1:1 with 245 patients in the low fluid input group. The baseline characteristics of both groups were balanced except for multivessel coronary lesions (SMD 0.139) [Table 5]. The incidence of hypotension was 17.1% in the high fluid intake group and 25.3% in the low fluid intake group. Cox regression analysis indicated that higher fluid intake on the first day was associated with a reduced risk of hypotension, with an adjusted HR of 0.68 (95%CI: 0.46-1.00, P = 0.049) [Table 6].
Demographic and baseline characteristics of the patients in the propensity score-matched analysis for hypotension
| Parameter | Low fluid input volume (N = 245) | High fluid input volume (N = 245) | SMD |
| Fluid input volume, median [IQR], mL | |||
| First day | 1,200.00 [570.00, 1,750.00] | 3,650.00 [2,700.00, 5,330.00] | 2.533 |
| Mean of the first 3 days | 1,203.00 [705.00, 1,533.00] | 2,067.00 [1,667.00, 2,493.00] | 1.522 |
| Mean of the first 7 days | 1,046.00 [623.00, 1,279.00] | 1,321.00 [1,088.00, 1,522.00] | 0.853 |
| Clinical characteristics on admission | |||
| Male, n (%) | 190 (77.6) | 184 (75.1) | 0.058 |
| Age, median [IQR], years | 62.00 [53.00, 70.00] | 62.00 [52.00, 71.00] | 0.007 |
| BMI, median [IQR], kg/m2 | 24.20 [23.26, 25.54] | 24.17 [23.05, 25.90] | 0.020 |
| Smoke, n (%) | 146 (59.6) | 141 (57.6) | 0.041 |
| HR, median [IQR], bpm | 74.00 [65.00, 85.00] | 77.00 [66.00, 85.00] | 0.092 |
| SBP, median [IQR], mmHg | 128.00 [115.00,142.00] | 125.00 [112.00, 143.00] | 0.013 |
| DBP, median [IQR], mmHg | 79.00 [70.00, 85.00] | 77.00 [70.00, 87.00] | 0.010 |
| cTnI, median [IQR], μg/L | 3.12 [0.58, 14.00] | 8.20 [1.47, 176.26] | 0.054 |
| NT-proBNP, median [IQR], pg/ml | 689.00 [199.00, 1902.31] | 294.20 [4.51, 1472.17] | 0.074 |
| FBG, median [IQR], mmol/L | 6.63 [5.21, 8.43] | 6.87 [5.92, 8.40] | 0.020 |
| LDL-C, median [IQR], mmol/L | 2.64 [2.09, 3.08] | 2.55 [2.11, 3.07] | 0.009 |
| Killip classification, n (%) | 0.067 | ||
| I | 201 (82.0) | 195 (79.6) | |
| II | 34 (13.9) | 39 (15.9) | |
| III | 6 (2.4) | 6 (2.4) | |
| IV | 4 (1.6) | 5 (2.0) | |
| Insurance, n (%) | 0.026 | ||
| None | 32 (13.1) | 31 (12.7) | |
| URBMI | 92 (37.6) | 95 (38.8) | |
| UEBMI | 67 (27.3) | 66 (26.9) | |
| NRCMS | 53 (21.6) | 52 (21.2) | |
| Others | 1 (0.4) | 1 (0.4) | |
| Multivessel lesions, n (%) | 106 (43.3) | 123 (50.2) | 0.139 |
| Comorbidities | |||
| Diabetes, n (%) | 56 (22.9) | 57 (23.3) | 0.010 |
| Stroke, n (%) | 28 (11.4) | 23 (9.4) | 0.067 |
| Angina, n (%) | 11 (4.5) | 12 (4.9) | 0.019 |
| Hypertension, n (%) | 118 (48.2) | 114 (46.5) | 0.033 |
| Chronic heart failure, n (%) | 5 (2.0) | 5 (2.0) | < 0.001 |
| COPD, n (%) | 8 (3.3) | 9 (3.7) | 0.022 |
| Treatments during hospitalization | |||
| Revascularization, n (%) | 222 (90.6) | 224 (91.4) | 0.029 |
| ACEIs/ARBs, n (%) | 182 (74.3) | 182 (74.3) | < 0.001 |
| CCBs, n (%) | 42 (17.1) | 43 (17.6) | 0.011 |
| β-blockers, n (%) | 176 (71.8) | 175 (71.4) | 0.009 |
| Statins, n (%) | 238 (97.1) | 238 (97.1) | < 0.001 |
| Aspirin, n (%) | 238 (97.1) | 240 (98.0) | 0.053 |
| Clopidogrel, n (%) | 148 (60.4) | 147 (60.0) | 0.008 |
| Ticagrelor, n (%) | 87 (35.5) | 93 (38.0) | 0.051 |
| Inotropes, n (%) | 41 (16.7) | 43 (17.6) | 0.022 |
Association of first-day fluid input volume with in-hospital hypotension
| Group | Events (n/total) | HR (95%CI) | |||
| Crude | P-value | Model 1a | P-value | ||
| Low fluid input volume | 62/245 | Reference | |||
| High fluid input volume | 42/245 | 0.66 (0.45-0.98) | 0.038 | 0.68 (0.46-1.00) | 0.049 |
DISCUSSION
Our retrospective study explored the association between fluid input volume and long-term outcomes in patients with RVMI. We found that first-day fluid input volume after admission was inversely associated with the risk of long-term death in patients with RVMI. However, there was no significant difference between the average fluid input volume in the first 3 days and 7 days after admission and the risk of long-term death. We further explored the association between first-day fluid input volume and the incidence of in-hospital hypotension using propensity score matching. Among patients with RVMI, the incidence of in-hospital hypotension was lower in those with high first-day fluid input volume than in those with low fluid input volume.
Fluid resuscitation is commonly used to treat septic shock, hemodynamic instability, and substantial blood volume loss, with anticipated benefits for patient outcomes[11]. Nevertheless, the impact of fluid volume administration on the long-term prognosis of patients with RVMI remains uncertain. This study provides evidence that early administration of a larger fluid volume is associated with improved long-term outcomes in patients with RVMI. In this study, cardiac-related fatalities accounted for 57.9% of all-cause mortality, underscoring that early and sufficient fluid administration might partly mitigate the risk of all-cause mortality by reducing cardiac-related fatalities. A randomized controlled study indicated that maintaining a higher mean arterial pressure using positive inotropes and vasopressors reduces cardiac injury in patients with shock following acute myocardial infarction[12]. This suggests that the benefits of greater fluid input may also result from a reduction in cardiac damage. However, the precise mechanism by which increased cardiac workload after myocardial infarction lowers cardiac injury remains unclear. Potential explanations include improved cardiac output, which enhances coronary blood supply and microcirculation, as well as elevated hydrostatic pressure, which limits cardiomyocyte swelling[12,13]. Interestingly, our findings indicate that the positive effect of increased fluid input on long-term prognosis is primarily observed within the first three years following RVMI. Mortality rates in RVMI patients are generally higher during the first year compared to subsequent years[14]. These results suggest that the mechanism underlying the benefits of early fluid input may play a crucial role in ameliorating the long-term prognosis of RVMI patients.
Our study suggests a time-window effect of fluid management in RVMI: fluid input on hospital day 1 was significantly associated with long-term outcomes, whereas mean fluid input over the first 3 and 7 days was not. This pattern is broadly consistent with the prevailing principles emphasized in contemporary reviews and guidelines, which recommend timely early fluid management—when left ventricular function and overall volume tolerance permit—as a cornerstone of RVMI treatment, alongside early hemodynamic optimization and reperfusion[15-17]. However, previous studies do not specify a distinct “therapeutic time window” for fluid management. Our findings, therefore, extend the existing evidence by supporting the clinical relevance of an early window, with day 1 appearing to be the period during which fluid exposure is most strongly associated with long-term prognosis. The null associations observed for the 3-day and 7-day average fluid input should also be interpreted cautiously. Beyond the possibility that multi-day averaging mixes early resuscitation with later phases of care, longer-horizon fluid metrics may also be influenced by evolving post-RVMI management[18,19], such as PCI, which prior studies have identified as a key determinant of RVMI prognosis[20,21], may modify risk trajectories and dilute the marginal contribution of fluid exposure when averaged over several days. In addition, fluid therapy is often de-escalated, reduced, or discontinued as patients stabilize or develop congestion, and later in-hospital fluid exposure becomes increasingly influenced by evolving volume status, concomitant LV dysfunction, and subsequent treatment decisions[16,22-25].
Our study revealed a significant association between increased fluid input and a reduced incidence of hypotension during hospitalization in patients with RVMI. This association can be explained by improved left ventricular preload and cardiac output[26-28]. It is essential to note that hypotension during hospitalization is associated with an elevated risk of various complications. Therefore, alleviating hypotension may have a favorable impact on perioperative outcomes[29]. Additionally, prior research consistently demonstrates that hypotension contributes to heightened long-term mortality in patients with acute left ventricular myocardial infarction[30]. Thus, these observations provide a possible rationale for the benefits and improved long-term outcomes associated with higher early fluid intake volumes in patients with RVMI. We excluded patients with hypotension at admission or on hospital day 1 to minimize reverse causation[31] and incorporated vasopressor use into the definition of the hypotension outcome. Therefore, the hypotension-related results may have limited generalizability to patients presenting with early hemodynamic instability and partly reflect physician- or institution-level treatment decisions. Future studies should address optimal fluid management for RVMI patients with different admission blood pressures.
Limitations
This study has several limitations. First, the limited sample size may have reduced statistical power, increased the risk of type II error, and limited the population representation; thus, it remains unclear whether mean fluid input over the first 3 and 7 days is associated with long-term mortality in acute RVMI. Second, because of the inherent limitations of observational studies, causal inference is limited, and reverse causation may be present. Accordingly, larger multicenter, prospective, and randomized studies are needed. Generalizability is limited because all patients were from Hunan Province, and validation in multi-regional studies or meta-analyses is required. Despite adjustment, unmeasured confounding may persist, including socioeconomic and psychological factors, which have been associated with worse myocardial infarction prognosis[32,33], and mechanical circulatory support (MCS) use, which is a standard therapy for cardiogenic shock[34-37]. Future randomized controlled trials are needed to adjust for MCS use and provide further evidence.
Conclusion
This retrospective cohort study indicates that a higher fluid input volume on the first day after admission is associated with better long-term outcomes and a reduced risk of developing in-hospital hypotension in patients with RVMI. This finding suggests that an early liberal fluid management approach may be a crucial intervention in the clinical management of patients with right ventricular infarction and warrants further investigation.
DECLARATIONS
Author contributions
Had full access to the study data and took responsibility for the data's integrity and the accuracy of the analysis: Huang X, Shi T, Hu L
Revised the manuscript following peer review: Shi T
Designed the study, collected and analyzed data, and wrote the manuscript: Huang X, Hu L
Collected and reviewed the data: Hu L, Long Z, Wang X, Wu M, Peng Z, Gui F, Peng J
Provided valuable suggestions for revision: Wang W
Provided valuable suggestions for study design and data analysis: Lu Y, Yuan H
Designed the project, edited the manuscript, and supervised the study, Responsibility for all aspects of the reliability and freedom from bias of the data presented and their discussed interpretation: Cai J, Weng C
All authors have approved the final version of this paper.
Availability of data and materials
The data that support the findings of this study are available from the corresponding author upon reasonable request.
AI and AI-assisted tools statement
Not applicable.
Financial support and sponsorship
This work was supported by grants from the Noncommunicable Chronic Diseases-National Science and Technology Major Project (2023ZD0503300), Key Research Projects of the Provincial Natural Science Foundation of Hunan Province (No. 2026JJ50619), the Science and Technology Innovation Program of Hunan Province (2022RC3073), Key Research and Development Program of Jiangxi Province (20243BCC31005), and the National Science Foundation of China (81870171).
Conflicts of interest
All authors declared that there are no conflicts of interest.
Ethical approval and consent to participate
The study was approved by the Ethics Committee of the Third Xiangya Hospital of Central South University (2019-S489). Given the retrospective design and anonymized data collection, the requirement for written informed consent was waived.
Consent for publication
Not applicable.
Copyright
© The Author(s) 2026
REFERENCES
1. Wang W, Hu M, Liu H, et al. Global burden of disease study 2019 suggests that metabolic risk factors are the leading drivers of the burden of ischemic heart disease. Cell Metab. 2021;33:1943-56.e2.
2. Hamon M, Agostini D, Le Page O, Riddell JW, Hamon M. Prognostic impact of right ventricular involvement in patients with acute myocardial infarction: meta-analysis. Crit Care Med. 2008;36:2023-33.
3. Shams P, Parks LJ. Right ventricular myocardial infarction. StatPearls Publishing LLC: Treasure Island, FL; 2025. Available from: https://www.ncbi.nlm.nih.gov/books/NBK431048/ [Last accessed on 15 Apr 2026].
4. Goldstein JA, Vlahakes GJ, Verrier ED, et al. Volume loading improves low cardiac output in experimental right ventricular infarction. J Am Coll Cardiol. 1983;2:270-8.
5. Baigrie RS, Haq A, Morgan CD, Rakowski H, Drobac M, McLaughlin P. The spectrum of right ventricular involvement in inferior wall myocardial infarction: a clinical, hemodynamic and noninvasive study. J Am Coll Cardiol. 1983;1:1396-404.
6. Lopez-Sendón J, Coma-Canella I, Viñuelas Adanez J. Volume loading in patients with ischemic right ventricular dysfunction. Eur Heart J. 1981;2:329-38.
7. Harjola VP, Mebazaa A, Čelutkienė J, et al. Contemporary management of acute right ventricular failure: a statement from the Heart Failure Association and the Working Group on Pulmonary Circulation and Right Ventricular Function of the European Society of Cardiology. Eur J Heart Fail. 2016;18:226-41.
8. Inohara T, Kohsaka S, Fukuda K, Menon V. The challenges in the management of right ventricular infarction. Eur Heart J Acute Cardiovasc Care. 2013;2:226-34.
9. Dell'Italia LJ, Starling MR, Blumhardt R, Lasher JC, O'Rourke RA. Comparative effects of volume loading, dobutamine, and nitroprusside in patients with predominant right ventricular infarction. Circulation. 1985;72:1327-35.
10. Veltman CE, van der Hoeven BL, Hoogslag GE, et al. Influence of coronary vessel dominance on short- and long-term outcome in patients after ST-segment elevation myocardial infarction. Eur Heart J. 2015;36:1023-30.
11. Hoste EA, Maitland K, Brudney CS, et al. Four phases of intravenous fluid therapy: a conceptual model. Br J Anaesth. 2014;113:740-7.
12. Ameloot K, Jakkula P, Hästbacka J, et al. Optimum blood pressure in patients with shock after acute myocardial infarction and cardiac arrest. J Am Coll Cardiol. 2020;76:812-24.
13. Bekkers SC, Yazdani SK, Virmani R, Waltenberger J. Microvascular obstruction: underlying pathophysiology and clinical diagnosis. J Am Coll Cardiol. 2010;55:1649-60.
14. Gumina RJ, Murphy JG, Rihal CS, Lennon RJ, Wright RS. Long-term survival after right ventricular infarction. Am J Cardiol. 2006;98:1571-3.
15. Goldstein JA, Lerakis S, Moreno PR. Right ventricular myocardial infarction-a tale of two ventricles: JACC focus seminar 1/5. J Am Coll Cardiol. 2024;83:1779-98.
16. Manca P, Nuzzi V, Mulè M, et al. Gaps and knowledge in the contemporary management of acute right ventricular failure. Circ Heart Fail. 2025;18:e012030.
17. Byrne RA, Rossello X, Coughlan JJ, et al. 2023 ESC guidelines for the management of acute coronary syndromes. Eur Heart J. 2023;44:3720-826.
18. Haloot J, Mahmoud M, Prasad A, Anderson AS, Aslam MI. Management of post-myocardial infarction right ventricular failure. J Soc Cardiovasc Angiogr Interv. 2023;2:100526.
19. Samsky MD, Morrow DA, Proudfoot AG, Hochman JS, Thiele H, Rao SV. Cardiogenic shock after acute myocardial infarction: a review. JAMA. 2021;326:1840-50.
20. Rao MS. Impact of percutaneous coronary intervention in right coronary artery on right ventricular function in patients with acute myocardial infarction. Glob Cardiol Sci Pract. 2022;2022:e202215.
21. Sidhu NS, Kaur S, Mahla H. Isolated right ventricular myocardial infarction caused by occlusion of an anomalous non-dominant right coronary artery: successful management with percutaneous coronary intervention. BMJ Case Rep. 2022;15:e248674.
22. Rao SV, O'Donoghue ML, Ruel M, et al. 2025 ACC/AHA/ACEP/NAEMSP/SCAI guideline for the management of patients with acute coronary syndromes: a report of the American College of Cardiology/American Heart Association Joint Committee on Clinical Practice Guidelines. Circulation. 2025;151:e771-862.
23. Britto FW. Recommendations for the management of ST-elevation myocardial infarction after reperfusion. Arch Peru Cardiol Cir Cardiovasc. 2025;6:154-61.
24. Widiarti W, Multazam C, Octaviana DS, et al. Appropriateness of fluid therapy in cardiogenic shock management: a systematic review of current evidence. Curr Probl Cardiol. 2024;49:102123.
25. Laghlam D, Benghanem S, Ortuno S, et al. Management of cardiogenic shock: a narrative review. Ann Intensive Care. 2024;14:45.
26. Donald DE, Essex HE. Massive destruction of the myocardium of the canine right ventricle; a study of the early and late effects. Am J Physiol. 1954;177:477-88.
27. Carroll R, Sharma N, Butt A, Hussain KM. Unusual electrocardiographic presentation of an isolated right ventricular myocardial infarction secondary to thrombotic occlusion of a non-dominant right coronary artery--a case report and brief review of literature. Angiology. 2003;54:119-24.
28. Nägele MP, Flammer AJ. Heart failure after right ventricular myocardial infarction. Curr Heart Fail Rep. 2022;19:375-85.
29. Sessler DI, Khanna AK. Perioperative myocardial injury and the contribution of hypotension. Intensive Care Med. 2018;44:811-22.
30. Tang Y, Liu S, Shi Y, et al. Association of blood pressure in the first-week of hospitalization and long-term mortality in patients with acute left ventricular myocardial infarction. Int J Cardiol. 2022;349:18-26.
31. Dafni U. Landmark analysis at the 25-year landmark point. Circ Cardiovasc Qual Outcomes. 2011;4:363-71.
32. Biswas S, Andrianopoulos N, Duffy SJ, et al. Impact of socioeconomic status on clinical outcomes in patients with ST-segment-elevation myocardial infarction. Circ Cardiovasc Qual Outcomes. 2019;12:e004979.
33. Wang Y, Gao X, Zhao Z, et al. The combined impact of Type D personality and depression on cardiovascular events after acute myocardial infarction. Psychol Med. 2023;53:1379-89.
34. Geller BJ, Sinha SS, Kapur NK, et al. Escalating and de-escalating temporary mechanical circulatory support in cardiogenic shock: a scientific statement from the American Heart Association. Circulation. 2022;146:e50-68.
35. Baron SJ, Chou JC, Shah T, et al. SCAI/EAPCI/ACVC expert consensus statement on cardiogenic shock in women. EuroIntervention. 2025;21:894-909.
36. Murugiah K, McDonagh TA, Cohen DJ, Dhruva SS. Mechanical circulatory support in acute myocardial infarction-cardiogenic shock: 2025 acute coronary syndrome guideline in context. J Am Coll Cardiol. 2025;85:2103-6.
Cite This Article
How to Cite
Download Citation
Export Citation File:
Type of Import
Tips on Downloading Citation
Citation Manager File Format
Type of Import
Direct Import: When the Direct Import option is selected (the default state), a dialogue box will give you the option to Save or Open the downloaded citation data. Choosing Open will either launch your citation manager or give you a choice of applications with which to use the metadata. The Save option saves the file locally for later use.
Indirect Import: When the Indirect Import option is selected, the metadata is displayed and may be copied and pasted as needed.
About This Article
Copyright

Data & Comments
Data
0


Comments
Comments must be written in English. Spam, offensive content, impersonation, and private information will not be permitted. If any comment is reported and identified as inappropriate content by OAE staff, the comment will be removed without notice. If you have any queries or need any help, please contact us at [email protected].