


fig7
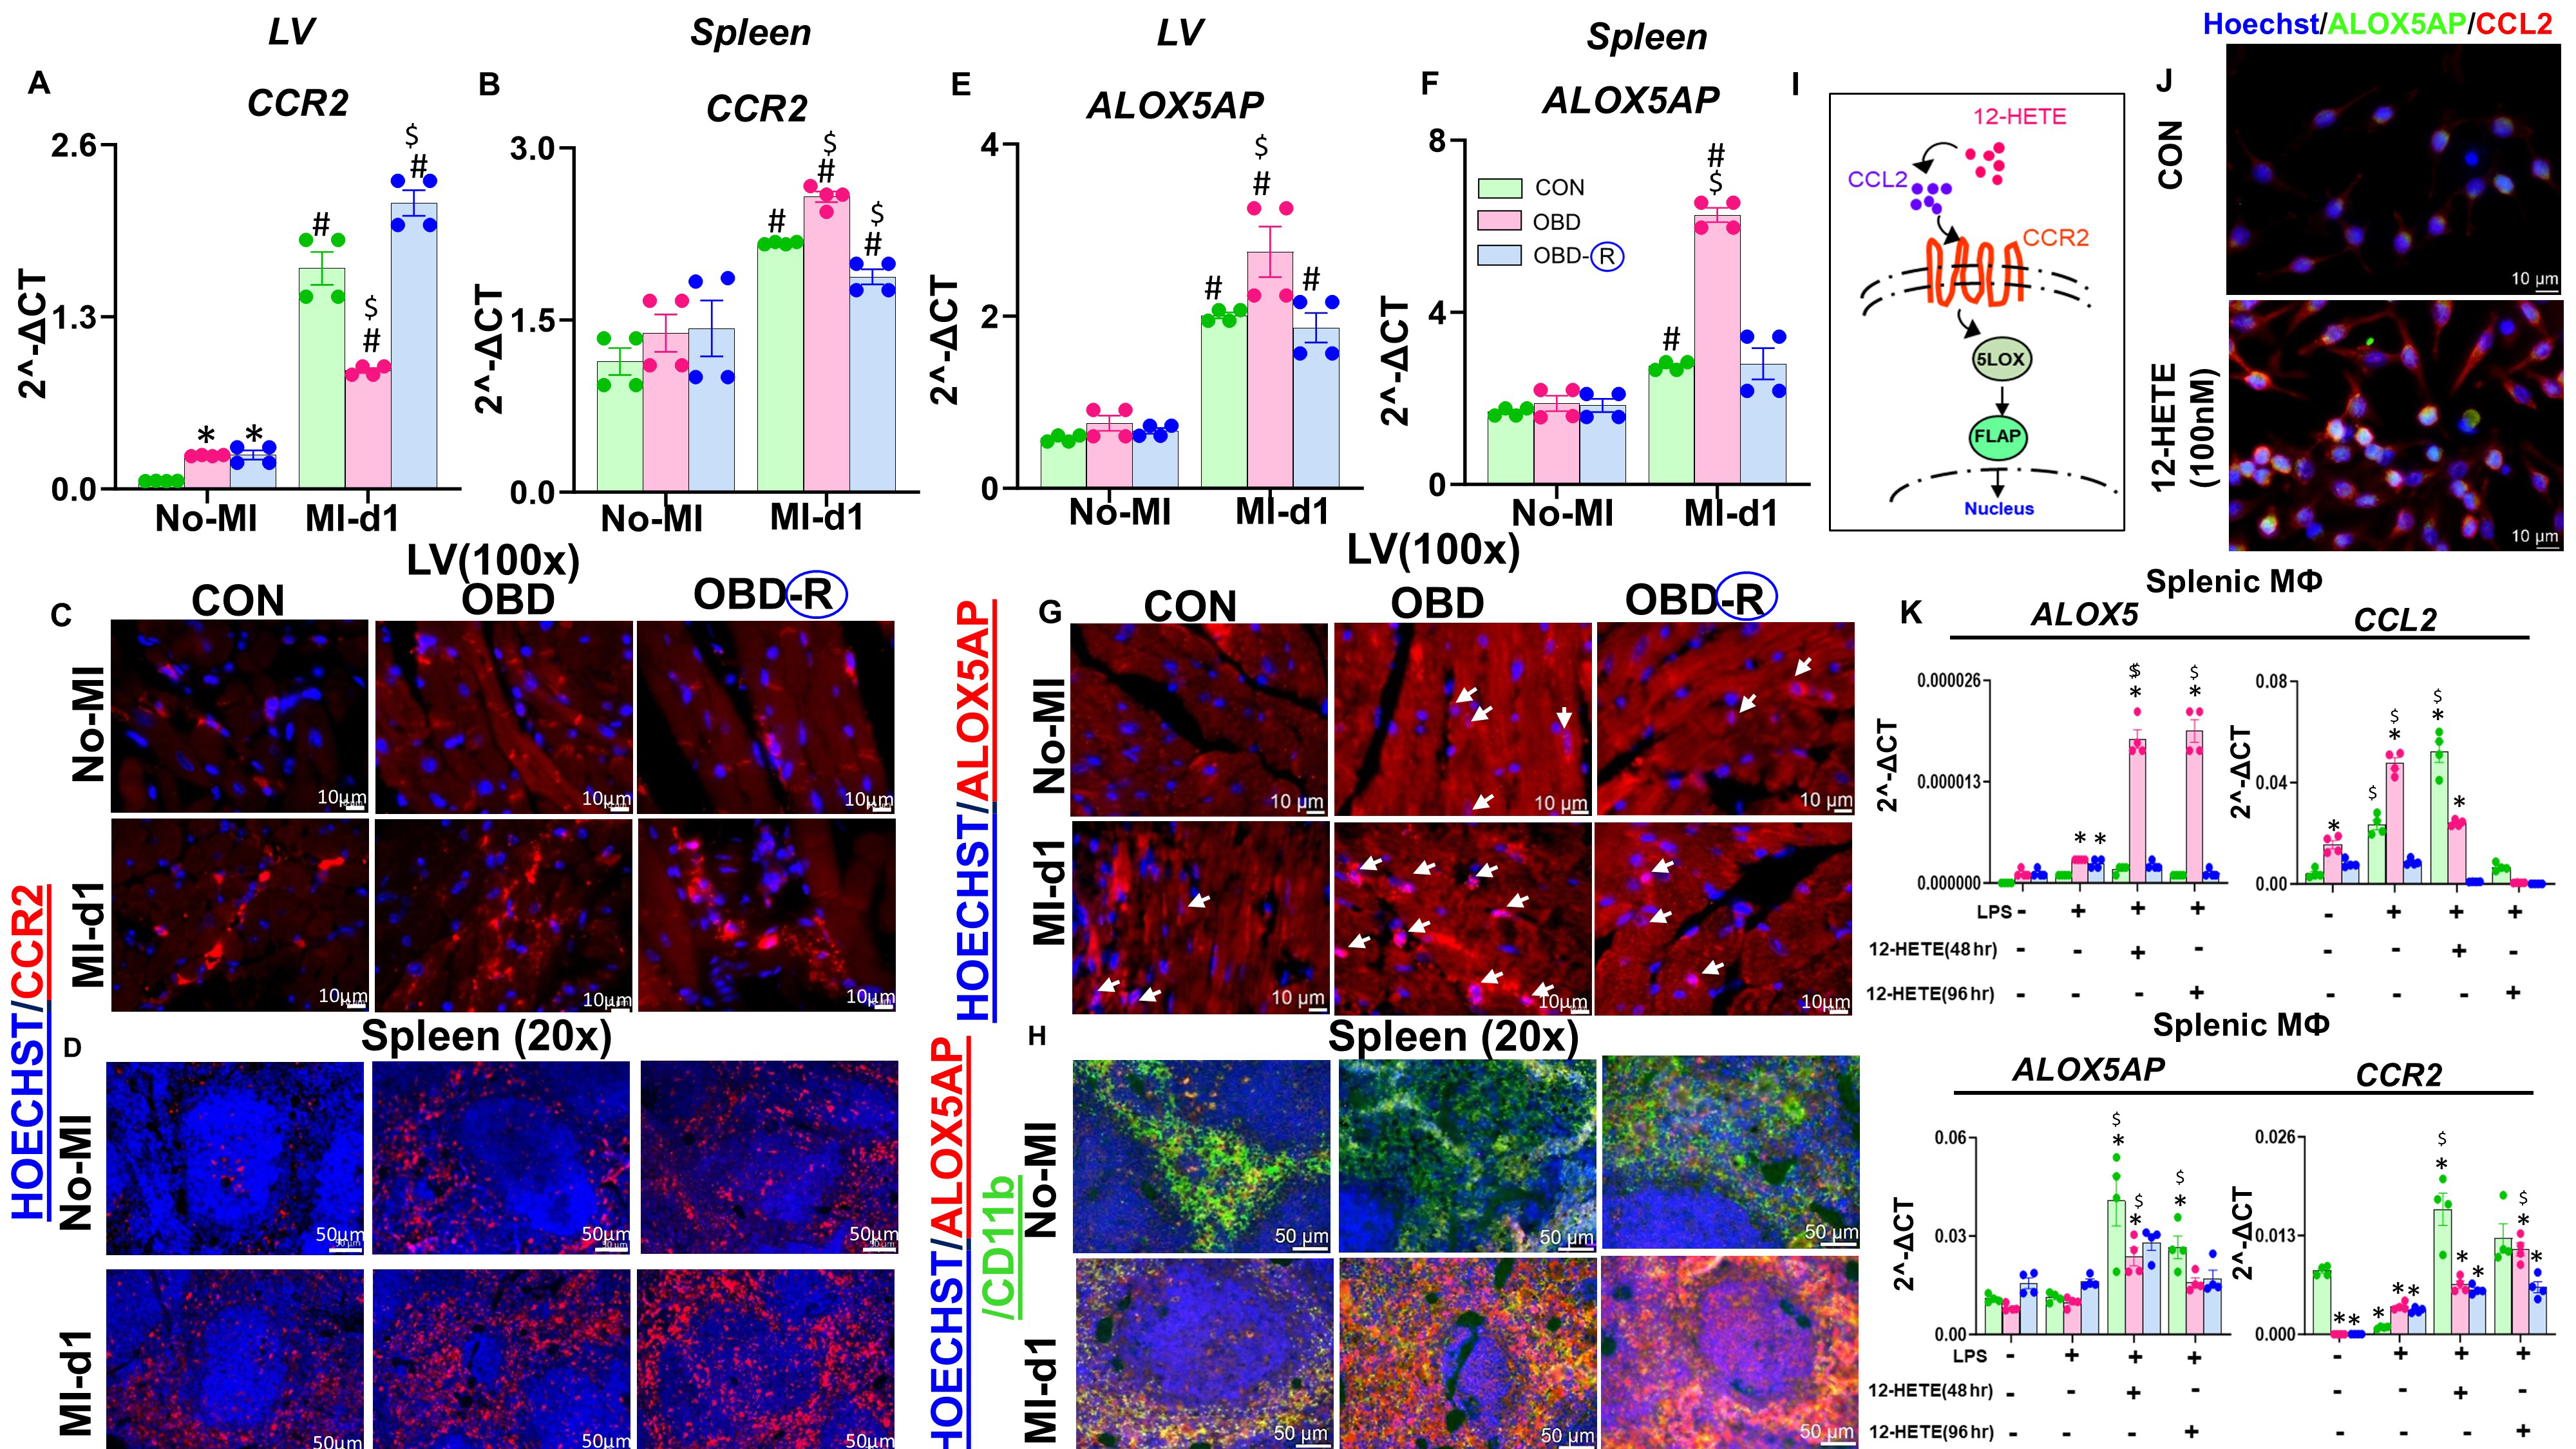
Figure 7. Obesogenic diet reprograms macrophages through CCR2 and ALOX5AP activation. (A and B) CCR2 mRNA expression in LV and spleen samples from CON (10 months of lab chow), OBD (10 months of omega-6-enriched diet), and OBD-R (10 months of OBD diet + 4 months of CON diet) groups under no-MI and post-MI-d1 conditions; (C) Representative immunofluorescence images showing CCR2 (red) expression in the LV of CON, OBD, and OBD-R mice under no-MI and post-MI-d1 conditions. Nuclei are counterstained with Hoechst (blue). Magnification, 100×. Scale bar, 10 μm; n = 3/group; (D) Representative immunofluorescence images showing CCR2 (red) expression in spleens of CON, OBD, and OBD-R mice under no-MI and post-MI-d1 conditions. Nuclei are counterstained with Hoechst (blue). Magnification, 20×. Scale bar, 50 μm; n = 3/group; (E and F) ALOX5AP mRNA expression in LV and spleen samples from CON, OBD, and OBD-R mice under no-MI and post-MI-d1 conditions; (G) Representative immunofluorescence images showing ALOX5AP (red) expression in the LV of CON, OBD, and OBD-R mice under no-MI and post-MI-d1 conditions. Nuclei are counterstained with Hoechst (blue). White arrows indicate nuclear localization (pink). Magnification, 100×. Scale bar, 10 μm; n = 3/group; (H) Representative immunofluorescence images showing ALOX5AP (red) and CD11b (green) expression in spleens of CON, OBD, and OBD-R mice under no-MI and post-MI-d1 conditions. Nuclei are counterstained with Hoechst (blue). Magnification, 20×. Scale bar, 50 μm; n = 3/group; (I) Graphical representation of the ALOX5AP pathway activated by 12-HETE; (J) Representative immunofluorescence images showing ALOX5AP (green) and CCL2 (red) expression in RAW 264.7 cells, untreated or treated with


