


fig4
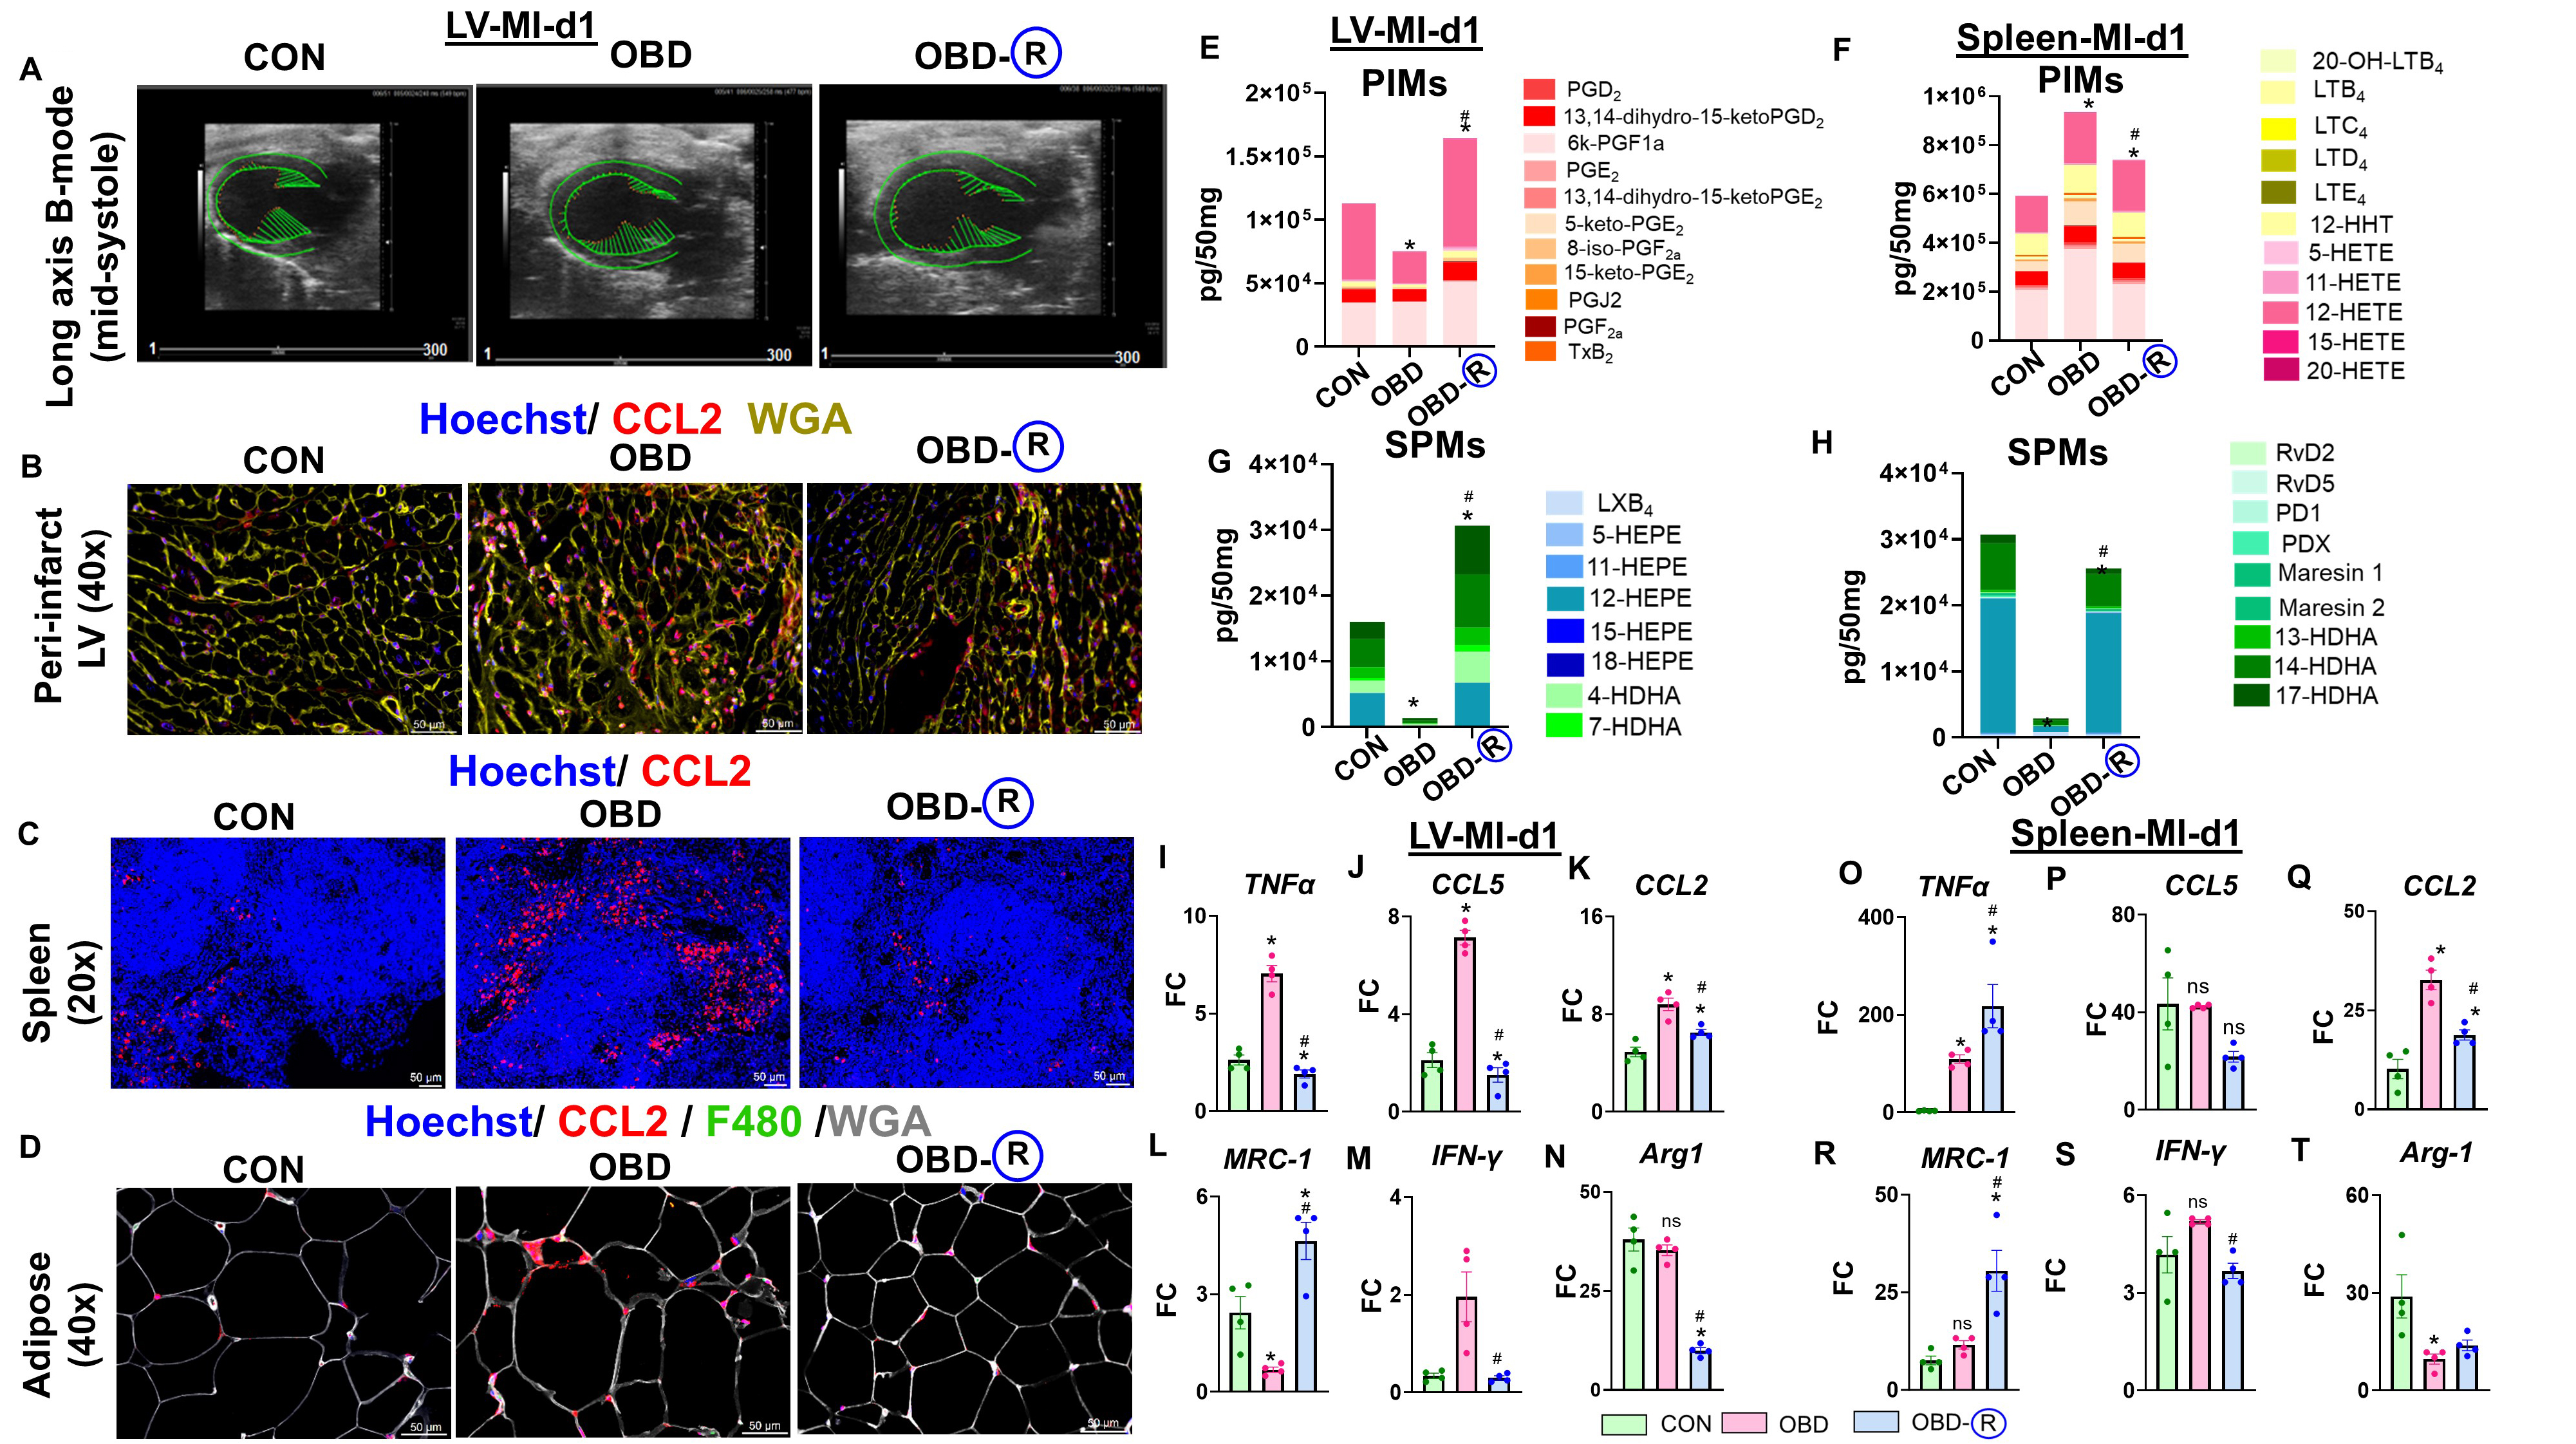
Figure 4. OBD intake fails to initiate physiological acute inflammation-resolution signaling in the spleen and infarcted LV post-MI. (A) Representative long-axis B-mode images showing longitudinal strain in the left ventricular (LV) of CON (10 months of lab chow), OBD (10 months of omega-6-enriched diet), and OBD-R (10 months of OBD diet + 4 months of CON diet) mice at day 1 post-MI. Representative immunofluorescence showing; (B) CCL2 expression (red) with cardiomyocyte area (WGA, yellow) in LV; (C) CCL2 (red) in spleen; (D) CCL2 (red), F4/80 (green), and WGA (white) in adipocytes of CON, OBD, and OBD-R mice. Nuclei were counterstained with Hoechst (blue); Magnification, 40× (LV, adipose) and 20× (spleen). Scale bar, 50 μm. Stacked graphs showing average (E) PIMs and (F) SPMs in LV at day 1 post-MI; Stacked graphs showing average (G) PIMs and (H) SPMs in the spleen at day 1 post-MI. Quantification values are expressed as pg/50 mg tissue (LV and spleen). Detection limit was ≈ 1 pg (mass spectrometry); mRNA expression of proinflammatory cytokines (I) TNF-α, (J) CCL5, (K) CCL2 in LV; pro-resolving cytokines (L) MRC-1; (M) IFN-γ, (N) Arg-1 in LV; proinflammatory cytokines (O) TNF-α, (P) CCL5, (Q) CCL2 in spleen; pro-resolving cytokines (R) MRC-1, (S) IFN-γ, (T) Arg-1 in LV at day 1 post-MI. Data are presented as fold change (FC) relative to CON-d0 (No-MI, FC = 1), with normalization to Hprt-1. Group comparisons were analyzed using one-way ANOVA with Tukey’s multiple comparisons test. *P < 0.05 vs. CON, #P < 0.05 vs. OBD. Data are presented as mean ± SEM; n = 4/group, ns: non-significant. MI: Myocardial infarction; SPMs: specialized pro-resolving mediators; PIMs: proinflammatory mediators; CON: control diet; OBD: obesogenic diet; SEM: standard error of the mean; WGA: wheat germ agglutinin.


