
fig3
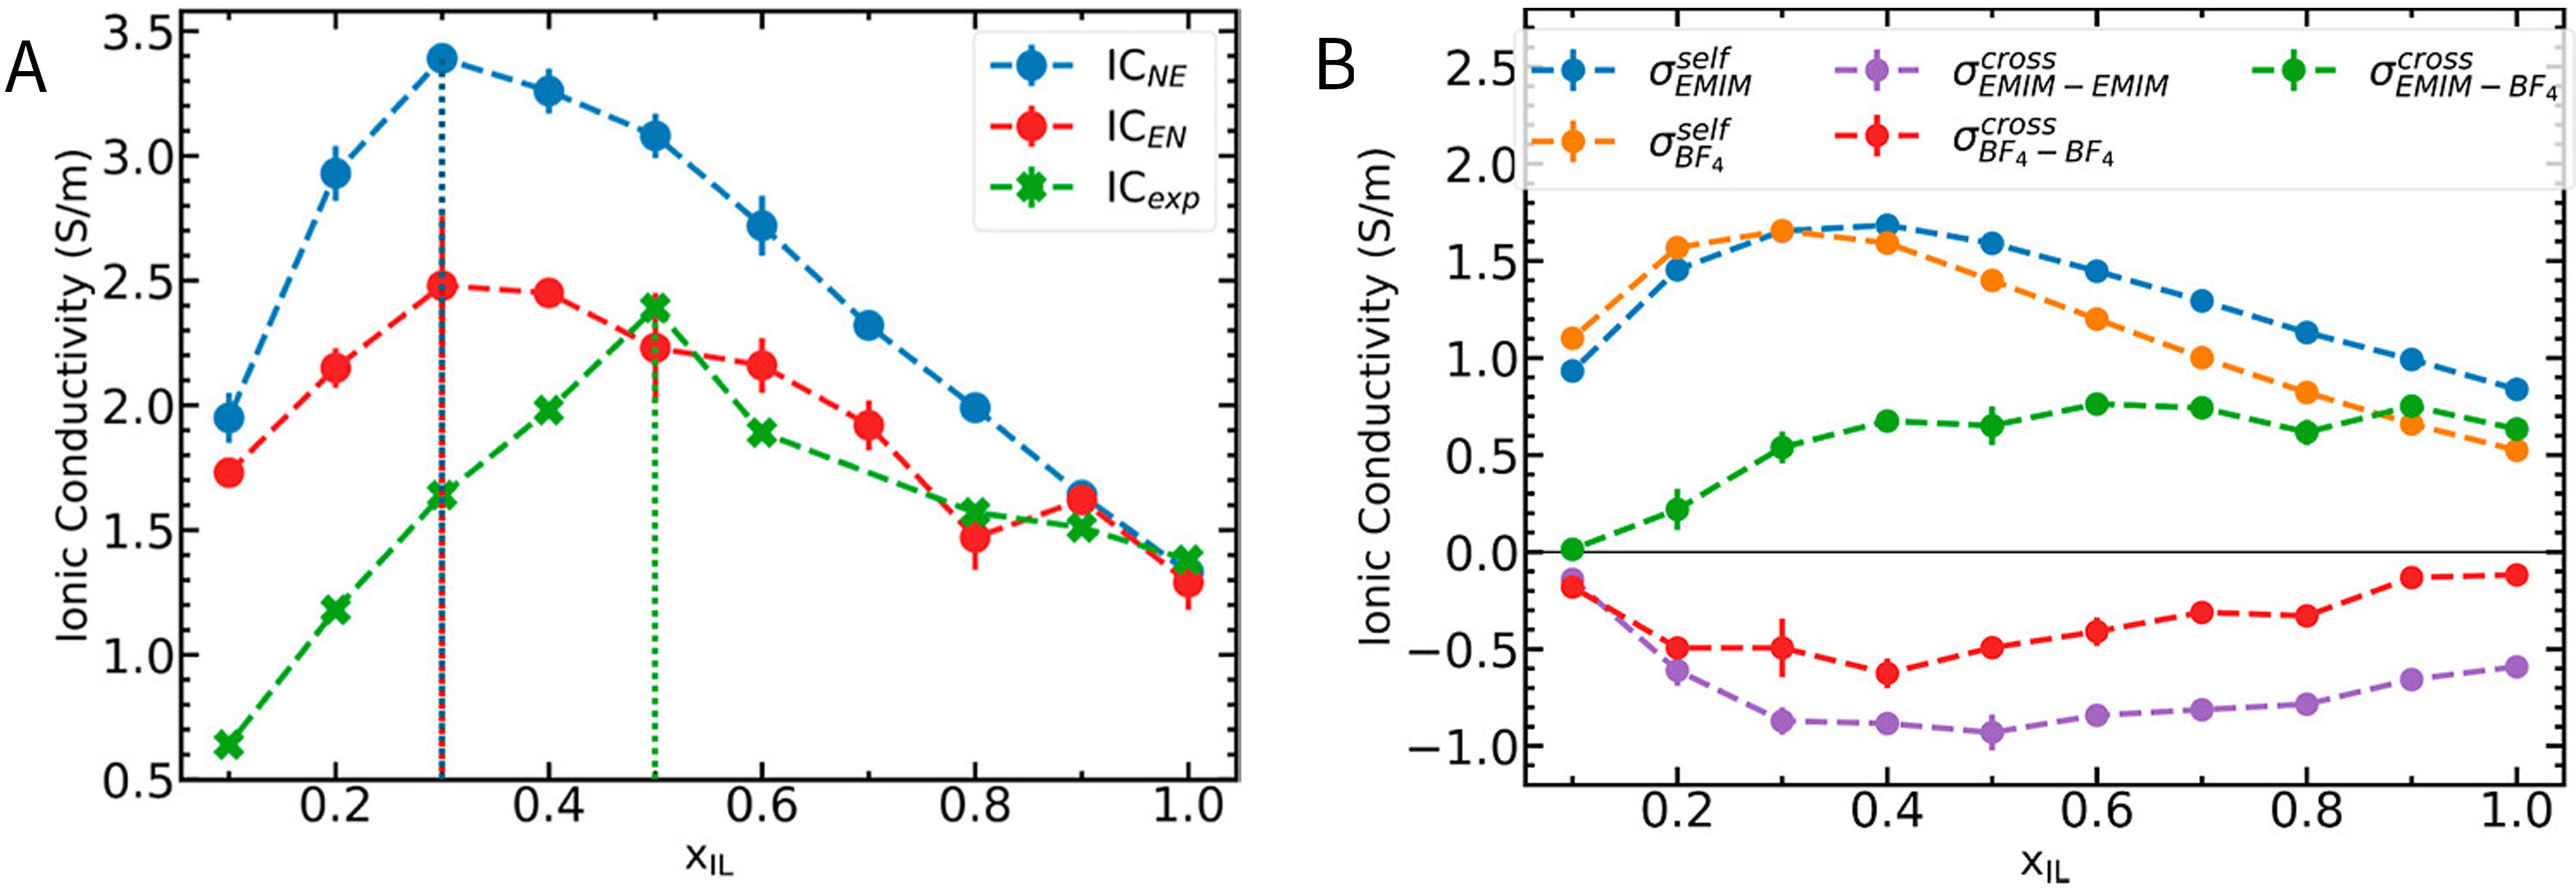
Figure 3. Relationship between ionic conductivity and mole fraction of ILs. (A) Trends in ionic conductivity as a function of the [EMIM][BF4] concentration at 298 K. Nernst-Einstein conductivity (ICNE) and Einstein conductivity (ICEN) compared with experimental values (ICexp). Vertical lines indicate mole fractions with peak conductivity values; (B) Contribution to ionic conductivity from self-correlation of cations (blue) and anions (orange); and cross-correlation between cation-cation (purple), anion-anion (red), and cation-anion (green). (A and B) are adapted from ref.[92], under the CC BY 4.0 license; two source figures were cropped and arranged side-by-side without alteration to the depicted data. IL: ionic liquid; [EMIM]: 1-Ethyl-3-methylimidazolium; [BF4]: tetrafluoroborate.