

fig1
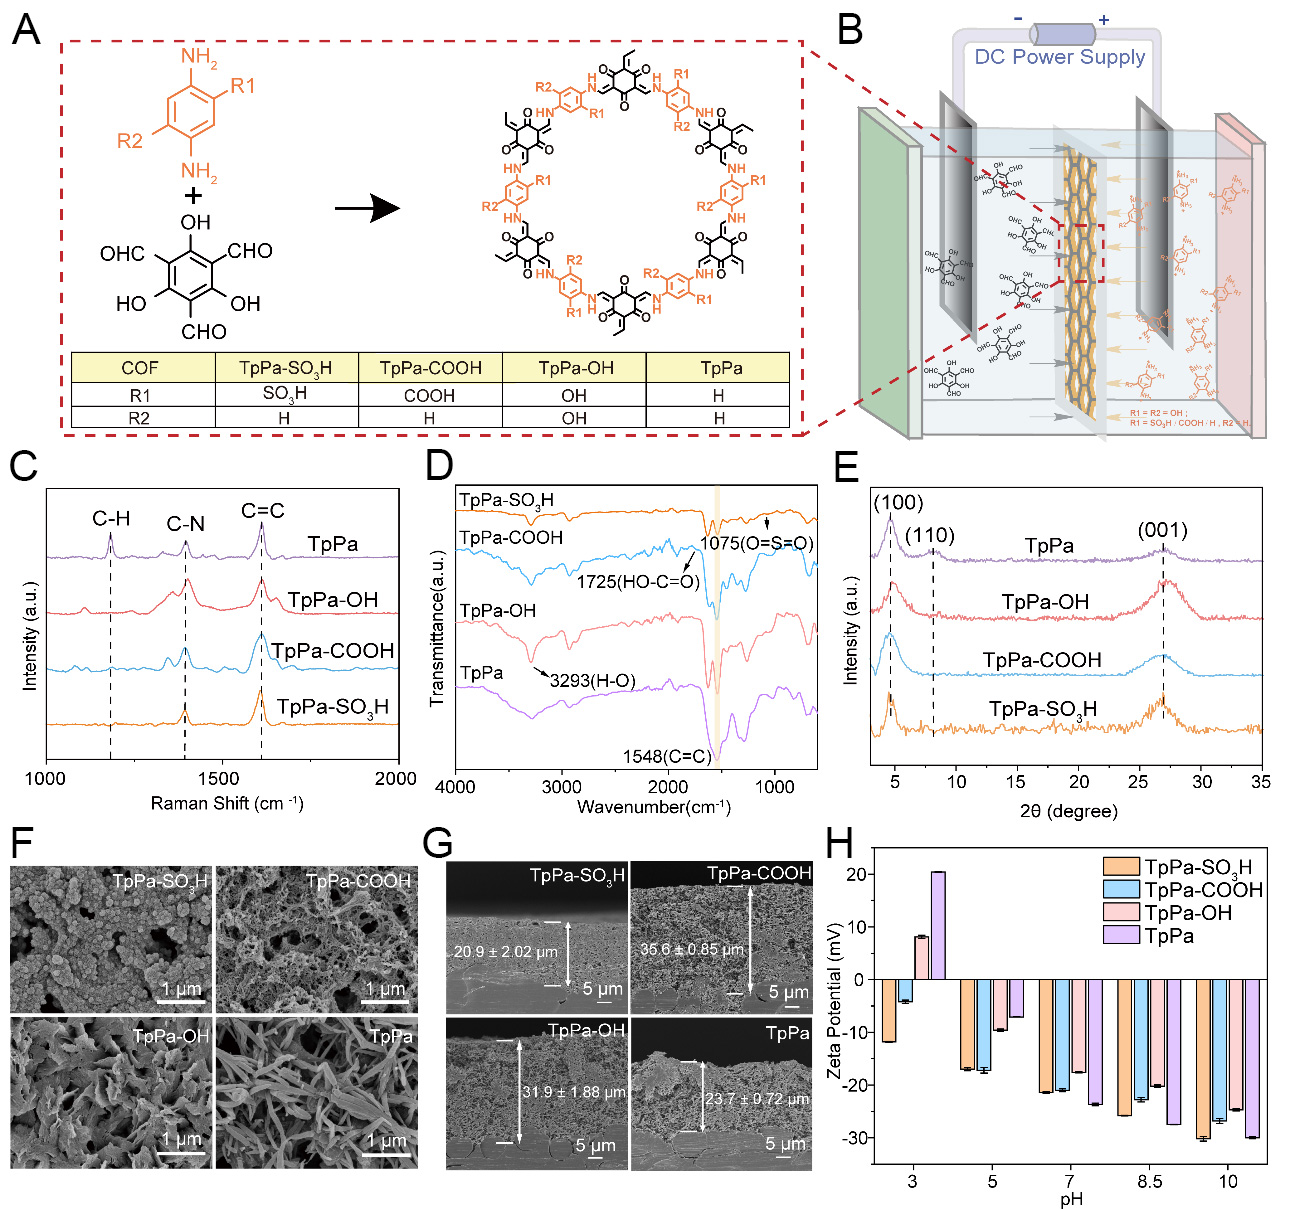
Figure 1. (A) Chemical structures of TpPa and TpPa-R; (B) Schematic diagram of the electric-field-assisted interfacial polymerization process; (C) Raman spectra, (D) FTIR spectra, and (E) XRD patterns of the TpPa and TpPa-R membranes; (F) Top-view and (G) cross-sectional SEM images; (H) Ζeta (ζ) potentials of TpPa and TpPa-R membranes as a function of pH from 3 to 10. Membrane thicknesses in panel (G) are given as mean ± standard deviation, and error bars in panel (H) represent the standard deviation obtained from three independent measurements for each sample. COF: Covalent organic framework; DC: Direct current; FTIR: Fourier transform infrared; XRD: X-ray diffraction; SEM: scanning electron microscopy.