

fig2
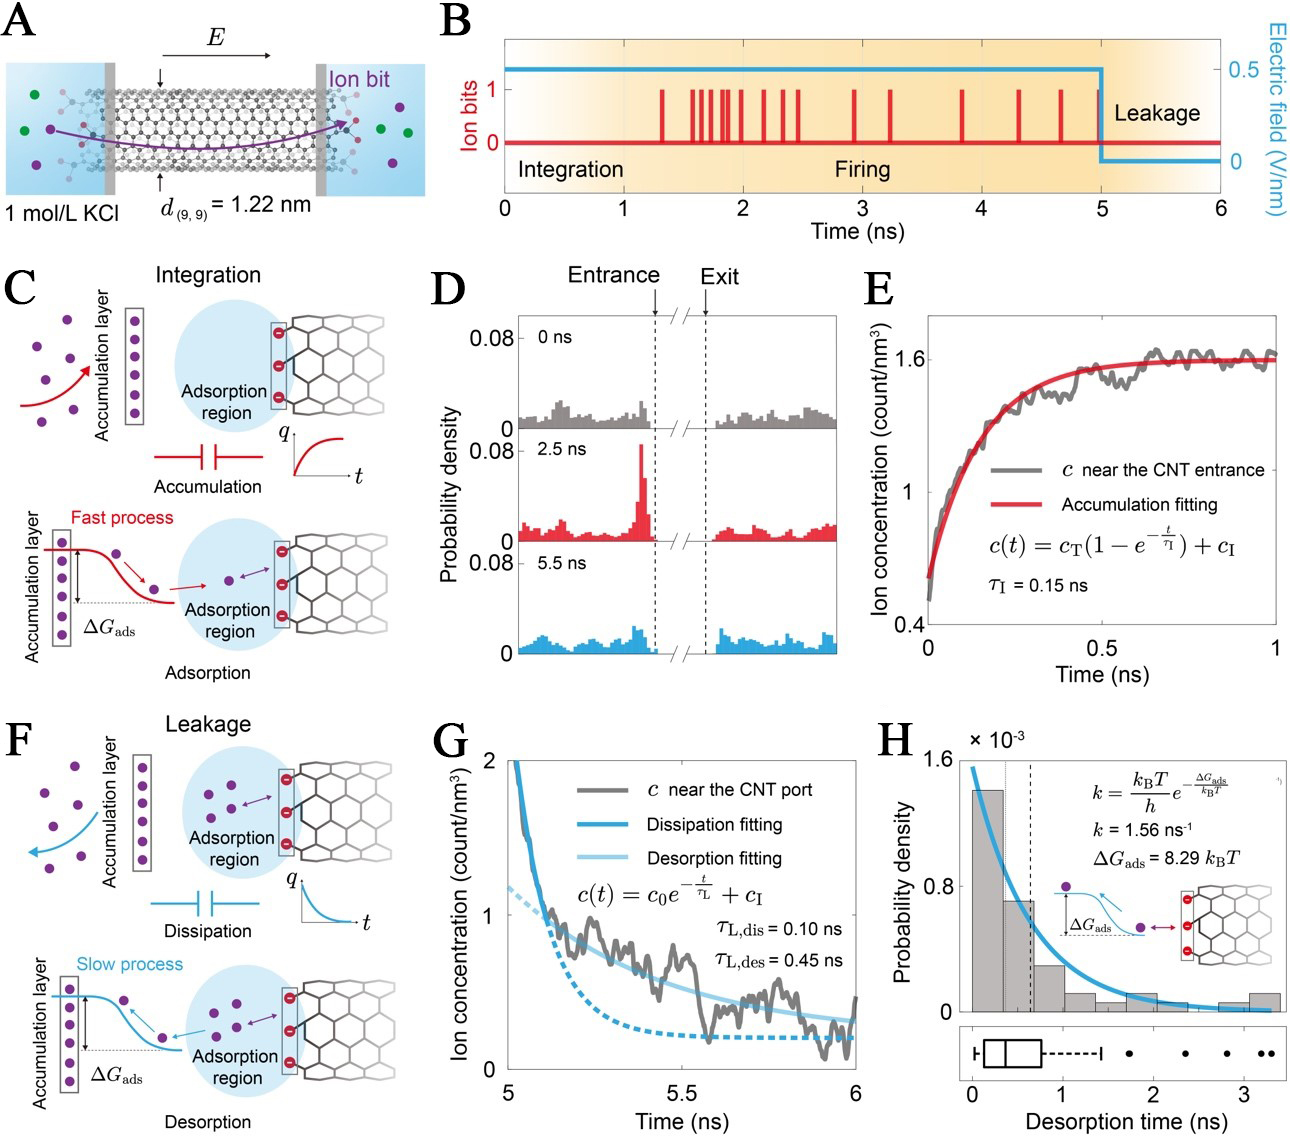
Figure 2. Physical basis of the integration and leakage dynamics in the iontronic neuron. (A) A (9,9) single-walled CNT with a diameter d(9,9) = 1.22 nm connects two reservoirs containing 1 mol/L KCl solution. An external electric field (E) is applied to drive ion transport, generating discrete ionbits; (B) The timeline is divided into three phases, including integration (ion accumulation without firing), firing (stochastic generation of ionbits under E), and leakage (ion dissipation after E is removed at t = 5 ns); (C) Driven by the field, ions migrate to the accumulation layer and become trapped in the Adsorption region due to the adsorption energy barrier (ΔGads). This process is analogous to charging a capacitor (q vs. t); (D) Probability density of ions near the entrance at different times, showing a clear build-up of concentration under an applied field; (E) Local ion concentration [c(t)] near the CNT entrance as a function of time, fitted to an exponential accumulation model (

