

fig4
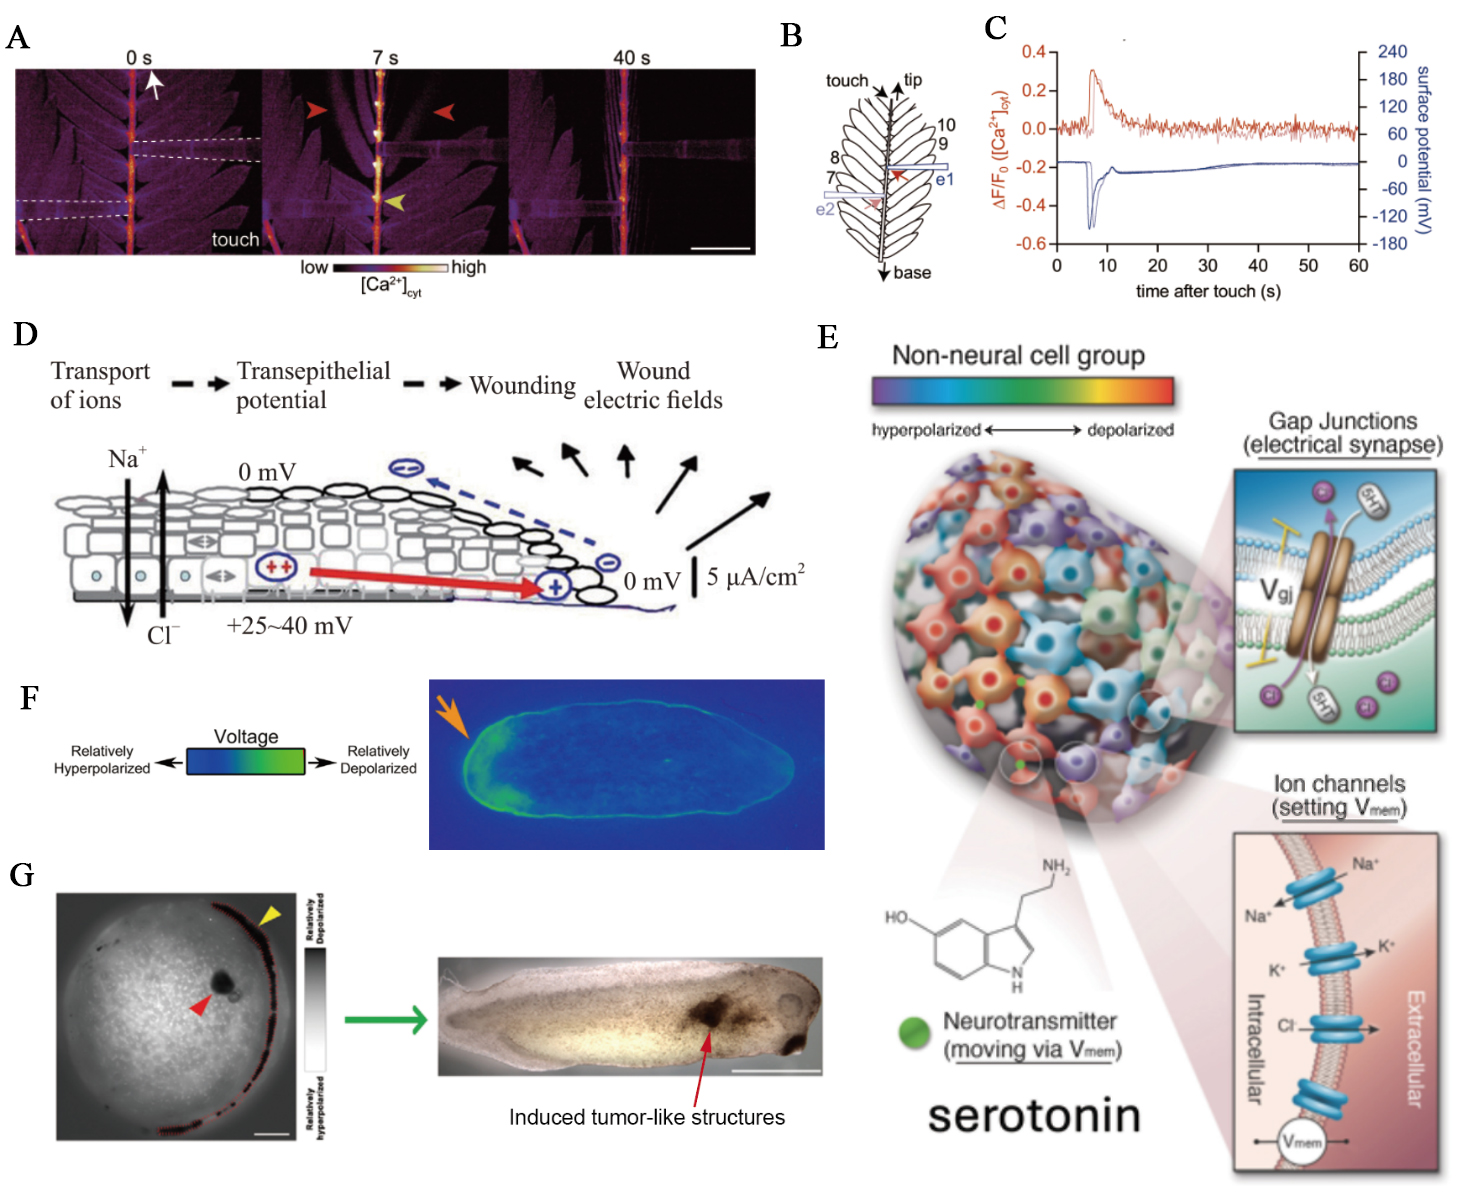
Figure 4. Ionic mechanisms in tissue-scale bioelectric signaling. (A-C) Coupled Ca2+ and electrical signaling in Mimosa pudica: (A) simultaneous imaging and electrophysiology showing that gentle touch (white arrow, 0 s) evokes a cytosolic Ca2+ rise (yellow arrowhead) accompanied by leaflet movement (red arrowhead) (scale bar, 5 mm); (B) schematic of the experimental setup showing electrode positions (blue rectangles e1, e2) and regions of interest (red arrows) 1 mm from the electrodes; (C) changes in [Ca2+]cyt and surface potential in response to touch. These figures are quoted with permission from Hagihara et al.[16]; (D) In animal epithelia, disruption of the barrier collapses the transepithelial potential, generating a lateral electric field that directs cell migration and wound closure. This figure is quoted with permission from Jia et al.[17]; (E) Developing tissues form bioelectric networks where ion channels and gap junctions establish structured voltage domains that guide morphogenesis. This figure is quoted with permission from Hansali et al.[71]; (F) Voltage gradient across the anterior/posterior axis of planarian flatworms, visualized by a bioelectric reporter dye, which determines the location and number of heads. Orange arrowhead indicates a depolarised region, which will develop a head. This figure is quoted with permission from Durant et al.[72] (G) Early depolarised focus predicts a later tumor-like outgrowth. Left, membrane-potential imaging shows a localized depolarised region (red arrowhead). Depolarisation along the neural tube (yellow arrowhead) marks the characteristic bioelectric pattern of neurulation. Right, the embryo later develops an induced tumor-like structure at the position corresponding to the earlier depolarised focus. Scale bars: 150 μm (left); 1 mm (right). This figure is quoted with permission from Chernet et al.[73]. [Ca2+]cyt: Cytosolic Ca2+ concentration; Vmem: membrane potential.

