
fig3
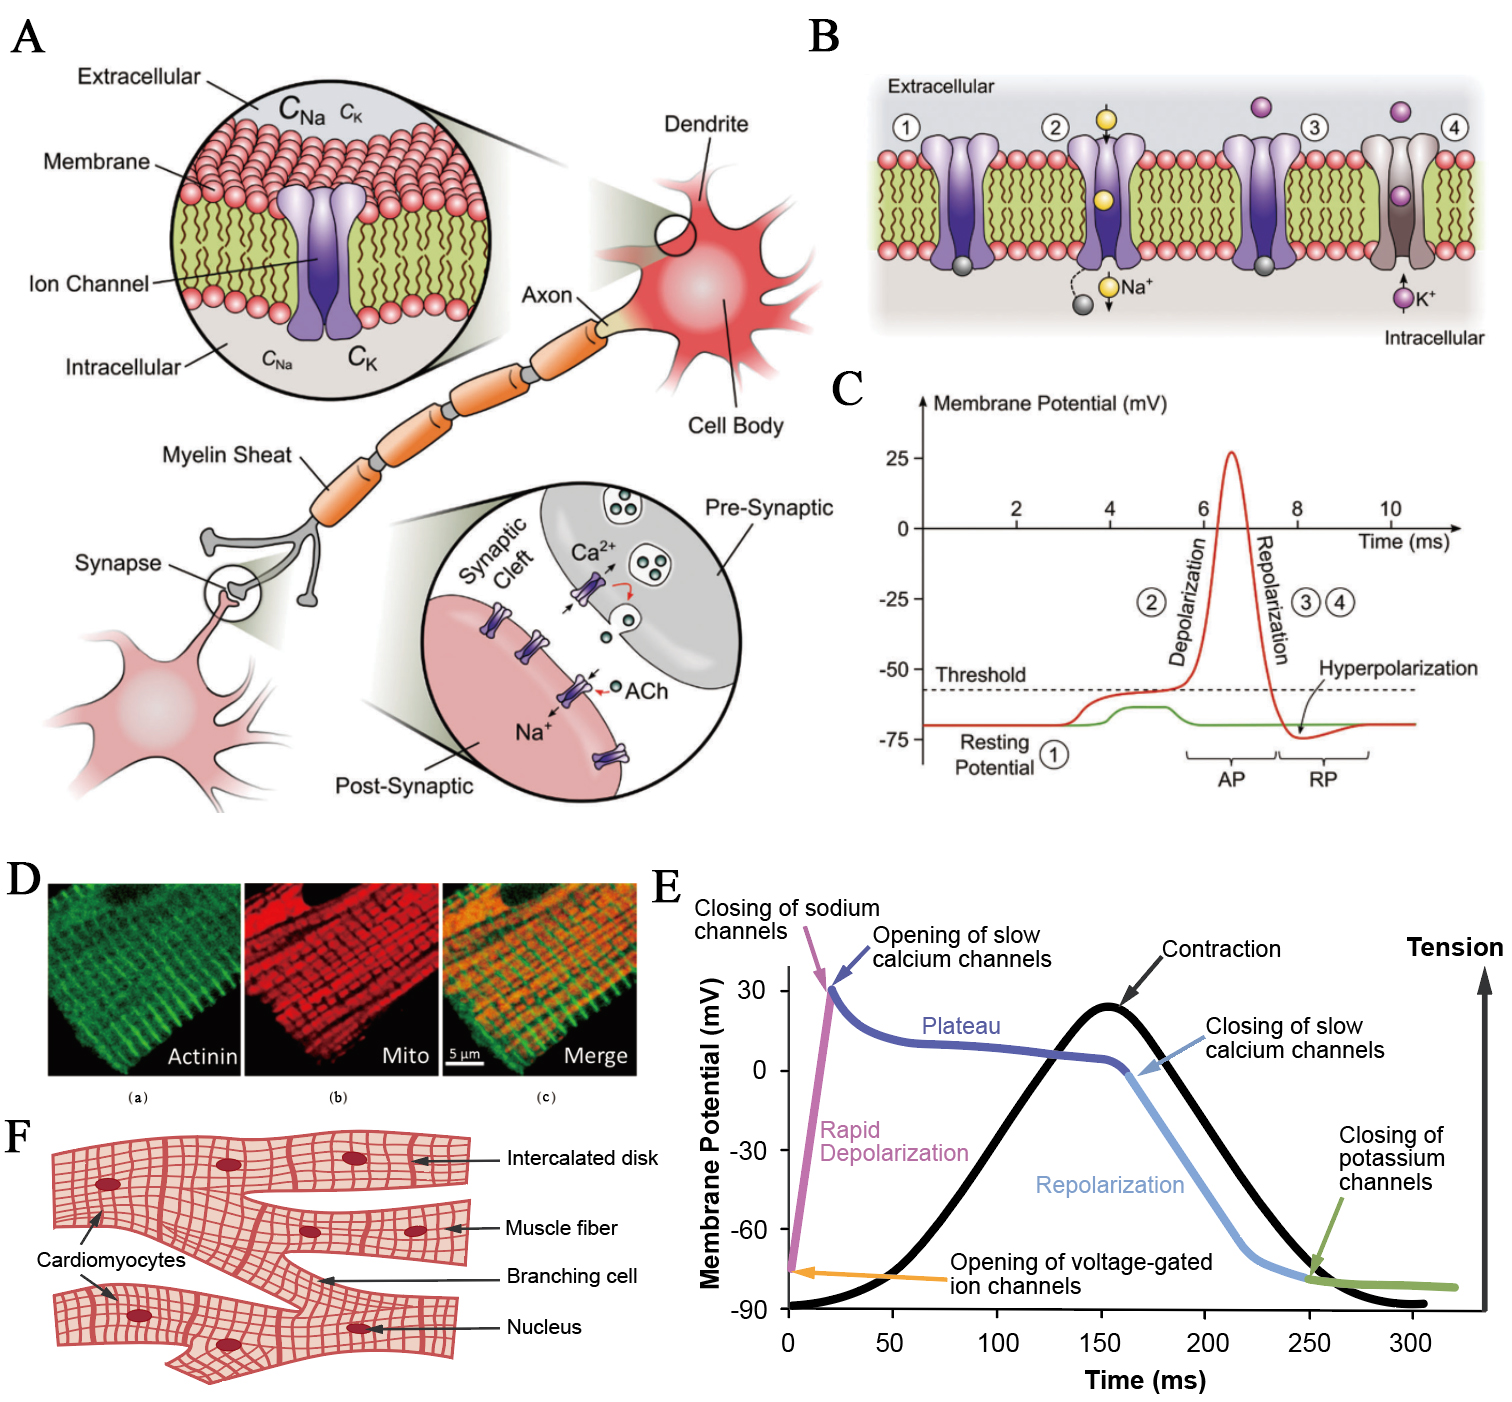
Figure 3. Ionic mechanisms in the electrophysiological activities of excitable cells. (A) A synaptic connection between two neurons. The upper inset shows the cross-section of a neuronal membrane with extracellular and intracellular ionic environments, while the bottom inset magnifies the synaptic cleft, highlighting vesicular neurotransmitter release and postsynaptic ion-channel activation. This figure is quoted with permission from Chen et al.[57]; (B) Sequential states of voltage-dependent Na+ and K+ channels during the generation of an action potential, showing membrane depolarisation, Na+ channel activation, and subsequent K+-mediated repolarisation. This figure is quoted with permission from Chen et al.[57]; (C) Transient membrane potential trace of a neuron illustrating an all-or-none action potential (red), by comparison with a subthreshold stimulus that fails to trigger firing (green). This figure is quoted with permission from Chen et al.[57]; (D) Simultaneous fluorescent and immunofluorescent confocal imaging analysis of mitochondria and sarcomeric Z-line (actinin) tubulin beta-II in rat cardiomyocyte. (a): Z-line (actinin); (b): Mitochondria; (c): Merge image. Scale bar, 5 µm. This figure is quoted with permission from Kuznetsov et al.[58]; (E) Ionic basis of the cardiac action potential and excitation-contraction coupling; (F) Structure of intercalated disks connecting adjacent cardiomyocytes. Gap junctions within these regions enable direct ionic current flow, ensuring synchronous propagation of action potentials and coordinated contraction across the cardiac syncytium. AP: Action potential; RP: resting potential; ACh: acetylcholine.

