

fig7
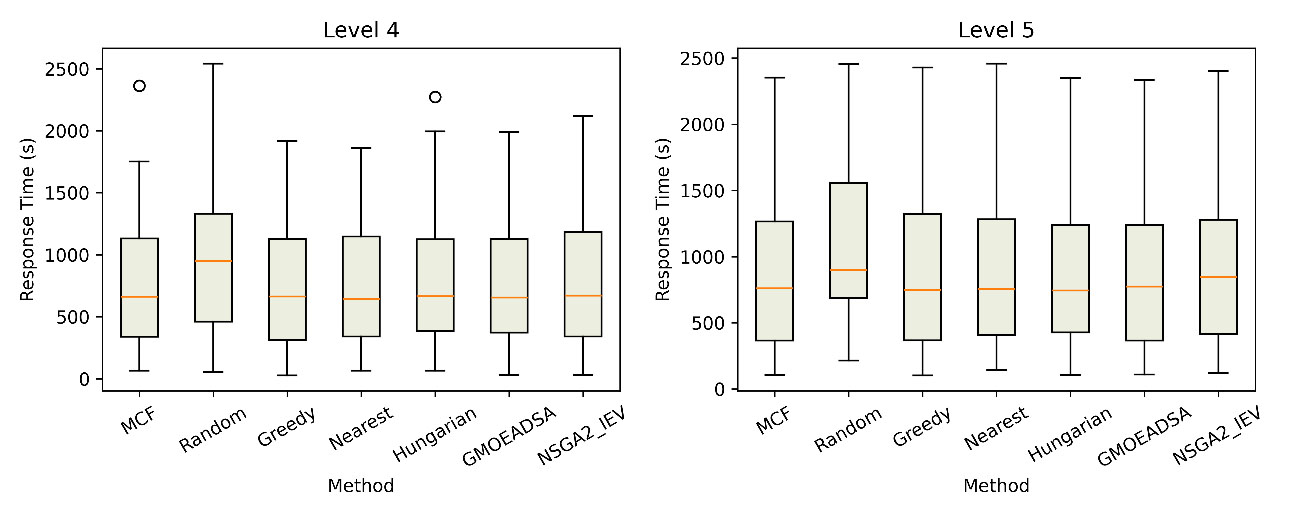
Figure 7. Response time distributions under high-level tasks (Levels 4–5). Each group contains n = 200 samples. The boxes represent the interquartile range (IQR, 25th–75th percentiles), the central lines indicate the median, the whiskers extend to the most extreme data points within 1.5 times the IQR from the lower and upper quartiles, and the circles represent outliers beyond the whiskers. MCF: Minimum Cost Flow; G-MOEA/D-SA: Multiobjective Evolutionary Algorithm Based on Decomposition Using Simulated Annealing; NSGA-II-IEV: Non-dominated Sorting Genetic Algorithm II for the Integrated Emergency Vehicle Scheduling Model.

