

fig1
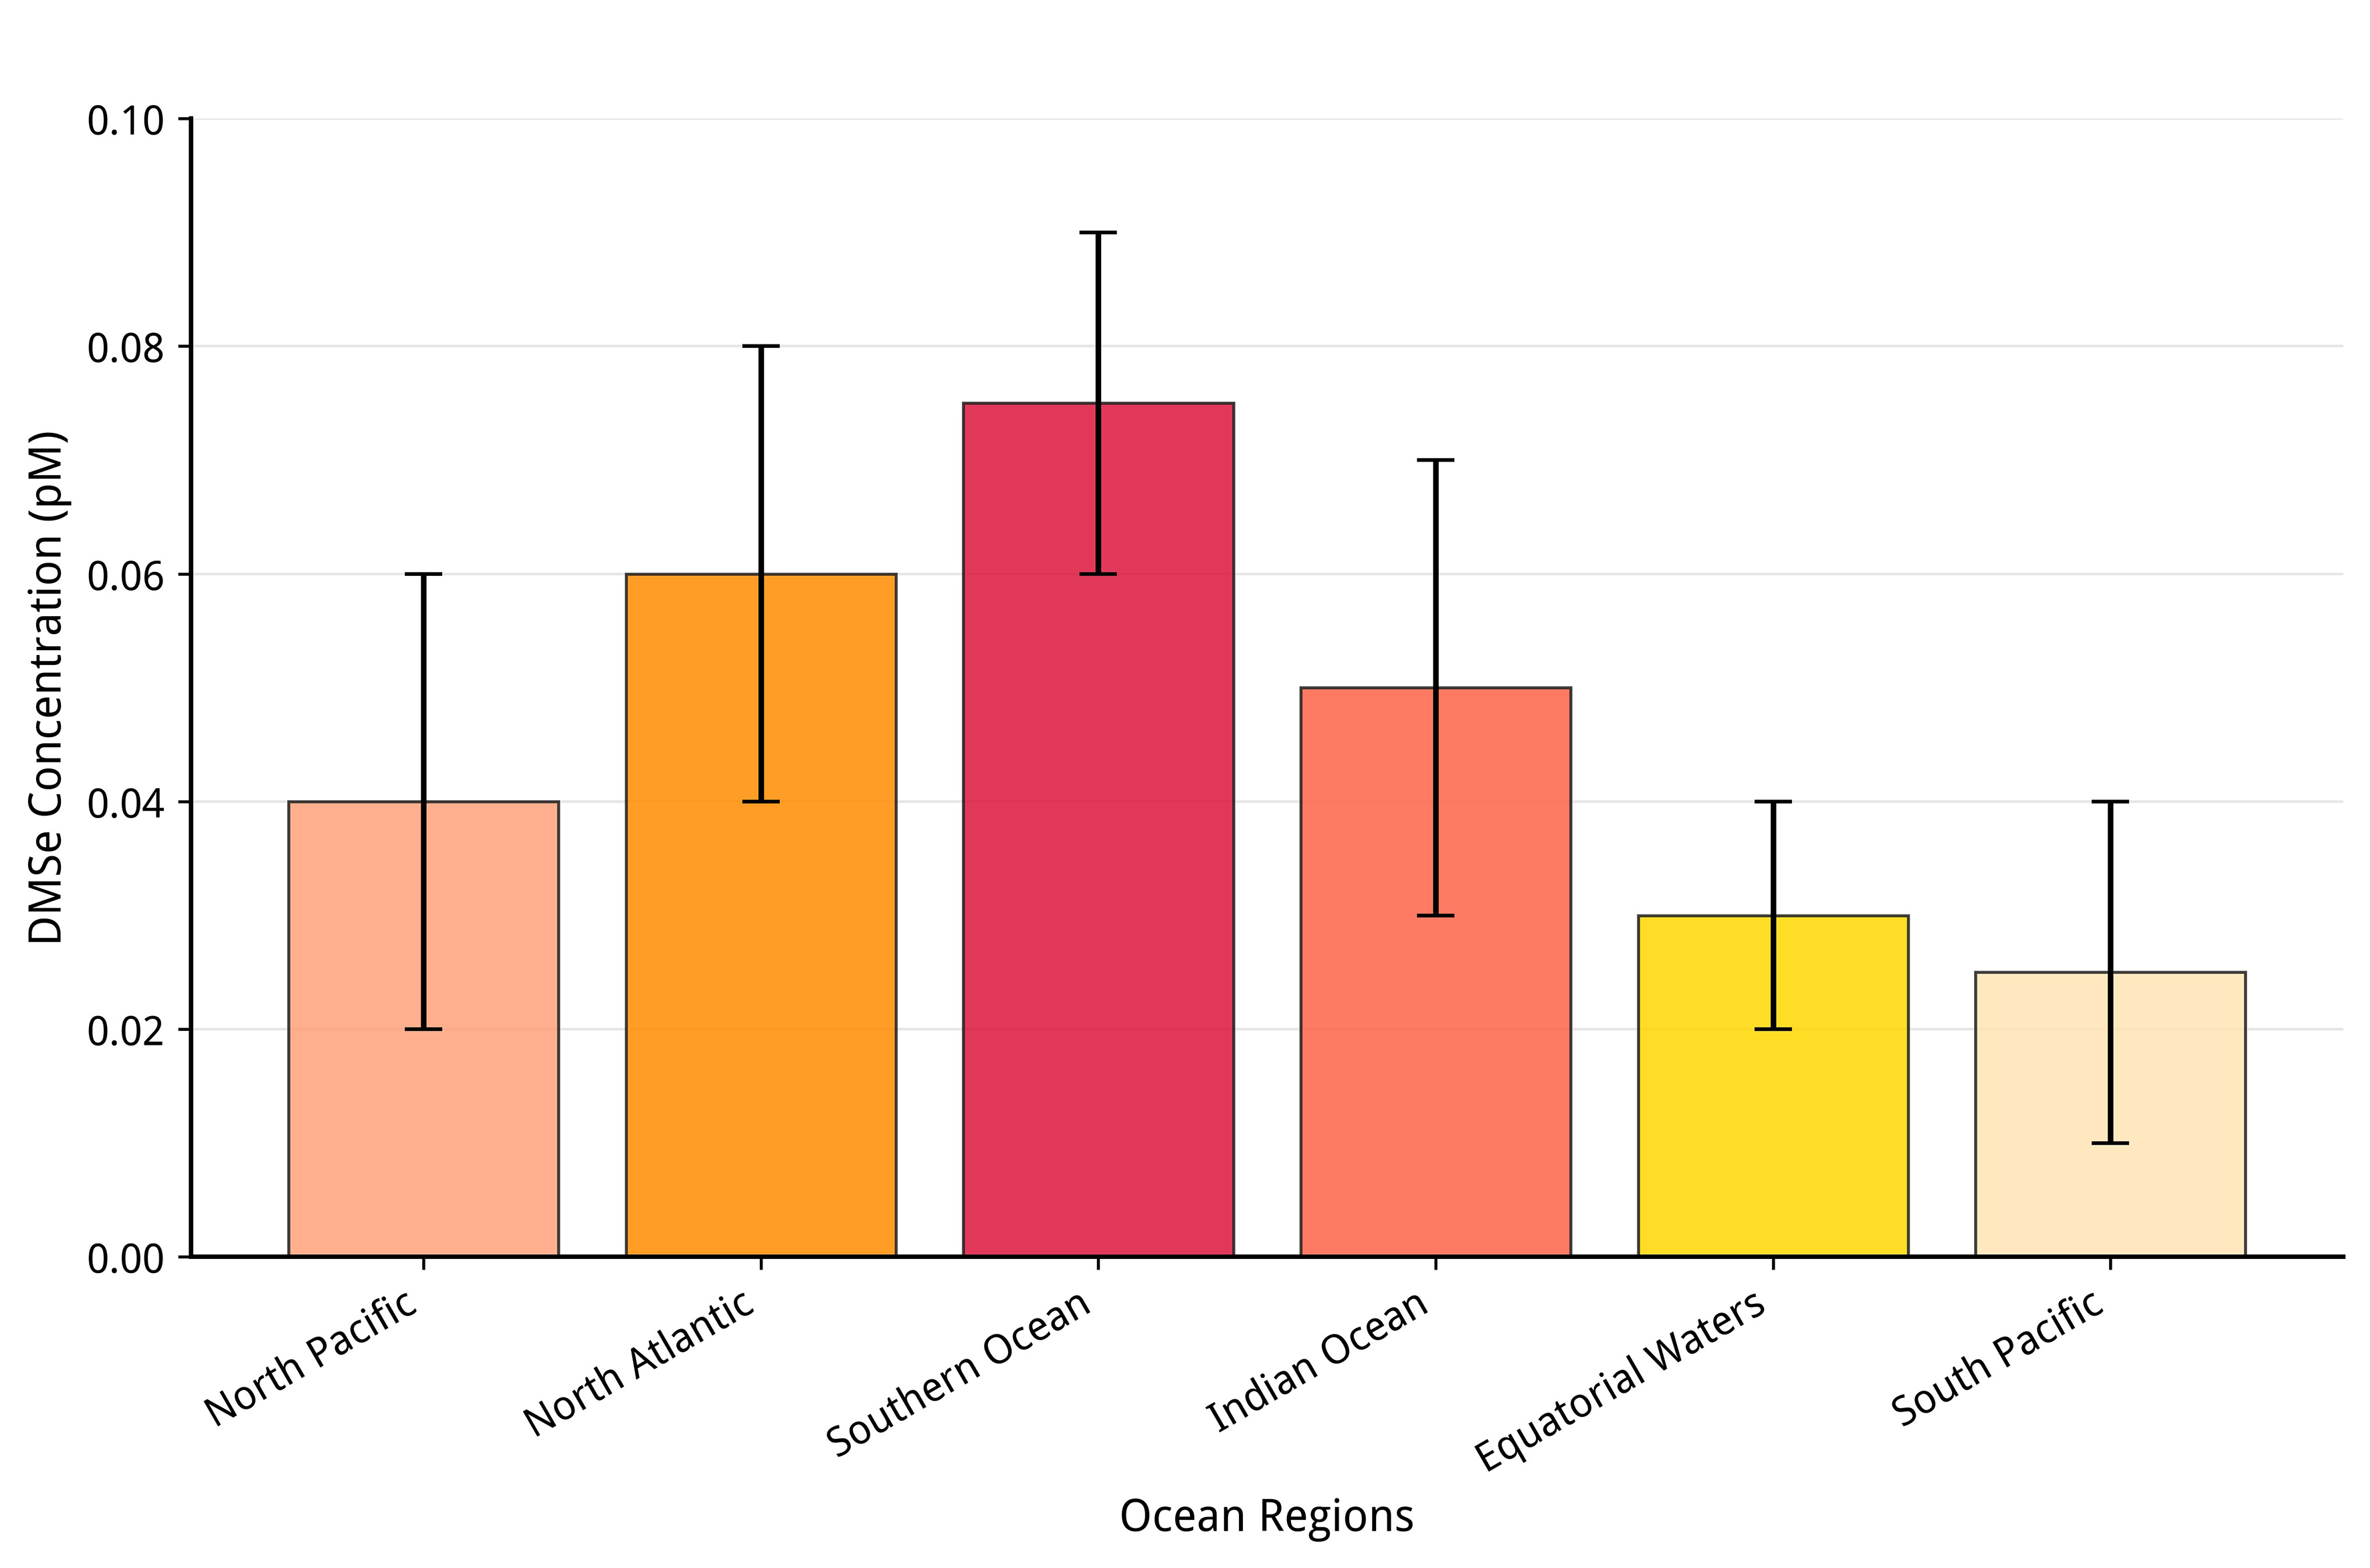
Figure 1. Bar chart showing the mean DMSe concentrations (pM) across different ocean regions based on data from reference[20], obtained using the SOCOL-AERv2 model. Vertical error bars represent the uncertainty range (standard deviation or min-max spread) derived from sensitivity analyses. DMSe: Dimethyl selenide.

