

fig14
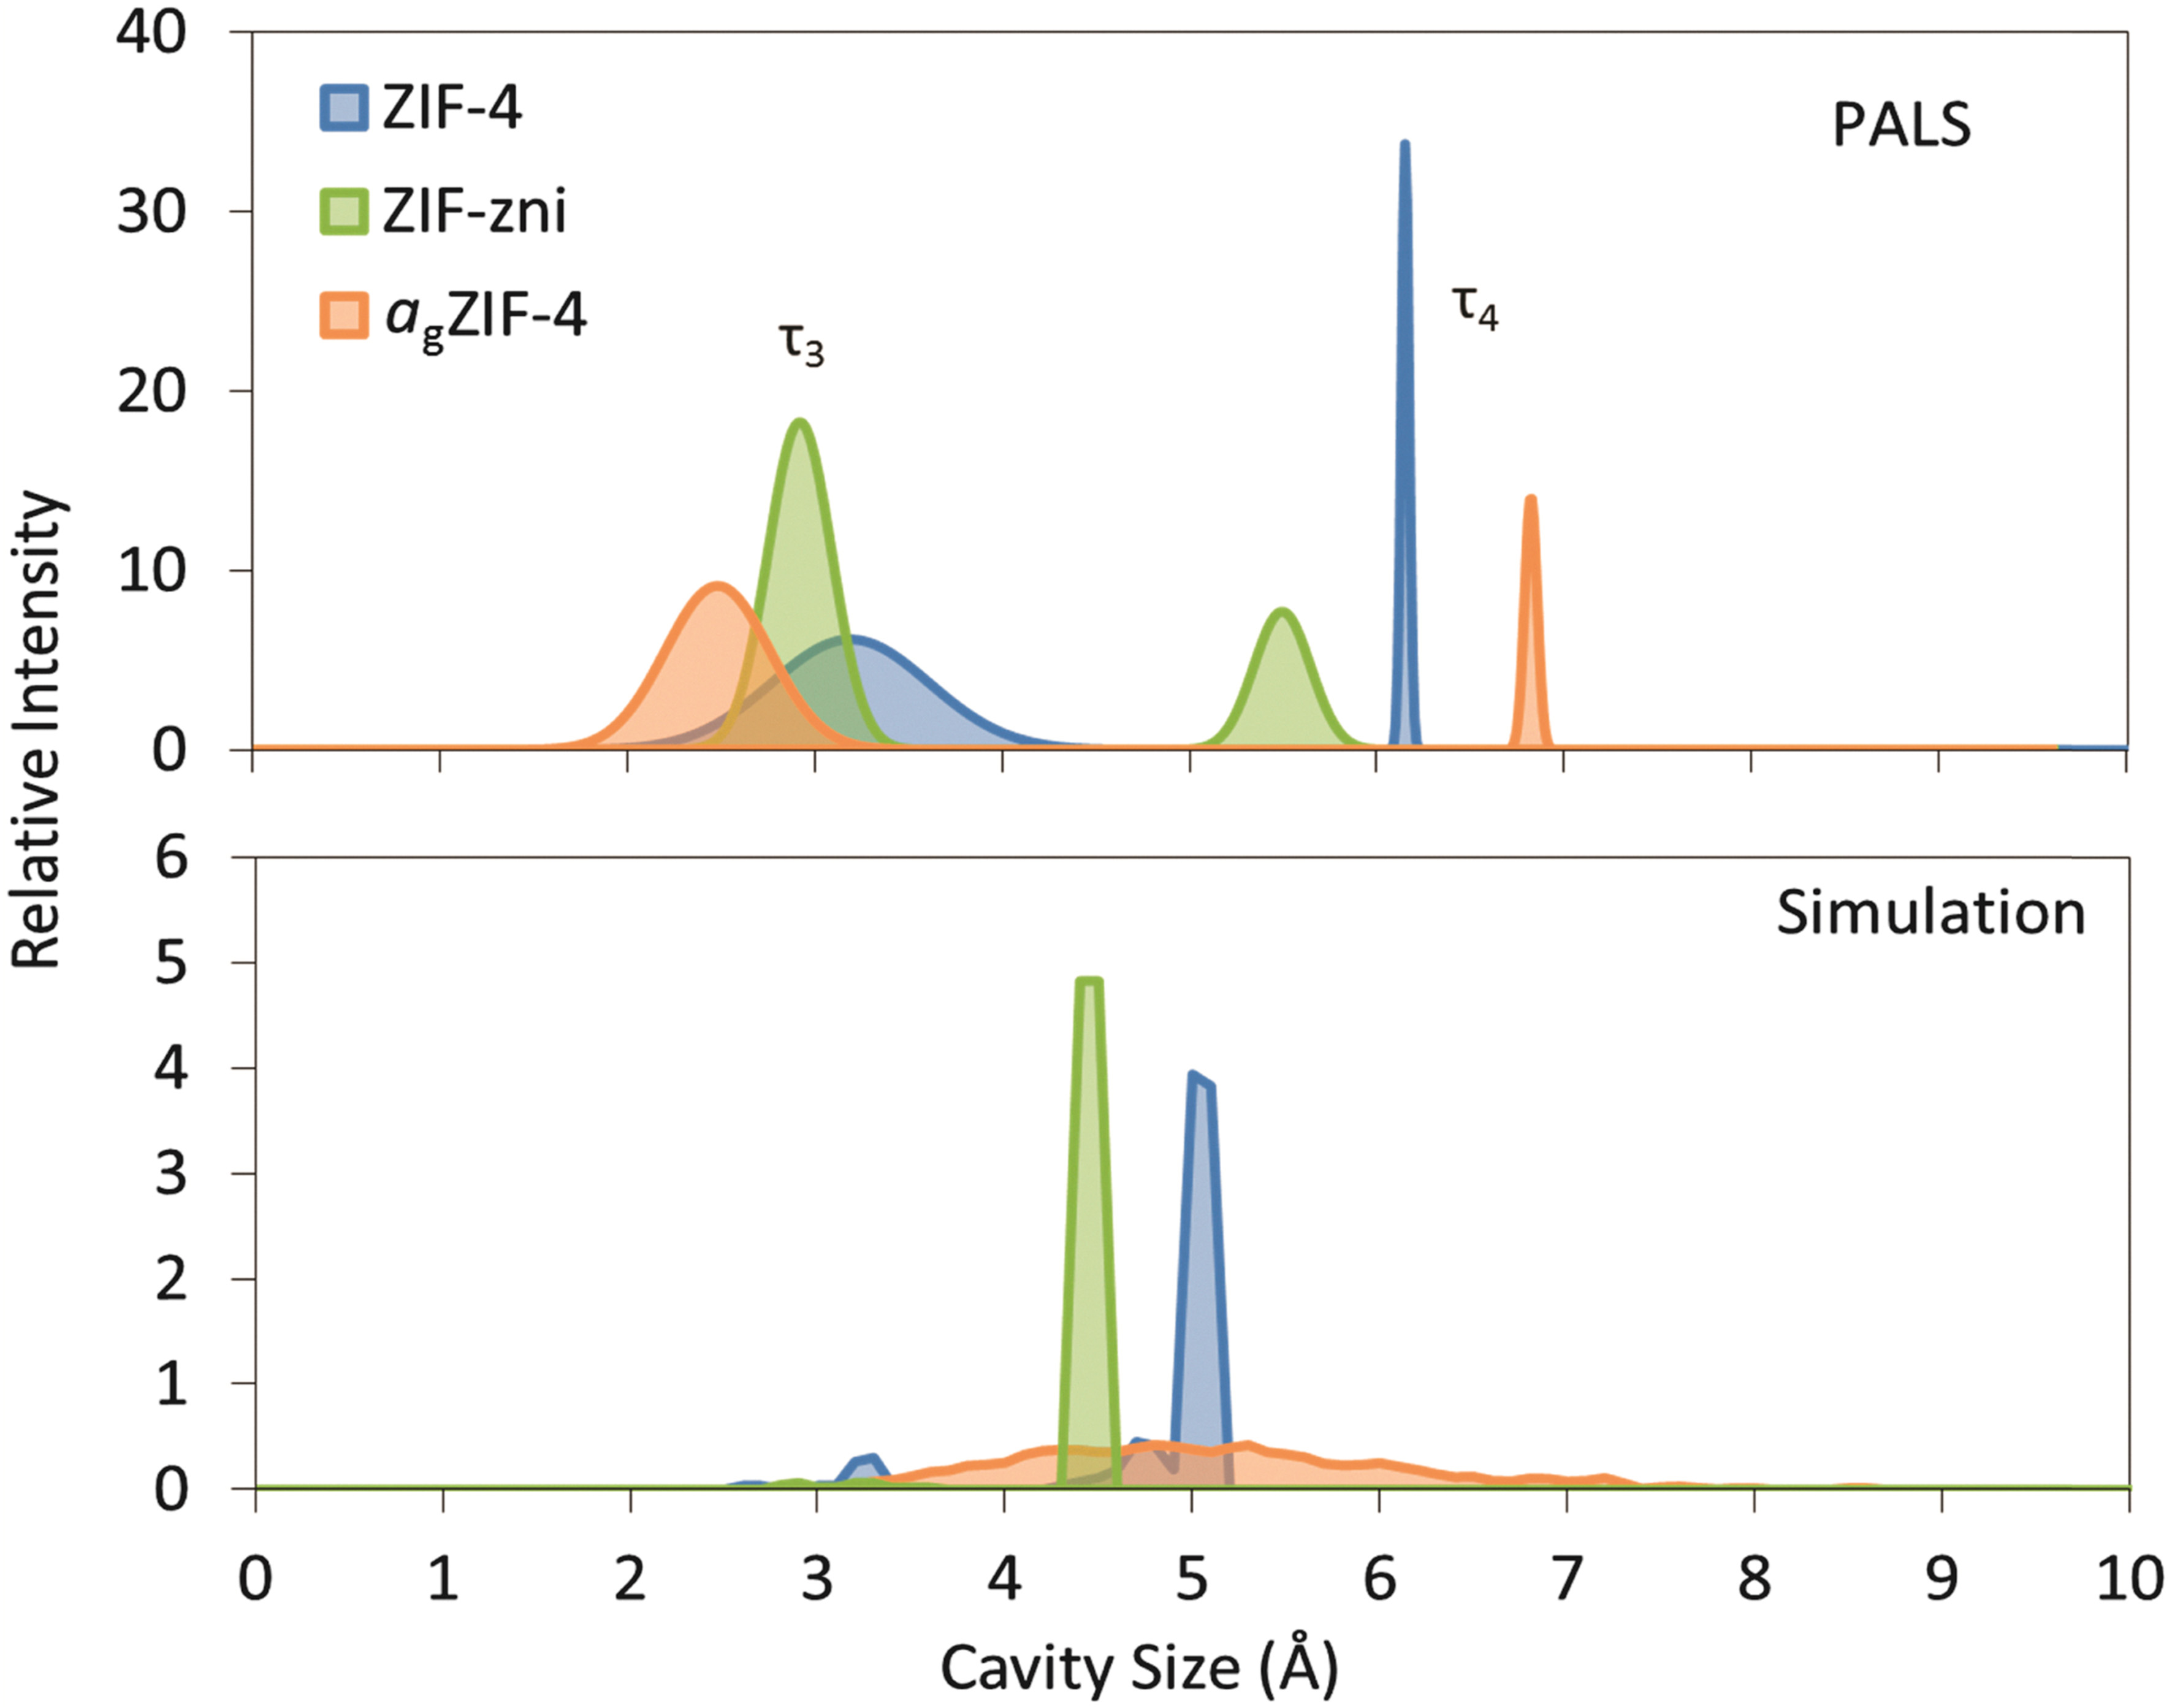
Figure 14. Pore size distributions measured with PALS and simulated with Zeo++ for ZIF-4, ZIF-zni and agZIF-4. PALS results for the third and fourth components (τ3 and τ4) are represented as Gaussian distributions which correspond to the small and large cavities, respectively. This figure is quoted with permission from reference[46], licensed under CC BY 3.0. PALS: Positron annihilation lifetime spectroscopy.

